
Research article · 2026 · Full text
International Journal of Biology SciencesEvaluating the impact of seasonal rainfall on pollinator insect abundance in a suburban corridor of Addis Ababa, Ethiopia
Volume 8(3) · Pages 160–164 · DOI: 10.33545/26649926.2026.v8.i3b.929 ↗
Research areasPlant and animal studiesInsect and Arachnid Ecology and BehaviorInsect-Plant Interactions and Control
Abstract
Author-writtenPollinator insects constitute an indispensable functional group whose abundance and activity patterns are inherently linked to seasonal precipitation regimes, yet empirical documentation of these relationships in highland East African suburban landscapes remains notably deficient. This research quantified the influence of seasonal rainfall on pollinator insect abundance across a suburban corridor extending from the eastern margin of Addis Ababa toward Bishoftu, Ethiopia, spanning three distinct Ethiopian seasons from January 2025 to December 2025. Sampling employed pan traps, standardized transect walks, and timed floral observation plots at 15 stations distributed across residential, commercial, and peri-agricultural land-use zones. A total of 7,823 pollinator specimens representing 98 species were recorded, with Hymenoptera contributing 67.4% of individuals and Lepidoptera 21.8%. Apis mellifera was the most numerically dominant species, representing 18.7% of all pollinators. Abundance was highest during the Kiremt rainy season (June-September, mean 234.5±18.7 individuals per station per month) and lowest during the Bega dry season (October-February, mean 78.3±12.4). Rainfall showed a strong positive correlation with total pollinator abundance (R² = 0.81, p<0.001), mediated primarily through its effect on flowering plant density (path coefficient = 0.73). Peri-agricultural zones supported 2.4 times more pollinator species than commercial areas. The findings establish that rainfall-driven floral resource pulses are the primary mechanism governing pollinator abundance dynamics in this highland suburban setting and recommend that urban greening initiatives prioritize drought-tolerant flowering species to buffer dry-season pollinator declines.
Summary
Source-checkedPlain-language reading of the full paper, prepared with AI and checked against the text. Each point links to the authors' own words.
Why it matters
- Animal pollinators, primarily insects, are essential for the reproduction of about 37% of the world's flowering plant species. View evidence ↗
- There is a significant lack of empirical data on pollinators in sub-Saharan African urban and peri-urban areas, which is problematic given the rapid urbanization in these regions. View evidence ↗
- Addis Ababa experienced a 31% expansion of its built-up area between 2015 and 2025, particularly in its eastern and southern suburban corridors. View evidence ↗
The question
- The study aimed to evaluate how seasonal rainfall affects the abundance of pollinator insects in a suburban corridor between Addis Ababa and Bishoftu. View evidence ↗
What they did
- The study took place along a 24-km suburban corridor in Ethiopia, extending from the Bole sub-city of Addis Ababa toward Bishoftu. View evidence ↗
What they found
- The study recorded 7,823 pollinator specimens from 98 species, with Hymenoptera (67.4%) and Lepidoptera (21.8%) being the most common groups. View evidence ↗
- Apis mellifera was the most dominant species, accounting for 18.7% of all recorded pollinators. View evidence ↗
- Pollinator abundance peaked during the Kiremt rainy season (mean 234.5±18.7 individuals/station/month) and was lowest during the Bega dry season (mean 78.3±12.4 individuals). View evidence ↗
- Rainfall strongly correlated with pollinator abundance (R² = 0.81), primarily because rainfall increases the density of flowering plants (path coefficient = 0.73). View evidence ↗
- Peri-agricultural zones had the highest species richness (62±4.1 species), which was 2.4 times higher than in commercial areas and 1.5 times higher than in residential suburbs. View evidence ↗
- Different groups showed varying resilience to the dry season: butterflies dropped to 14.3% of their peak abundance, while Apis species retained 56.7%. View evidence ↗
What it means
- The authors recommend that urban greening initiatives prioritize drought-tolerant indigenous flowering species to reduce pollinator declines during the dry season. View evidence ↗
- The study's findings may be limited by the single-year sampling period, which prevents generalization to years with unusual rainfall. View evidence ↗
- The dataset underrepresents nocturnal pollinators, such as moths, because they were not systematically sampled. View evidence ↗
Visual summary
3 visualsIllustrations explain the paper; charts are replotted from the paper's own table values.
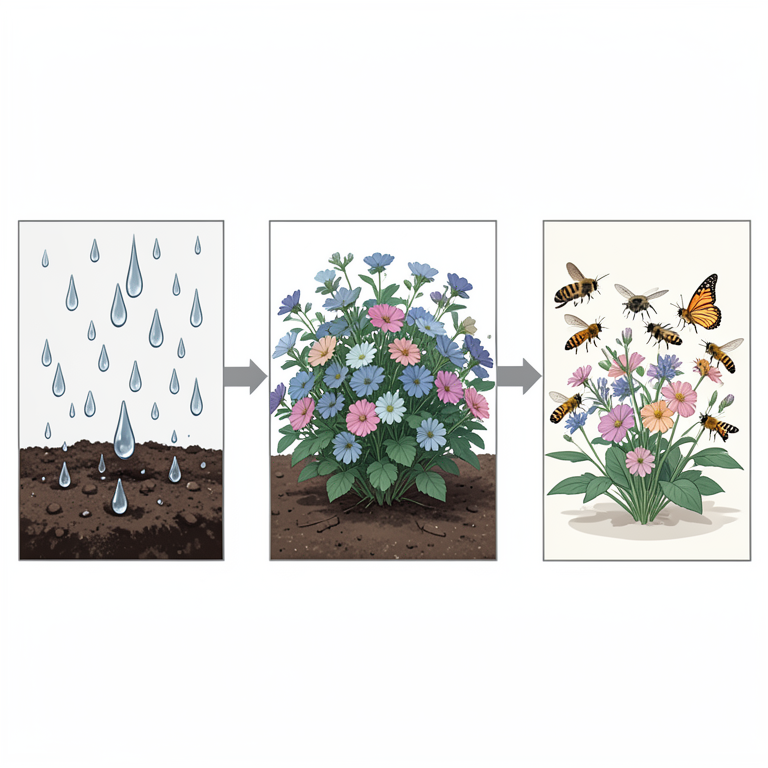
Rainfall-Pollinator Mechanism
AI-generated conceptual illustration (pollinator insects and flowering plants in a suburban Ethiopian landscape). It explains the idea and does not show study data.
View source evidence ↗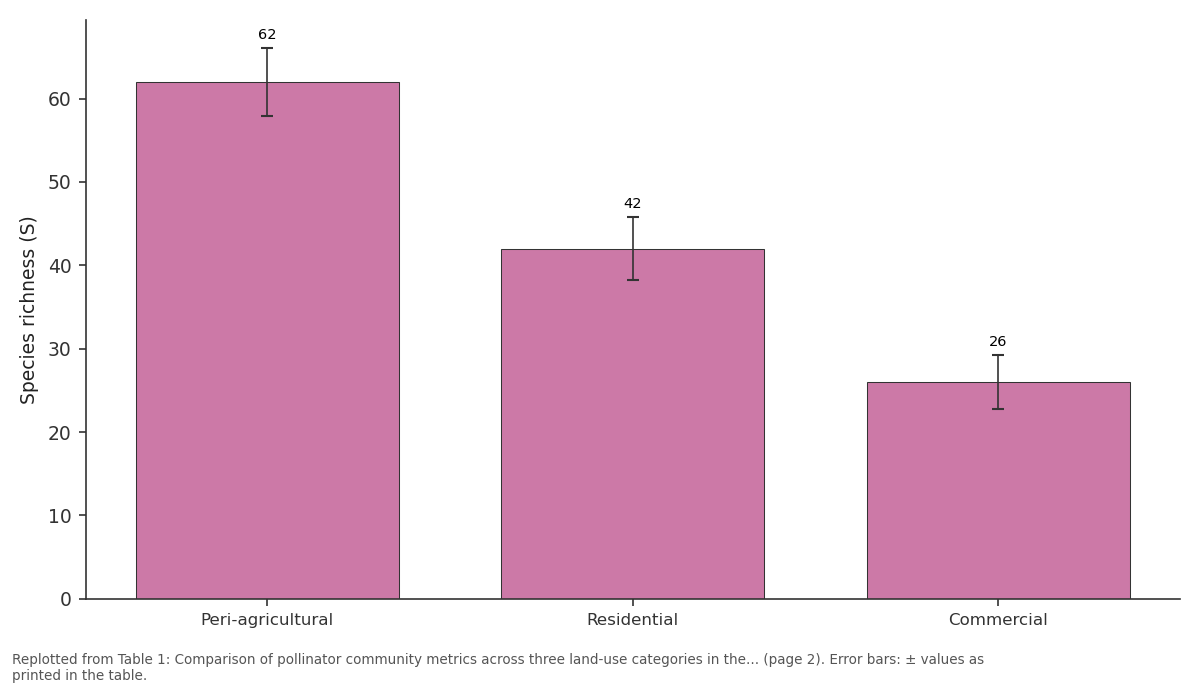
Species richness (S): Peri-agricultural vs Residential vs Commercial
Replotted from Table 1 (page 2) of the original paper. Every bar is the paper's own table value.
View source evidence ↗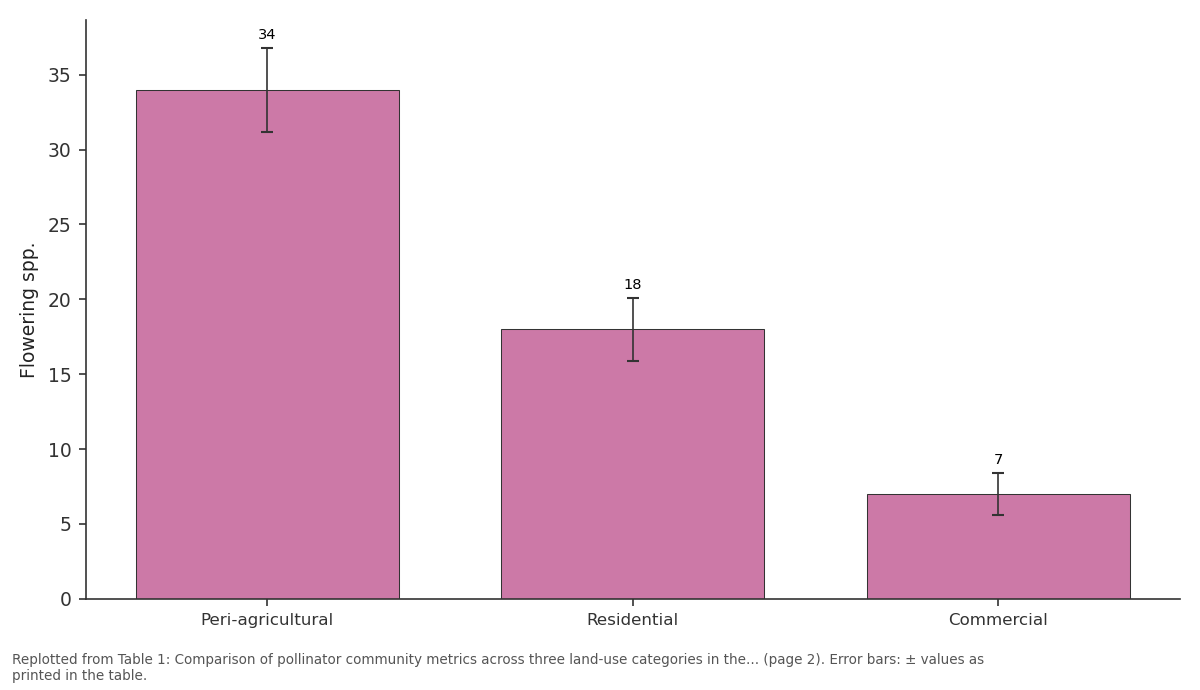
Flowering spp.: Peri-agricultural vs Residential vs Commercial
Replotted from Table 1 (page 2) of the original paper. Every bar is the paper's own table value.
View source evidence ↗Figures & tables
From the original paper Table 1
 Table 2
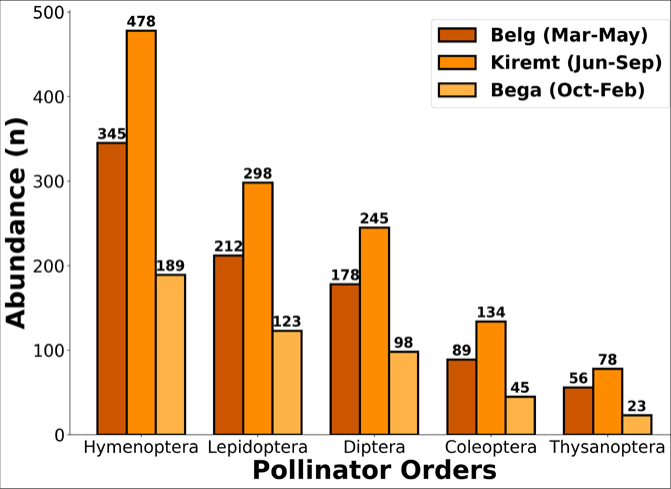 Figure 1
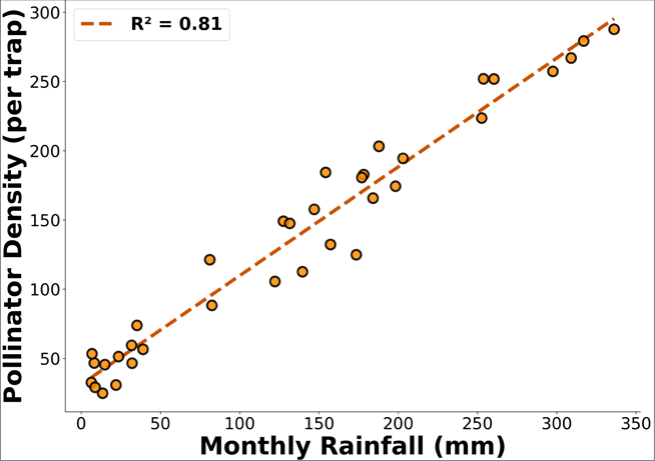 Figure 2
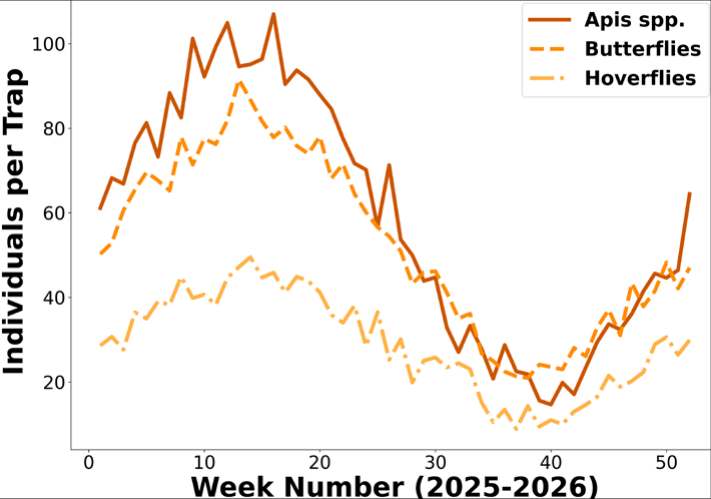 Figure 3
Introduction
In the year 2025, approximately 37% of all flowering plant species worldwide depend wholly or partially on animal pollinators for reproduction, with insects constituting the dominant pollinator taxon across most terrestrial biomes [1] . The abundance and diversity of pollinator insects are therefore fundamental determinants of plant community structure, agricultural productivity, and ecosystem resilience [2] . Despite growing global concern over pollinator declines, empirical data from sub-Saharan African urban and peri-urban landscapes remain remarkably sparse, creating a critical knowledge gap in regions experiencing rapid urbanization [3] . Addis Ababa, situated at elevations of 2,200-2,800 m on the Ethiopian Highlands, represents a unique urban ecological context characterized by moderate temperatures, seasonal rainfall patterns, and proximity to Afromontane vegetation remnants [4] . The city has expanded its built-up area by approximately 31% between 2015 and 2025, with particularly rapid suburban development along eastern and southern corridors [5] . This expansion progressively replaces agricultural land and grassland habitats with residential and commercial infrastructure, altering the floral landscape upon which pollinator communities depend. Ethiopian climate follows a trimodal seasonal pattern: Bega (dry season, October-February), Belg (short rains, March-May), and Kiremt (major rains, June-September) [6] . These seasonal phases produce dramatic fluctuations in floral resource availability, which are expected to drive corresponding oscillations in pollinator abundance and activity [7] . However, the specific quantitative relationships between rainfall patterns, floral resource dynamics, and pollinator population responses in highland Ethiopian suburban settings have not been systematically investigated. This research addressed this gap by evaluating the impact of seasonal rainfall on pollinator insect abundance in a suburban corridor extending from Addis Ababa toward the Bishoftu area, with the objectives of quantifying seasonal abundance patterns across pollinator groups, identifying the environmental mechanisms mediating rainfall effects on pollinators, and assessing the influence of land-use type on pollinator community structure.
Material and methods
Material and methods
Material
The research was conducted along a 24-km suburban corridor extending eastward from the Bole sub-city of Addis Ababa (8°59'N, 38°47'E) toward Bishoftu/Debre Zeyit (8°45'N, 38°58'E) in the East Shewa Zone of Oromia Region, Ethiopia. The corridor traverses an elevation gradient from 2,355 m to 1,920 m and encompasses the active zone of suburban expansion along the Addis Ababa-Adama highway. The climate is classified as subtropical highland (Cwb), with mean annual rainfall of 1,089 mm concentrated primarily during Kiremt. Mean annual temperature is 16.4 °C, ranging from 8.2 °C (December nights) to 25.7 °C (March afternoons). Fifteen sampling stations were established across three landuse categories: residential suburbs (R1-R5, characterized by mixed gardens, ornamental trees, and low-density housing), commercial-industrial areas (C1-C5, including roadside service zones, warehousing, and light manufacturing areas), and peri-agricultural zones (A1-A5, comprising smallholder farmland with hedgerows, field margins, and scattered Eucalyptus plantations). Stations within each category were separated by minimum distances of 1.2 km.
Methods
Pollinator sampling was conducted biweekly from January through December 2025, yielding 26 sampling rounds per station. Three complementary methods were employed: (1) Pan traps consisting of three fluorescent bowls (yellow, blue, white; 15 cm diameter) filled with soapy water, deployed at ground level and at 1.5 m height for 24-hour periods; (2) Standardized transect walks of 200 m length, conducted between 09:00 and 12:00 during favorable conditions (temperature >15 °C, wind <20 km/h), during which all flower-visiting insects were recorded and representative specimens collected; (3) Timed floral observation plots (2 × 2 m quadrats centered on flowering patches, 15-minute observation periods, recording all insect visitors to flowers). Specimens were identified at the Insect Science Laboratory of Addis Ababa University using regional taxonomic keys. Hymenoptera identification followed Eardley's keys for East African bees and Bolton's keys for Formicidae. Lepidoptera were identified using Larsen's illustrated guide to butterflies of East Africa. Diptera (Syrphidae and other flower-visiting families) were identified using the Manual of Afrotropical Diptera. Environmental monitoring included: continuous temperature and humidity logging at five representative stations (Onset HOBO MX2301); monthly flowering plant surveys recording species identity, flower density (flowers per m²), and bloom phenology along each transect; monthly soil moisture measurements (Delta-T SM150T sensor); and rainfall data from the National Meteorological Agency station at Bole International Airport. Path analysis was employed to disentangle direct and indirect effects of rainfall on pollinator abundance, with flowering plant density as the hypothesized mediating variable. The model was fitted using the lavaan package in R version 4.4.1. Additional analyses included Kruskal-Wallis tests for land-use comparisons, Spearman rank correlations for environmental relationships, and rarefaction analysis for species richness estimation using the iNEXT package.
Results
Over the 12-month sampling period, 7,823 pollinator specimens representing 98 species were documented across all 15 sampling stations. Hymenoptera dominated numerically (5,271 individuals, 67.4%), followed by Lepidoptera (1,703 individuals, 21.8%), Diptera (678 individuals, 8.7%), and Coleoptera (171 individuals, 2.2%). Within Hymenoptera, Apidae was the most abundant family (3,245 individuals), followed by Halictidae (1,123 individuals) and Megachilidae (567 individuals). Apis mellifera was the single most abundant species, contributing 1,462 individuals (18.7% of all pollinators).
Discussion
The documented rainfall-pollinator abundance relationship (R² = 0.81) establishes seasonal precipitation as the dominant environmental driver of pollinator population dynamics in the Addis Ababa suburban corridor. The mediation of this effect through flowering plant density, as demonstrated by path analysis, aligns with the conceptual framework of bottom-up trophic regulation, wherein primary productivity cascades upward through resource availability to shape consumer populations [8] . This finding parallels the results of tropical pollinator research in lowland settings, extending the generality of rainfall-floral resourcepollinator linkages to highland subtropical environments [9] . The differential seasonal resilience observed between Apis mellifera and other pollinator groups has practical implications for pollination service continuity. The relative constancy of Apis populations during the dry season likely reflects their eusocial colony organization, food storage capacity, and ability to exploit even sparse floral resources through efficient communication and foraging strategies [10] . In contrast, the dramatic seasonal decline of butterflies and hoverflies suggests that solitary or non-social pollinator species face disproportionate challenges during resourcelimited periods [11] . The substantially higher pollinator diversity in periagricultural zones compared to commercial and residential areas underscores the conservation importance of traditional smallholder farming landscapes. Kumari and Priya [12] reported analogous findings regarding enhanced insect biodiversity in less intensively managed suburban habitats, supporting the broader principle that land-use intensity inversely correlates with pollinator community complexity. The hedgerows, field margins, and diverse cropping systems characteristic of Ethiopian smallholder agriculture provide a mosaic of microhabitats and flowering resources that sustain more diverse pollinator assemblages than simplified urban landscapes [13] .
The detection of a significant direct rainfall effect on pollinator abundance, independent of floral resources, suggests that moisture availability influences pollinator activity through additional mechanisms. These may include reduced desiccation stress, enhanced nectar production rates in existing flowers, and improved flight conditions during humid periods [14] . This finding implies that even in landscapes with artificially maintained floral resources (e.g., irrigated gardens), natural rainfall patterns will continue to influence pollinator population dynamics [15] . The research provides evidence-based recommendations for urban greening strategies that target pollinator conservation in Addis Ababa's expanding suburban areas. The observed dry-season bottleneck in floral resources suggests that prioritizing drought-tolerant indigenous flowering species in urban plantings could substantially buffer seasonal pollinator declines [16] . Species such as Bidens macroptera, Guizotia scabra, and Vernonia amygdalina, which flower during or shortly after the Kiremt season, should be complemented with Bega-flowering species to extend the period of resource availability [17] .
Conclusion
This research establishes that seasonal rainfall is the primary environmental driver of pollinator insect abundance in the Addis Ababa suburban corridor, operating predominantly through its effect on flowering plant density. The documentation of 98 pollinator species across the corridor provides an essential biodiversity baseline for a region undergoing rapid urbanization.
Limitations
The single-year sampling period limits generalization across years with atypical rainfall patterns. Pan trap efficiency varies with background floral color, potentially introducing habitat-dependent sampling bias. The inability to achieve species-level identification for all Diptera (Syrphidae resolved to genus for some specimens) may have slightly underestimated true species diversity. Nocturnal pollinators (moths) were not systematically sampled and thus are underrepresented in the dataset.
Acknowledgement
AcknowledgementsFinancial support was provided by the Addis Ababa University Thematic Research Program. The Ethiopian Meteorological Agency supplied rainfall data. The authors thank Ato Dereje Kebede for assistance with bee identification and Wzt. Tigist Mengistu for botanical survey support. The Bole Sub-City Administration facilitated access to residential sampling sites.
Figures and tables from the paper
| Metric | Peri-agricultural | Residential | Commercial |
|---|---|---|---|
| Species richness (S) | 62±4.1 | 42±3.8 | 26±3.2 |
| Shannon (H') | 3.24±0.11 | 2.67±0.15 | 1.89±0.22 |
| Simpson (1-D) | 0.93±0.02 | 0.86±0.03 | 0.72±0.05 |
| Flowering spp. | 34±2.8 | 18±2.1 | 7±1.4 |
| Flower density/m² | 12.4±2.3 | 6.8±1.5 | 1.9±0.8 |
| Total abundance | 3,567 | 2,845 | 1,411 |
Table text extracted from the original PDF; superscript letters are shown inline. The original table image is below.
View original table image
| Species | Order | Season Pref. | Habitat | n |
|---|---|---|---|---|
| Apis mellifera | Hymenoptera | Year-round | Generalist | 1,462 |
| Xylocopa caffra | Hymenoptera | Kiremt | Peri-agri. | 456 |
| Danaus chrysippus | Lepidoptera | Belg-Kiremt | Open areas | 312 |
| Halictus jucundus | Hymenoptera | Kiremt | Peri-agri. | 289 |
| Eristalis tenax | Diptera | Kiremt | Gardens | 234 |
| Belenois aurota | Lepidoptera | Kiremt | Open areas | 198 |
| Megachile niveicauda | Hymenoptera | Belg | Peri-agri. | 178 |
| Junonia hierta | Lepidoptera | Belg-Kiremt | Gardens | 156 |
Table text extracted from the original PDF; superscript letters are shown inline. The original table image is below.
View original table image
References
19 in the original paper- Klein AM, Vaissière BE, Cane JH, Steffan-Dewenter I, Cunningham SA, Kremen C, et al. Importance of pollinators in changing landscapes for world crops. Proc R Soc B. 2007;274(1608):303-313.
- Potts SG, Biesmeijer JC, Kremen C, Neumann P, Schweiger O, Kunin WE. Global pollinator declines: Trends, impacts and drivers. Trends Ecol Evol. 2010;25(6):345-353.
- Archer CR, Pirk CWW, Carvalheiro LG, Nicolson SW. Economic and ecological implications of geographic bias in pollinator ecology. Oikos. 2014;123(4):401-407.
- Friis I, Demissew S, van Breugel P. Atlas of the Potential Vegetation of Ethiopia. Copenhagen: Det Kongelige Danske Videnskabernes Selskab; 2010. p. 56-78.
- Terfa BK, Chen N, Zhang X, Niyogi D. Spatial configuration and extent explains the urban heat island in Addis Ababa during wet and dry seasons. Remote Sens. 2020;12(21):3507.
- Diro GT, Grimes DIF, Black E. Teleconnections between Ethiopian summer rainfall and sea surface temperature. Int J Climatol. 2011;31(11):1687-1696.
- Gikungu MW, Wittmann D, Hoppe A. Bee diversity and pollination of coffee and mango in Kakamega Forest, western Kenya. Apidologie. 2011;42(3):261271.
- Scherber C, Eisenhauer N, Weisser WW, Schmid B, Marquardt M, Fischer M, et al. Bottom-up effects of plant diversity on multitrophic interactions in a biodiversity experiment. Nature. 2010;468(7323):553556.
- Roubik DW. Ecology and Natural History of Tropical Bees. Cambridge: Cambridge University Press; 1989. p. 189-213.
- Seeley TD. The Wisdom of the Hive: The Social Physiology of Honey Bee Colonies. Cambridge: Harvard University Press; 1995. p. 78-112.
- Rader R, Bartomeus I, Garibaldi LA, Garratt MPD, Howlett BG, Winfree R, et al. Non-bee insects are important contributors to global crop pollination. Proc Natl Acad Sci U S A. 2016;113(1):146-151.
- Kumari B, Priya A. Seasonal variation in insect biodiversity in a transitioning sub-urban area. Zool Entomol Lett. 2022;2(1):42-49.
- Tscharntke T, Clough Y, Wanger TC, Jackson L, Motzke I, Perfecto I, et al. Global food security, biodiversity conservation and the future of agricultural intensification. Biol Conserv. 2012;151(1):53-59.
- Corbet SA. Nectar sugar content: Estimating standing crop and secretion rate in the field. Apidologie. 2003;34(1):1-10.
- Willmer PG. Microclimatic effects on insects at the plant surface. In: Juniper BE, Southwood TRE, editors. Insects and the Plant Surface. London: Arnold; 1986. p. 65-80.
- Lowenstein DM, Matteson KC, Minor ES. Diversity of wild bees supports pollination services in an urbanized landscape. Oecologia. 2015;179(3):811-821.
- Demissew S, Nordal I. Flowers of Ethiopia and Eritrea: Aloes and Other Lilies. Addis Ababa: Shama Books; 2010. p. 134-156.
- Vanbergen AJ, Garratt MPD, Baude M, Biesmeijer JC, Britton NF, Brown MJF, et al. Threats to an ecosystem service: Pressures on pollinators. Front Ecol Environ. 2013;11(5):251-259.
- Dicks LV, Viana B, Bommarco R, Brosi B, Arizmendi MDC, Cunningham SA, et al. Ten policies for pollinators. Science. 2016;354(6315):975-976.