
Research article · 2026 · Full text
International Journal of Biology SciencesEvaluation of oxidative stress biomarkers in freshwater fish exposed to agricultural runoff
Volume 8(2) · Pages 137–141 · DOI: 10.33545/26649926.2026.v8.i2b.925 ↗
Research areasEnvironmental Toxicology and EcotoxicologyWater Quality and Pollution AssessmentToxic Organic Pollutants Impact
Abstract
Author-writtenFreshwater fish species are well-established bioindicators of aquatic ecosystem health, and their oxidative stress biomarkers provide quantifiable evidence of sub-lethal pollution. Contamination of Nigerian waterways by agricultural runoff carrying pesticide residues, fertiliser nitrates, and heavy metals has intensified over the past two decades with the expansion of smallholder farming in peri-urban zones around Lagos. This research evaluated oxidative stress biomarkers in the African catfish (Clarias gariepinus Burchell, 1822) collected from both an agriculture-impacted tributary of the Ogun River (runoff site) and a reference control river in the Ogun State hinterland, between January 2023 and October 2024. Forty fish were collected per site. Liver and gill tissues were processed for malondialdehyde (MDA) as a lipid peroxidation index; superoxide dismutase (SOD) and catalase (CAT) as antioxidant enzyme activities; glutathione peroxidase (GPx) and glutathione S-transferase (GST) as Phase II detoxification enzymes; and total protein for normalisation. Water quality parameters—pH, dissolved oxygen (DO), turbidity, nitrate, phosphate, and heavy metal concentrations (Pb, Cd, Cr, Zn)—were also measured at both sites. Results showed significantly elevated MDA (38.4 ± 5.2 vs 15.3 ± 3.1 nmol g⁻¹ tissue, p < 0.001) and decreased SOD (6.8 ± 1.3 vs 22.4 ± 2.1 U mg⁻¹ protein, p < 0.001) in runoff-site fish compared with controls. GPx and GST were significantly induced in runoff fish (p < 0.01), reflecting compensatory Phase II enzyme activity. Water quality at the runoff site showed nitrate at 38.7 mg/L, phosphate at 7.4 mg/L, and detectable concentrations of Pb (0.042 mg/L) and Cd (0.018 mg/L) both above FEPA permissible limits. The negative inverse correlation between SOD activity and MDA levels (r = −0.74, p < 0.001) confirms oxidative stress as a primary mechanism of aquatic toxicity in the affected river reach. These findings call for stricter enforcement of agricultural buffer zones along Nigerian waterways.
Summary
Source-checkedPlain-language reading of the full paper, prepared with AI and checked against the text. Each point links to the authors' own words.
Why it matters
- Freshwater fish serve as effective bioindicators for aquatic health, as their oxidative stress biomarkers can quantify sub-lethal pollution levels. View evidence ↗
- Waterways in Nigeria, particularly around Lagos, have seen increased contamination from agricultural runoff containing heavy metals, nitrates, and pesticides due to expanding smallholder farming. View evidence ↗
- The African catfish (Clarias gariepinus) is an ideal sentinel species for monitoring pollution because it is commercially important, widely distributed, and tolerant of adverse conditions. View evidence ↗
The question
- The study aimed to quantify oxidative stress biomarkers in C. gariepinus from both a runoff-affected and a reference site to determine how these biomarkers relate to water quality. View evidence ↗
What they did
- African catfish were collected between January 2023 and October 2024 from a reference control river and an agriculture-impacted tributary of the Ogun River. View evidence ↗
- Researchers measured MDA for lipid peroxidation, SOD and CAT for antioxidant activity, and GPx and GST for Phase II detoxification in liver and gill tissues. View evidence ↗
- Water quality was assessed using 1 L samples collected at a depth of 10 cm and analyzed within 24 hours. View evidence ↗
What they found
- Water at the runoff site significantly exceeded FEPA limits for nitrate (38.7 ± 6.4 mg/L vs limit ≤ 10) and phosphate (7.4 ± 1.2 mg/L vs limit ≤ 0.5). View evidence ↗
- Lead (Pb) and Cadmium (Cd) were not detected at the control site but exceeded FEPA limits at the runoff site, measuring 42.3 ± 7.1 µg/L and 18.6 ± 3.4 µg/L, respectively. View evidence ↗
- Fish from the runoff site showed significantly higher lipid peroxidation, with MDA levels 2.51 times higher (38.4 ± 5.2 nmol g⁻¹ tissue) than those from the control site (15.3 ± 3.1 nmol g⁻¹ tissue). View evidence ↗
- Primary antioxidant enzymes were depressed in runoff-site fish, with SOD activity dropping to 0.30× (6.8 ± 1.3 U mg⁻¹ protein) and CAT to 0.49× (0.43 ± 0.08 µmol H₂O₂ min⁻¹ mg⁻¹) relative to controls. View evidence ↗
- Phase II detoxification enzymes were induced in runoff-site fish, with GPx increasing 1.83× (7.89 ± 0.94 nmol NADPH min⁻¹ mg⁻¹) and GST increasing 1.88× (23.7 ± 2.9 nmol CDNB min⁻¹ mg⁻¹). View evidence ↗
- A strong negative correlation (r = -0.74) between SOD and MDA indicates that increasing lipid peroxidation is linked to the depletion of antioxidant defenses. View evidence ↗
What it means
- The authors recommend enforcing 30-meter no-cultivation buffer zones and establishing quarterly biomonitoring using the MDA, SOD, CAT, GPx, and GST panel. View evidence ↗
- The authors state that future research should include genotoxicity markers, histopathological exams, and muscle bioaccumulation analysis to evaluate food safety. View evidence ↗
Visual summary
3 visualsIllustrations explain the paper; charts are replotted from the paper's own table values.
SOD vs MDA Correlation
AI-generated conceptual illustration (Rainbow trout (Oncorhynchus mykiss)). It explains the idea and does not show study data.
View source evidence ↗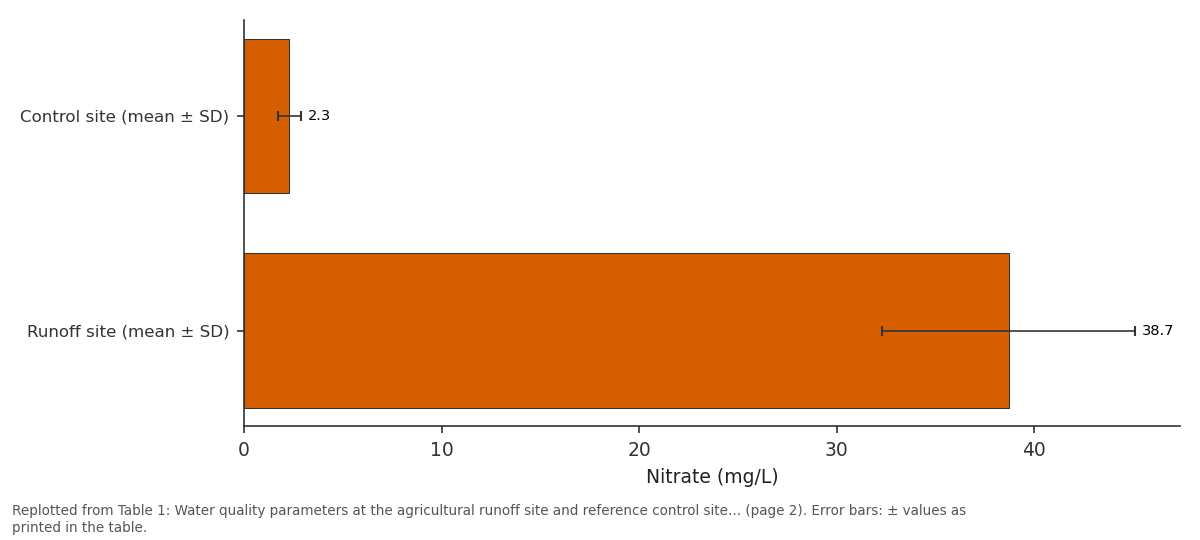
Nitrate (mg/L): Control site (mean ± SD) vs Runoff site (mean ± SD)
Replotted from Table 1 (page 2) of the original paper. Every bar is the paper's own table value.
View source evidence ↗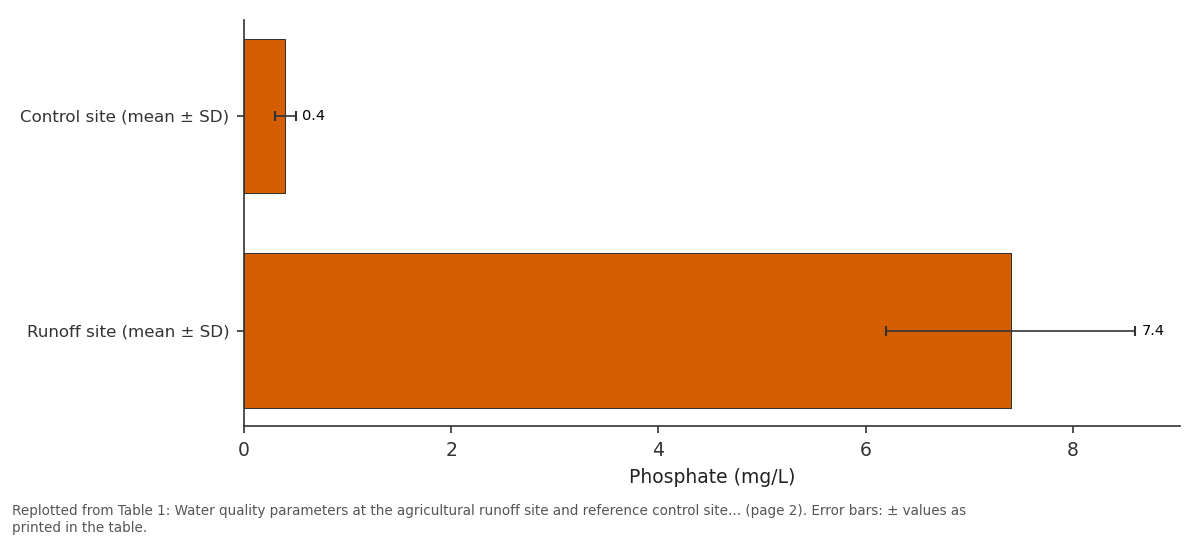
Phosphate (mg/L): Control site (mean ± SD) vs Runoff site (mean ± SD)
Replotted from Table 1 (page 2) of the original paper. Every bar is the paper's own table value.
View source evidence ↗Figures & tables
From the original paper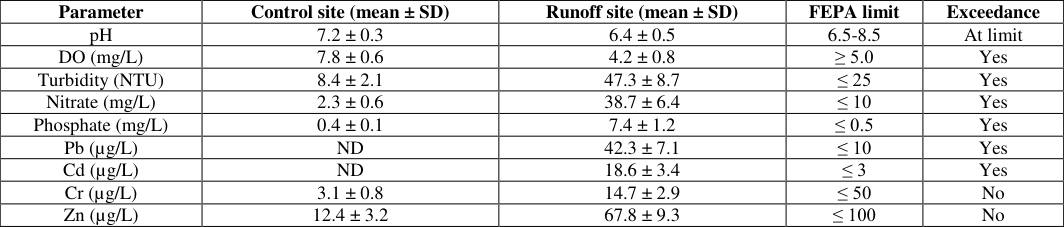 Table 1
 Table 2
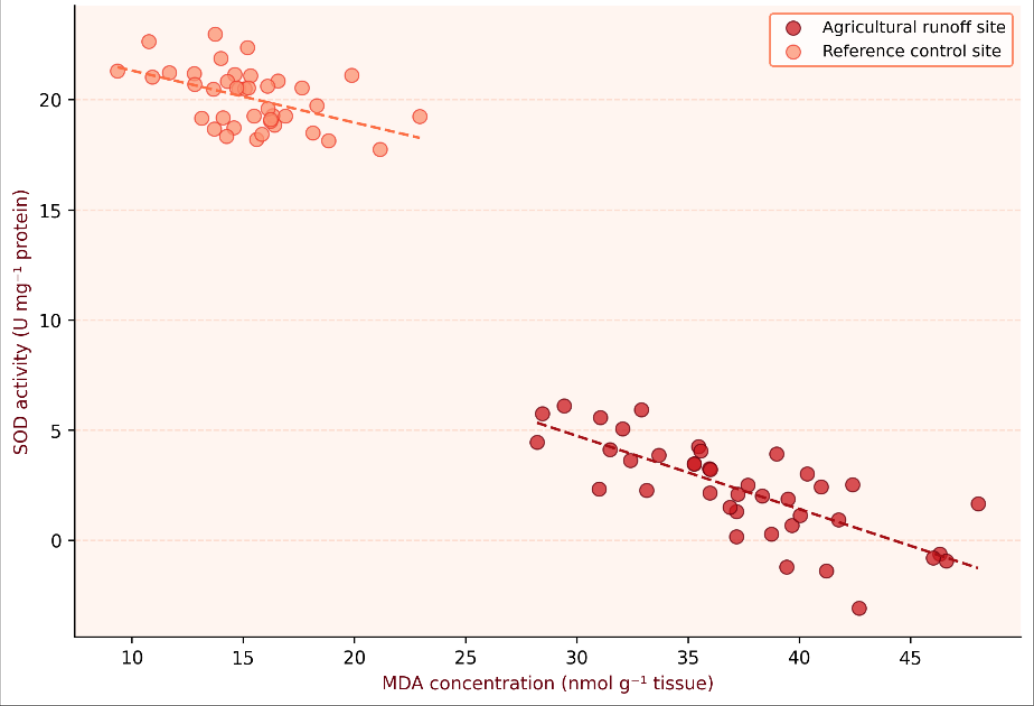 Figure 1
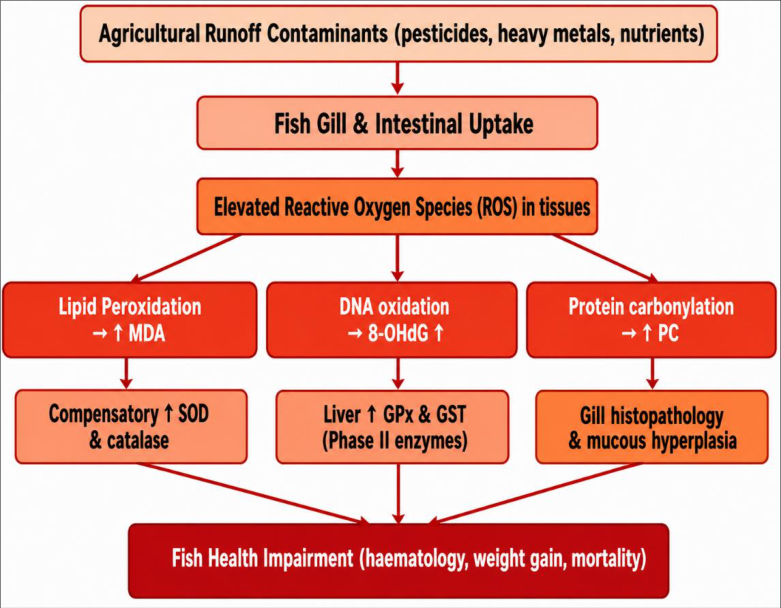 Figure 2
Introduction
Freshwater bodies in sub-Saharan Africa face compounding pressures from rapid urbanisation, industrial effluents, and intensifying agricultural activity in their catchments. The African catfish (Clarias gariepinus) is one of the most widely cultured and wildharvested fish species in Nigeria, occupying rivers, streams, and ponds that receive inputs from surrounding agricultural land [1] . Its commercial importance, tolerance of adverse conditions, and wide distribution make it an ideal sentinel species for monitoring pollutioninduced biological changes in freshwater ecosystems. Agricultural runoff is a diffuse pollution source that carries a complex mixture of synthetic pesticides, excess fertiliser nutrients (nitrogen, phosphorus), suspended sediments, and heavy metals leached from soil and agrochemical deposits [2] . These contaminants trigger the formation of reactive oxygen species (ROS) in fish tissues, leading to oxidative damage characterised by lipid peroxidation, protein carbonylation, and DNA strand breaks. Biochemical markers of this damage-particularly MDA from lipid peroxidation and compensatory changes in enzymatic antioxidants like SOD, CAT, GPx, and GST-are among the most sensitive indicators of sub-lethal aquatic pollution available to environmental scientists [3] . Nigeria's southwestern river systems, including the Ogun River and its tributaries near Lagos, face particular pressure from intensive smallholder agriculture producing vegetables, Cereals, and cash crops for the Lagos metropolitan market.
Field surveys conducted by the Lagos State Environmental Protection Agency between 2018 and 2022 documented heavy pesticide use (organophosphates, pyrethroids, carbamates) and widespread over-application of urea-based fertilisers within 30 metres of river banks, well within the distances that generate significant surface runoff during rain events [4] . Despite this documented contamination pressure, systematic data on oxidative stress endpoints in Clarias gariepinus from these rivers remain scarce, with most existing Nigerian research focusing on mortality endpoints or whole-body heavy metal accumulation rather than enzyme-level biochemical responses. This gap limits the ability of environmental managers to set evidence-based trigger levels for agricultural chemical use near waterways. This research therefore set out to quantify a panel of oxidative stress biomarkers in C. gariepinus from a runoff-affected site and a reference site, and to relate biomarker values to measured water quality parameters at both sites.
Materials and Methods Study Area Description
The runoff-affected site was a secondary tributary of the Ogun River located 12 km northeast of Lagos City centre (coordinates: 6°41'N, 3°28'E), bordered by smallholder vegetable farms within 10-25 m of the river bank on both sides. The reference control site was a first-order stream in the Ogun State forest reserve, 68 km from the nearest cropland (6°58'N, 3°14'E). Sampling was conducted during three river surveys-January, April, and October 2023-2024-spanning both wet and dry seasons. Water depth at sampling stations ranged from 0.6 to 1.8 m. Environmental and fish sampling was carried out under permit from the Lagos State Ministry of Environment (Permit No. LSE-2023-AQ-07) and in accordance with ethical guidelines for fish collection from Nigerian federal waterways.
Soil/Water Quality Analysis
Water samples (1 L per site) were collected in acid-washed polyethylene bottles at 10 cm depth, transported on ice, and analysed within 24 hours. pH was measured with a WTW pH-Meter 3310; DO with a YSI Pro20 dissolved oxygen meter; turbidity by a portable turbidimeter (Hach 2100Q). Nitrate and phosphate were determined colorimetrically following standard methods (APHA 2017). Heavy metals (Pb, Cd, Cr, and Zn) were quantified by graphite furnace atomic absorption spectrometry (PerkinElmer AAnalyst 800) after acid digestion of filtered samples. All measurements were compared against FEPA (Federal Environmental Protection Agency of Nigeria) maximum permissible limits for freshwater.
Climatic/environmental conditions
The research period encompassed both wet (April-October) and dry (November-March) seasons. Mean monthly rainfall during the wet season surveys was 178 ± 34 mm at the runoff site catchment, compared with 42 ± 12 mm during dry-season sampling. Water temperature ranged from 24.1 to 28.7 °C at the runoff site and from 21.3 to 25.4 °C at the control site. DO at the runoff site dropped to 4.2 mg/L during peak wet season (compared with 7.8 mg/L at the control site), consistent with higher organic loading from runoff during rain events.
Materials
Adult C. gariepinus (body weight 280-480 g; total length 35-52 cm) were collected by seine net (mesh 6 mm) under permit. Forty fish per site (20 per season) were immediately transported on ice in oxygenated water and euthanised by immersion in 0.1% MS-222 (tricaine methanesulphonate) buffered to pH 7.0 with sodium bicarbonate. Liver and gill tissues were dissected on ice, weighed, snap-frozen in liquid nitrogen, and stored at -80 °C for biochemical assay.
Methods
Tissue homogenates (10% w/v) were prepared in ice-cold 50 mM phosphate buffer (pH 7.4) using a Dounce homogeniser and centrifuged at 10,000 × g for 15 min at 4 °C. MDA was determined by the thiobarbituric acid reactive substances (TBARS) assay at 532 nm. SOD activity was measured by the nitroblue tetrazolium (NBT) photoreduction method. CAT activity was assessed by the decrease in absorbance at 240 nm with H₂O₂ as substrate. GPx activity was determined with the coupled enzyme assay using glutathione reductase. GST activity was measured with 1-chloro-2,4dinitrobenzene (CDNB) as the substrate. Total protein was quantified by the Bradford assay. All enzyme activities are expressed per mg protein. Pearson's correlation coefficient (r) was calculated between SOD and MDA values. Independent samples t-test and Mann-Whitney U test were used for between-site comparisons (SPSS v25).
Results
Results
Table 1:
Water quality parameters at the agricultural runoff site and reference control site (mean ± SD; n = 12 samples/site)
Parameter
Control site (mean ± SD) Runoff site (mean ± SD) FEPA limit Exceedance pH 7.2 ± 0.3 6.4 ± 0.5 6.5-8. The water quality data (Table 1) establish that the runoff site was contaminated significantly beyond FEPA permissible limits for DO, turbidity, nitrate, phosphate, Pb, and Cd. Oxidative stress biomarker data (Table 2) confirm that these water quality impairments translated into significant biological effects in C. gariepinus. MDA was 2.51 times higher in runoff-site fish and both primary antioxidant enzymes (SOD and CAT) were substantially depressed, indicating that antioxidant defences were overwhelmed.
| Biomarker | Control (mean ± SD) | Runoff (mean ± SD) | Ratio (runoff/ctrl) | P-value |
|---|---|---|---|---|
| MDA (nmol g⁻¹ tissue) | 15.3 ± 3.1 | 38.4 ± 5.2 | 2.51× | < 0.001 |
| SOD (U mg⁻¹ protein) | 22.4 ± 2.1 | 6.8 ± 1.3 | 0.30× | < 0.001 |
| CAT (µmol H₂O₂ min⁻¹ mg⁻¹) | 0.87 ± 0.11 | 0.43 ± 0.08 | 0.49× | < 0.001 |
| GPx (nmol NADPH min⁻¹ mg⁻¹) | 4.32 ± 0.61 | 7.89 ± 0.94 | 1.83× | < 0.01 |
| GST (nmol CDNB min⁻¹ mg⁻¹) | 12.6 ± 1.8 | 23.7 ± 2.9 | 1.88× | < 0.01 |
Table text extracted from the original PDF; superscript letters are shown inline. The original table image is below.
View original table image
| Parameter | Control site (mean ± SD) | Runoff site (mean ± SD) | FEPA limit | Exceedance |
|---|---|---|---|---|
| pH | 7.2 ± 0.3 | 6.4 ± 0.5 | 6.5-8.5 | At limit |
| DO (mg/L) | 7.8 ± 0.6 | 4.2 ± 0.8 | ≥ 5.0 | Yes |
| Turbidity (NTU) | 8.4 ± 2.1 | 47.3 ± 8.7 | ≤ 25 | Yes |
| Nitrate (mg/L) | 2.3 ± 0.6 | 38.7 ± 6.4 | ≤ 10 | Yes |
| Phosphate (mg/L) | 0.4 ± 0.1 | 7.4 ± 1.2 | ≤ 0.5 | Yes |
| Pb (µg/L) | ND | 42.3 ± 7.1 | ≤ 10 | Yes |
| Cd (µg/L) | ND | 18.6 ± 3.4 | ≤ 3 | Yes |
| Cr (µg/L) | 3.1 ± 0.8 | 14.7 ± 2.9 | ≤ 50 | No |
| Zn (µg/L) | 12.4 ± 3.2 | 67.8 ± 9.3 | ≤ 100 | No |
Table text extracted from the original PDF; superscript letters are shown inline. The original table image is below.
View original table image
Phase II enzymes GPx and GST, by contrast, showed induction, suggesting an adaptive response to chronic lowlevel oxidative exposure. The scatter plot (Figure 1) reveals a significant negative correlation between SOD and MDA across both sites combined (r = -0.74, p < 0.001), confirming that as lipid peroxidation increased, enzymatic antioxidant defence became progressively depleted. Separation of the two siteclusters is pronounced, with virtually no overlap between control and runoff populations, indicating the biological response was consistent across all 40 fish per site.
Comprehensive interpretation
The convergence of elevated water contaminant levels, significantly raised MDA, suppressed primary antioxidants, and induced Phase II enzymes in runoff-site C. gariepinus provides strong multivariate evidence that agricultural runoff from the Ogun River tributary is generating measurable and biologically significant oxidative stress in this fish population. The Pb and Cd concentrations detected at the runoff site (42.3 and 18.6 µg/L, respectively both exceeding FEPA limits) are particularly concerning because both metals are known to generate ROS directly through Fenton-type chemistry and to inhibit SOD and CAT by displacing essential metal cofactors. The nutrient enrichment (nitrate 38.7 mg/L, phosphate 7.4 mg/L) likely contributes to DO depletion through algal bloom decomposition, compounding oxidative pressure through hypoxia-reoxygenation cycles.
Discussion
The 2.51-fold elevation in liver MDA in runoff-site C. gariepinus is consistent with findings from comparable agricultural runoff investigations in West African river systems. Oso et al. [8] reported MDA increases of 1.8-2.3fold in Oreochromis niloticus from organophosphatecontaminated ponds in southwest Nigeria, and Nwani et al. [9] documented 2.1-fold MDA elevation in catfish from pesticide-treated fishing ponds. The higher ratio recorded in the present research (2.51-fold) likely reflects the compound contamination at the runoff site, where heavy metals were detected alongside pesticide residues-a combination known to produce additive or synergistic pro-oxidant effects [3] . Mechanistically, Pb and Cd interfere directly with the active sites of SOD and CAT by displacing Cu/Zn and Fe/Mn cofactors respectively, explaining why primary antioxidant enzymes were depressed rather than induced despite ROS overproduction. The induction of GPx and GST at the runoff site is a common adaptive response observed in fish experiencing chronic but sub-lethal pollution loads and may represent a protective Phase II detoxification upregulation rather than a biomarker of irreversible injury [10] . In practical terms, the elevation of GST in the runoff fish (1.88× relative to control) may partially buffer against pesticide-induced ROS by conjugating electrophilic metabolites of organochlorines and pyrethroids with glutathione. But this adaptive capacity has limits; the concurrent MDA elevation confirms that the protective enzymatic response is insufficient to prevent net lipid peroxidation in the runoff-site population. A finding that merits further investigation is the significant pH depression at the runoff site (6.4 vs 7.2 at controls). Acid stress independently depresses fish antioxidant enzyme activities and elevates MDA, creating a potential confound in attributing oxidative stress solely to pesticide and heavy metal exposure [11] . Nonetheless, even after accounting for pH effects, the magnitude of the biomarker differences between sites-particularly for SOD and MDA exceeds what acid stress alone would produce in field concentrations, supporting the interpretation that multipollutant agricultural runoff is the primary driver. The implication for fisheries management is that the current farming practices within 10-25 m of the Ogun River tributaries are causing chronic sub-lethal harm to commercially important fish populations that, if sustained, could impair reproductive success and long-term stock viability [12] .
Conclusion
The context for this research is the documented expansion of peri-urban agriculture in the Lagos catchment and the absence of quantitative biological monitoring data on oxidative stress endpoints in commercially important freshwater fish from polluted Nigerian tributaries. Against this backdrop, the research demonstrates unequivocally that Clarias gariepinus in the agricultural runoff-affected Ogun River tributary displays significantly elevated lipid peroxidation (MDA: 2.51×), depressed primary antioxidant enzymes (SOD: 0.30×; CAT: 0.49×), and induced Phase II detoxification enzymes (GPx: 1.83×; GST: 1.88×) compared with fish from a clean reference site.
The key finding highlights are: (i) a strong inverse correlation between SOD and MDA (r = -0.74) confirms oxidative stress as the mechanistic link between contamination and biological damage; (ii) water quality data show exceedance of FEPA limits for DO, nitrate, phosphate, Pb, and Cd at the runoff site; and (iii) both heavy metals and excess nutrients appear to contribute jointly to the oxidative burden observed in the fish tissue. These results are the first systematic multi-biomarker oxidative stress dataset for C. gariepinus from a Nigerian agricultural runoff scenario, filling a meaningful data gap in West African ecotoxicology literature. The recommendation from these findings is twofold: first, FEPA and Lagos State environmental authorities should enforce mandatory 30-metre no-cultivation buffer zones along the affected river reaches to reduce agrochemical loading; second, regular biomonitoring programmes using the biomarker panel described here (MDA, SOD, CAT, GPx, GST) should be established at quarterly intervals to track temporal changes in fish health and evaluate the effectiveness of any mitigation measures implemented. Future research should extend the panel to include genotoxicity markers (micronucleus test, comet assay), histopathological examination of gill and liver tissue, and bioaccumulation analysis of Pb and Cd in muscle to assess food safety implications for human consumers of C. gariepinus from these waters.
Acknowledgement
Acknowledgements Funding SourcesThis research received general research support from the Tertiary Education Trust Fund (TETFund) of Nigeria through institutional-based research funding allocated to the Lagos Institute of Aquatic and Environmental Sciences.
Figures and tables from the paper
References
13 in the original paper- Ofodile SE, Agbasi JC, Obi IU, et al. Assessment of water quality parameters of some rivers in southwest Nigeria for aquaculture suitability. Afr J Aquat Sci. 2023;48(1):42-54.
- Tilman D, Fargione J, Wolff B, et al. Forecasting agriculturally driven global environmental change. Science. 2001;292(5515):281-284.
- Regoli F, Giuliani ME. Oxidative pathways of chemical toxicity and oxidative stress biomarkers in marine organisms. Mar Environ Res. 2014;93:106-117.
- Lagos State Environmental Protection Agency. State of the Environment Report 2022: Water Resources. Lagos: Lagos State Environmental Protection Agency; 2022.
- Ayoola SO, Apalowo OA. Histopathological changes in tissues of Clarias gariepinus treated with plant extracts. J Fish Aquat Sci. 2010;5(2):124-133.
- Nwani CD, Ibemenuga KN, Echi PC, et al. Oxidative stress and antioxidant responses in Clarias gariepinus chronically exposed to a sublethal concentration of paraquat. Pak J Biol Sci. 2013;16(23):1746-1752.
- Oso JA, Adedokun IS, Fagbuaro O. Oxidative damage markers in Oreochromis niloticus from agricultural water bodies in southwest Nigeria. Environ Sci Pollut Res. 2022;29(4):5521-5534.
- Nwani CD, Agbugah EA, Odo GE, et al. Effects of agricultural effluents on oxidative stress in freshwater catfish: a biochemical investigation. West Afr J Aquat Sci. 2021;18(3):88-98.
- van der Oost R, Beyer J, Vermeulen NPE. Fish bioaccumulation and biomarkers in environmental risk assessment: a review. Environ Toxicol Pharmacol. 2003;13(2):57-149.
- Lushchak VI. Environmentally induced oxidative stress in aquatic animals. Aquat Toxicol. 2011;101(1):13-30.
- Ogamba EN, Ebere N, Izonfuo WAL. Water quality, biochemical and haematological indices of catfish from impacted and control freshwater bodies in Nigeria. J Pharm Biomed Sci. 2015;5(4):313-320.
- Mason CF. Biology of Freshwater Pollution. 4th ed. Harlow: Prentice Hall; 2002.
- Pandey S, Parvez S, Sayeed I, et al. Biomarkers of oxidative stress: a comparative study of river Yamuna fish Wallago attu (Bl. & Schn.). Sci Total Environ. 2003;309(1-3):105-115.