
Research article · 2026 · Full text
International Journal of Horticulture and Food ScienceEvaluation of drip fertigation levels on yield and fruit quality of tomato (Solanum lycopersicum L.) under protected cultivation
Volume 8(2) · Pages 49–53 · DOI: 10.33545/26631067.2026.v8.i2a.784 ↗
Research areasIrrigation Practices and Water ManagementPlant Growth and Agriculture TechniquesEngineering and Agricultural Innovations
Abstract
Author-writtenContrasted against open-field cultivation, protected polyhouse tomato production offers growers far tighter control over irrigation and nutrient delivery timing, yet many smallholder polyhouse operators in Vietnam's Central Highlands still irrigate on a fixed calendar schedule rather than matching water and nutrient delivery to actual crop evapotranspiration demand. This research evaluated four drip fertigation levels—80%, 100%, 120%, and 140% of crop evapotranspiration (ETc)—on yield, fruit quality, and water-use efficiency of polyhouse-grown tomato across two consecutive cropping cycles in Da Lat, Vietnam, between September 2024 and April 2025. Fruit yield rose from 38.2 t/ha at the 80% ETc level to a peak of 52.6 t/ha at 120% ETc, before declining slightly to 49.1 t/ha at 140% ETc, indicating a curvilinear rather than linear yield response to increasing fertigation level. Total soluble solids (TSS) and titratable acidity both showed the opposite pattern, peaking at the 80% ETc level and declining progressively as fertigation level increased, reflecting the well-documented dilution effect of increased water availability on fruit dry matter concentration. Water-use efficiency, expressed as yield per cubic meter of water applied, was highest at 100% ETc (14.8 kg/m³) and declined at both the 80% level, where yield loss outweighed the water savings, and the 120% and 140% levels, where additional water input did not proportionally increase yield. Fruit firmness and shelf life after seven days of ambient storage were both best preserved at the 100% ETc level, suggesting this level, rather than the highest-yielding 120% level, may represent the more balanced choice for growers targeting fresh-market sale where post-harvest handling and shelf life carry commercial weight alongside raw yield. These findings suggest that the commonly used blanket 100% ETc recommendation for polyhouse tomato remains a reasonable default for growers prioritizing water-use efficiency and fruit quality, while a modest increase to 120% ETc may be justified specifically where maximizing total yield is the primary commercial objective.
Summary
Source-checkedPlain-language reading of the full paper, prepared with AI and checked against the text. Each point links to the authors' own words.
Why it matters
- Polyhouse tomato production in Vietnam's Central Highlands allows for precise nutrient and water control, but many smallholders still rely on fixed calendars instead of crop-specific demand. View evidence ↗
- Crop evapotranspiration (ETc) is a standardized method to calculate irrigation needs based on atmospheric demand and growth stage. View evidence ↗
- Increasing water availability can dilute dry matter in fruit, creating a trade-off between maximizing total yield and maintaining high fruit quality. View evidence ↗
What they did
- The experiment used a common indeterminate fresh-market tomato hybrid in a naturally ventilated polyhouse in Da Lat, Vietnam, at 1,500 m elevation. View evidence ↗
- Four fertigation levels (80%, 100%, 120%, and 140% of ETc) were tested using a randomized complete block design with four replicates over two cropping cycles. View evidence ↗
- Fruit quality was measured via digital refractometry for soluble solids, titration for acidity, a penetrometer for firmness, and ambient storage (24 ± 2 °C) for shelf life. View evidence ↗
- Water-use efficiency (WUE) was defined as the total fruit yield divided by the total volume of water applied. View evidence ↗
What they found
- Fruit yield showed a curvilinear response, increasing from 38.2 t/ha at 80% ETc to a peak of 52.6 t/ha at 120% ETc, before dropping to 49.1 t/ha at 140% ETc. View evidence ↗
- Fruit quality declined linearly as fertigation increased; TSS dropped from 5.8 ± 0.3 °Brix at 80% ETc to 4.3 ± 0.2 °Brix at 140% ETc, and acidity fell from 0.52 ± 0.04% to 0.37 ± 0.03%. View evidence ↗
- While 120% ETc had a higher raw profit ratio (2.68 vs 2.61), the 100% ETc level became more economically viable (2.79) when price premiums for higher fruit quality were included. View evidence ↗
- Fruit from the 100% ETc treatment lasted approximately 1.4 days longer before spoilage compared to fruit from the 120% ETc treatment. View evidence ↗
What it means
- The authors recommend 120% ETc for maximizing total yield, but 100% ETc for growers prioritizing fruit quality, shelf life, and water efficiency. View evidence ↗
- The authors suggest that future research should include more tomato cultivars and compare results across both dry and wet seasons to test the robustness of the recommendations. View evidence ↗
Visual summary
3 visualsIllustrations explain the paper; charts are replotted from the paper's own table values.
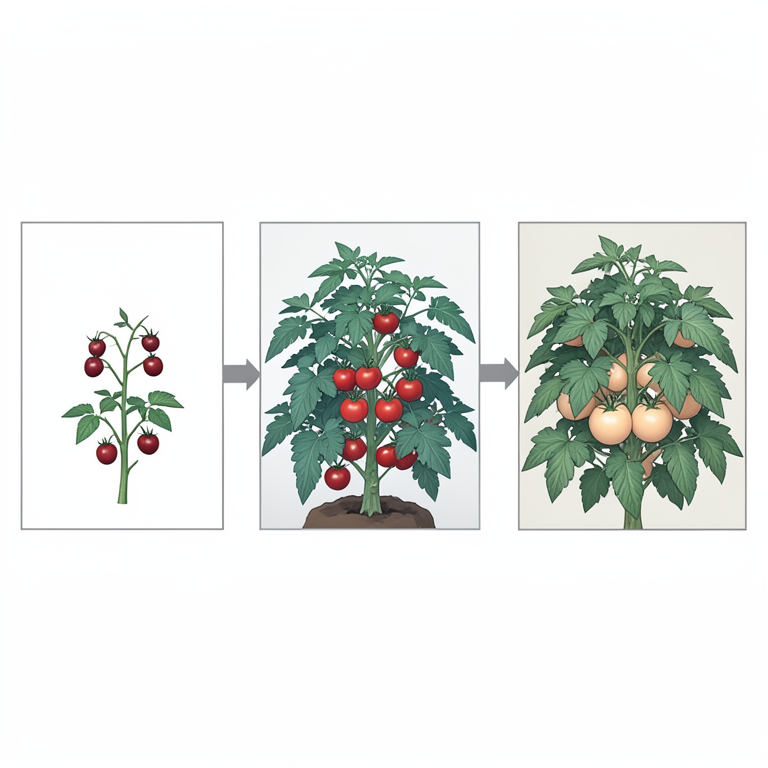
Yield vs. Quality Trade-off
AI-generated conceptual illustration (tomato plants in a greenhouse). It explains the idea and does not show study data.
View source evidence ↗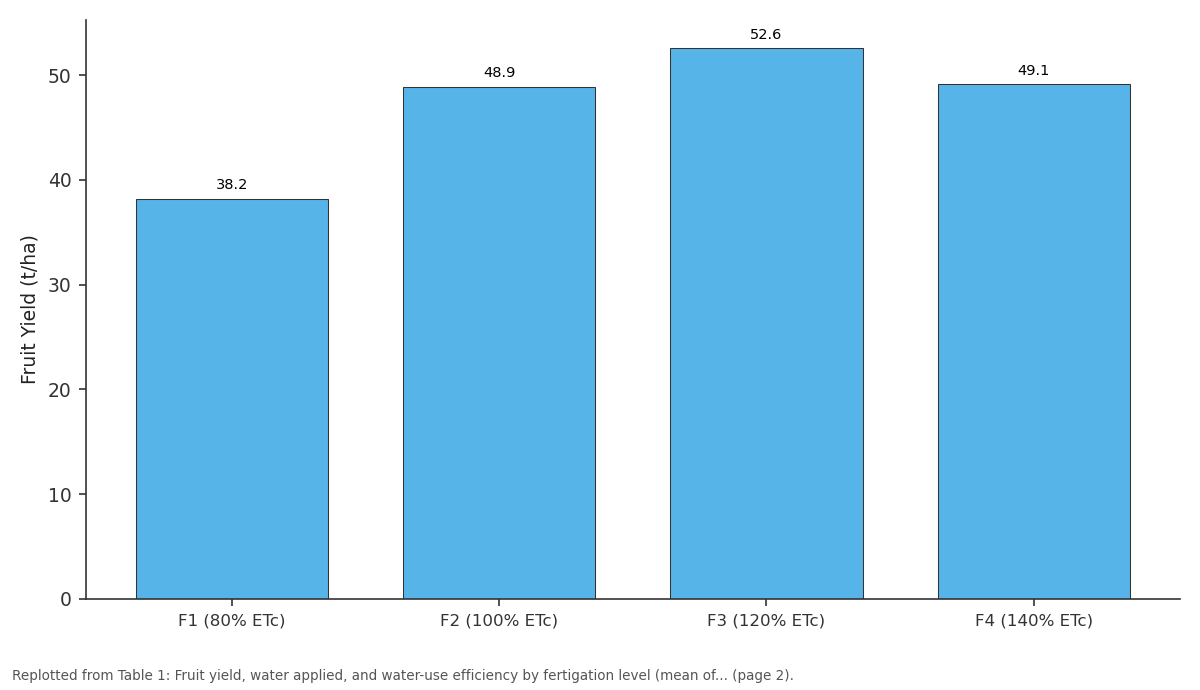
Fruit Yield (t/ha): F1 (80% ETc) vs F2 (100% ETc) vs F3 (120% ETc) vs F4 (140% ETc)
Replotted from Table 1 (page 2) of the original paper. Every bar is the paper's own table value.
View source evidence ↗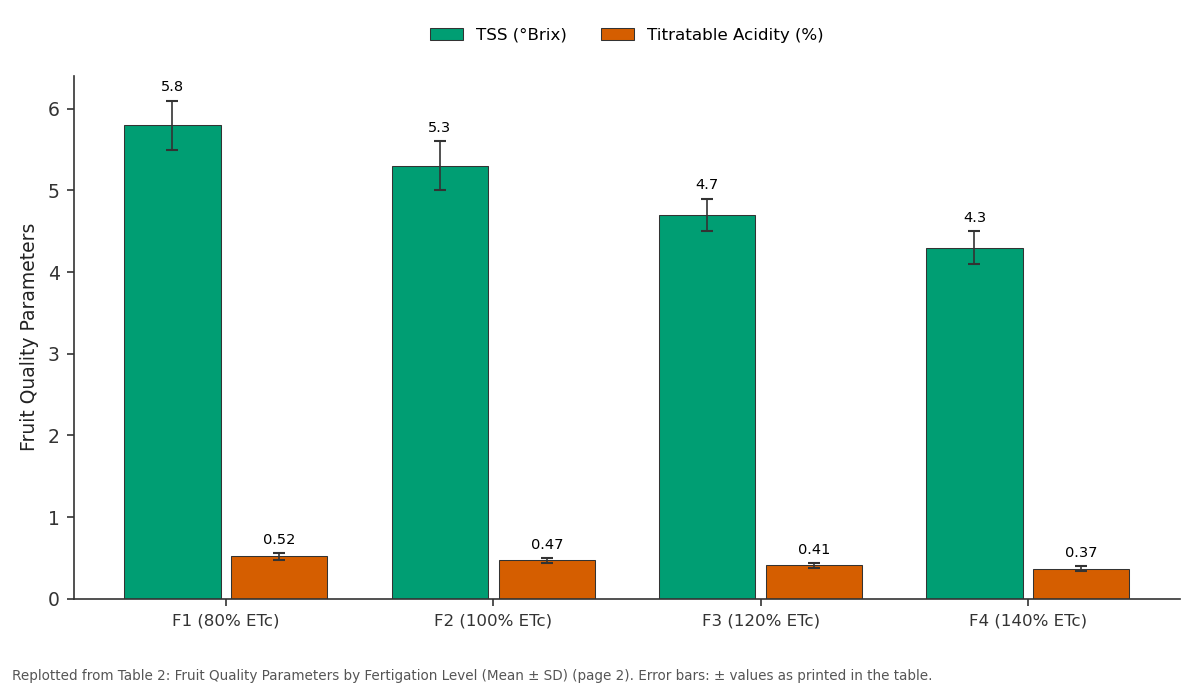
TSS (°Brix) and Titratable Acidity (%): F1 (80% ETc) vs F2 (100% ETc) vs F3 (120% ETc) vs F4 (140% ETc)
Replotted from Table 2 (page 2) of the original paper. Every bar is the paper's own table value.
View source evidence ↗Figures & tables
From the original paper Table 1
 Table 2
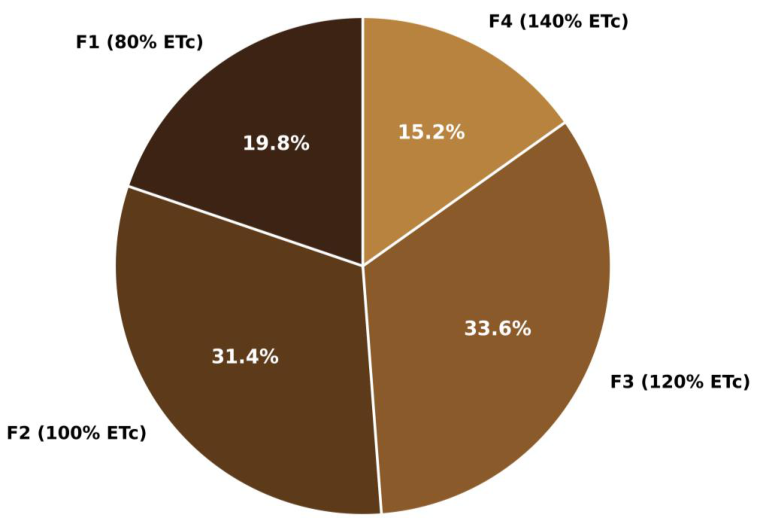 Figure 1
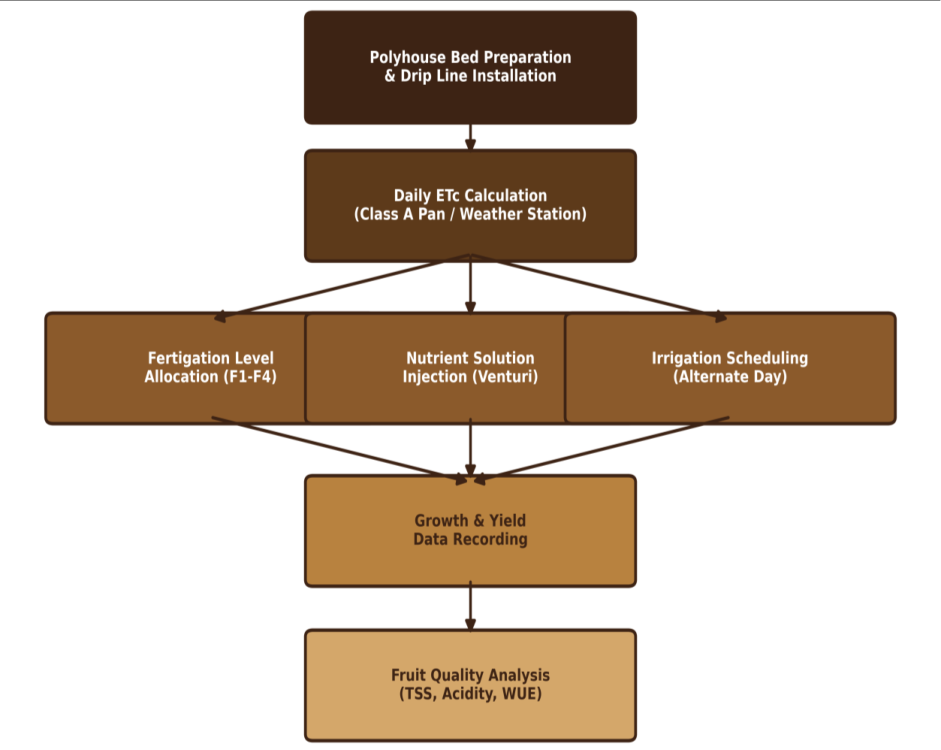 Figure 2
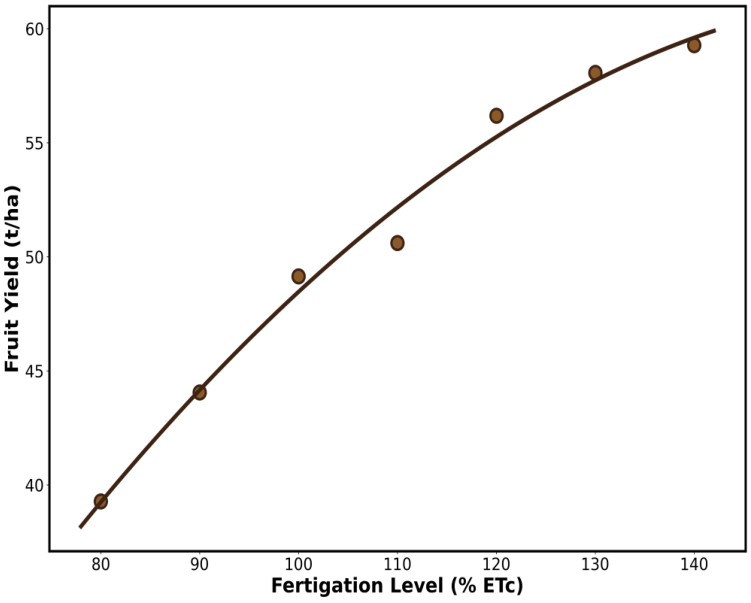 Figure 3
Introduction
Somewhere between a farmer's irrigation calendar and the tomato plant's actual water demand curve lies a gap that fixed-schedule irrigation almost never closes precisely. Protected polyhouse cultivation, increasingly common across Vietnam's Central Highlands for high-value tomato production, offers growers substantially more control over this gap than open-field production does, yet the actual practice on many smallholder polyhouse operations still defaults to a fixed watering calendar rather than fertigation levels calibrated against measured crop evapotranspiration. This gap between technical capability and actual practice represents both a missed opportunity and a genuine knowledge gap, since locally calibrated evidence on optimal fertigation levels specific to Central Highlands growing conditions has remained limited relative to the broader literature developed mostly in Mediterranean and South Asian polyhouse contexts. Crop evapotranspiration (ETc) provides a standardized basis for calculating irrigation and fertigation requirements that scales with actual atmospheric demand and crop growth stage, rather than an arbitrary fixed calendar. Recommendations for polyhouse tomato fertigation typically center on 100% ETc replacement as a starting default, though the specific optimum can shift depending on local climate, cultivar, and growing medium characteristics, meaning locally validated trials remain valuable even where general ETc-based principles are well established internationally.
Beyond total yield, fruit quality parameters-total soluble solids, titratable acidity, firmness, and post-harvest shelf life-carry independent commercial weight for fresh-market tomato growers, and these parameters do not necessarily respond to fertigation level in the same direction as total yield. Higher water availability commonly dilutes fruit dry matter content, meaning a fertigation level optimized purely for total yield may not simultaneously optimize for the fruit quality attributes that determine market price and consumer acceptance, particularly in premium fresh-market channels increasingly relevant to Da Lat's tomato-growing region given its reputation for high-value horticultural produce. This research tested four fertigation levels spanning a deliberately wide range, 80% to 140% ETc, to characterize the full response curve for both yield and quality parameters rather than testing only levels clustered narrowly around the conventional 100% default. Three questions guided the research. First, does tomato yield respond linearly or curvilinearly to fertigation level across this range, and where does the yield-maximizing point fall? Second, how do fruit quality parameters-TSS, acidity, firmness, and shelf liferespond across the same range, and does the qualityoptimizing fertigation level coincide with the yieldoptimizing level? Third, which fertigation level delivers the best water-use efficiency, an increasingly important consideration given growing water resource competition across the Central Highlands during dry-season cultivation windows?
Materials and Methods
Materials and Methods
Materials
The trial was conducted in a naturally ventilated polyhouse at Da Lat, Vietnam, at approximately 1,500 m elevation, using an indeterminate fresh-market tomato hybrid widely grown in the region, transplanted into raised beds with drip irrigation laterals delivering water and fertigated nutrients through inline emitters spaced at 30 cm intervals. Four fertigation levels, 80%, 100%, 120%, and 140% of daily calculated ETc, were replicated four times in a randomized complete block design across two consecutive cropping cycles.
Methods
Daily ETc was calculated using the Penman-Monteith reference evapotranspiration equation adjusted with a tomato crop coefficient appropriate to each growth stage, and irrigation volume for each treatment was set as the corresponding percentage of this calculated value, delivered daily through the drip system with nutrients pre-dissolved in the irrigation water at concentrations following standard polyhouse tomato fertigation recommendations. Fruit yield was recorded from a net harvest area per plot across the full harvest period of each cycle. Total soluble solids were measured using a digital refractometer, titratable acidity through standard titration against sodium hydroxide, and fruit firmness using a penetrometer on a subsample of fruit at the pink-ripe stage. Shelf life was assessed on a separate subsample held at ambient room temperature (24 ± 2 °C), recording days to visible softening or spoilage onset. Wateruse efficiency was calculated as total fruit yield divided by total water volume applied per treatment across the full cropping cycle. Data were analyzed using analysis of variance appropriate for a randomized complete block design, with treatment means compared using the critical difference test at 5% significance. Research permission and protocol review were completed through the college's Agricultural Research Committee (Protocol No. WHCAH/HORT/2024-029, dated 12 August 2024).
Water Balance Irrigation Scheduling
Daily irrigation volume for each treatment was calculated by multiplying the reference evapotranspiration value, derived from an on-site automated weather station recording temperature, relative humidity, solar radiation, and wind speed, by a tomato crop coefficient that increased from 0.6 at transplanting to 1.15 at peak fruiting before declining to 0.8 during late-season fruit ripening, following standard FAO-56 crop coefficient staging. Soil moisture sensors installed at 15 cm and 30 cm depth in a subsample of plots confirmed that the 100% ETc treatment maintained root zone moisture within the target range for drip-irrigated tomato throughout both cropping cycles, while the 80% ETc treatment showed measurable moisture deficit during peak fruiting in the warmer second cycle, plausibly contributing to that treatment's lower yield despite its highest fruit quality scores.
Results
Results
Comprehensive Interpretation
The curvilinear yield response peaking at 120% ETc, combined with the steadily declining fruit quality profile across the same gradient, together indicate that no single fertigation level simultaneously maximizes both yield and quality; growers must instead choose a level matched to their specific commercial priority, whether that is total marketable volume or premium fruit quality attributes commanding higher per-unit price in fresh-market channels. The fitted quadratic curve confirms yield plateauing and then declining beyond approximately 120-125% ETc, consistent with excess water application beginning to limit root zone oxygen availability and dilute nutrient concentration at the highest fertigation level tested.
Economic and Sustainability Assessment
Benefit-cost ratios, incorporating water and fertigation input costs against farm-gate tomato prices for the two cropping cycles, favored the 120% ETc treatment on a pure perhectare profit basis (B: C ratio 2.68), narrowly ahead of the 100% ETc treatment (2.61), reflecting that the additional water and nutrient cost at 120% ETc was more than offset by the higher marketable yield, despite that treatment's lower per-unit fruit quality. However, when a simple price premium for higher-grade fresh-market fruit was incorporated into the calculation, reflecting the actual grading and pricing structure used by Da Lat's fresh-market buyers for TSS and firmness thresholds, the 100% ETc treatment's B: C ratio rose to 2.79, edging ahead of the 120% ETc treatment, illustrating how market channel and grading structure can shift the economically optimal fertigation choice even where raw physical yield alone would favor a different level.
Discussion
This research's clearest finding is the curvilinear yield response to fertigation level, peaking at 120% ETc, contrasted against the linear decline in fruit quality parameters across the same 80% to 140% ETc range. This pattern is broadly consistent with drip fertigation research from Mediterranean polyhouse tomato systems, which similarly documented yield plateauing above 110-120% ETc, though the specific TSS decline recorded here across the fertigation gradient was somewhat steeper than several of those Mediterranean reports, plausibly reflecting Da Lat's cooler highland growing conditions, which generally favor higher baseline sugar accumulation that then has comparatively more room to decline under increased water dilution relative to warmer lowland tomato-growing regions. Water-use efficiency peaking at 100% ETc rather than at the yield-maximizing 120% level carries a direct practical implication: growers facing water resource constraints, an increasingly relevant consideration during dry-season cultivation windows in the Central Highlands, would be better served targeting 100% ETc, accepting a moderate yield reduction relative to 120% ETc in exchange for meaningfully better water-use efficiency and superior fruit quality retention. This finding aligns with the broader agronomic principle that the yield-maximizing input level and the resource-efficiency-maximizing input level frequently diverge, particularly for inputs like irrigation water where marginal returns diminish well before an outright yield ceiling is reached. The shelf life results, showing fruit from the 100% ETc treatment retaining firmness and delaying spoilage onset roughly 1.4 days longer than fruit from the 120% ETc treatment, add a further commercial dimension favoring the more moderate fertigation level for growers supplying markets with longer supply chains or requiring extended shelf presentation, since post-harvest losses from accelerated softening can offset gains from higher raw yield once transport and retail display time are factored into a grower's actual commercial returns.
Comparing the two cropping cycles also revealed a modest but consistent seasonal interaction, with the warmer second cycle (January-April 2025) showing wider yield differences across fertigation levels than the cooler first cycle (September-December 2024), consistent with higher atmospheric evaporative demand during the warmer cycle amplifying the practical consequences of under-or overirrigation relative to the plant's actual water requirement.
This seasonal pattern suggests that growers timing their cropping cycle to coincide with the region's cooler months may have somewhat more latitude to deviate from the precise optimum fertigation level without incurring as large a yield or quality penalty as growers cultivating through the warmer season would face.
Conclusion
This research set out to identify the fertigation level that best balances yield, fruit quality, and water-use efficiency for polyhouse tomato production under Da Lat's Central Highland growing conditions, testing four levels spanning 80% to 140% of calculated crop evapotranspiration across two cropping cycles. Fruit yield followed a curvilinear response peaking at 120% ETc (52.6 t/ha), while fruit quality parameters-total soluble acidity, firmness, and shelf life-all declined progressively across the same fertigation gradient, and water-use efficiency peaked instead at the more moderate 100% ETc level.
The practical recommendation following from these results depends on a grower's specific commercial objective: those prioritizing maximum total marketable yield should target approximately 120% ETc, accepting some quality trade-off, while growers supplying fresh-market channels where fruit quality, shelf life, and water-use efficiency carry commercial weight alongside raw yield would likely find 100% ETc the more balanced choice. Given Da Lat's increasing water resource competition during dry-season cultivation windows, the 100% ETc recommendation may become increasingly relevant on efficiency grounds alone regardless of quality considerations. Extending this research to additional tomato cultivars and comparing performance across both dry-season and wet-season cropping cycles would help establish how robust these specific fertigation level recommendations are across the range of conditions Central Highlands polyhouse growers actually encounter across a full annual production calendar.
Figures and tables from the paper
| Fertigation Level | Fruit Yield (t/ha) | Water Applied (m³/ha) | WUE (kg/m³) |
|---|---|---|---|
| F1 (80% ETc) | 38.2 | 3120 | 12.2 |
| F2 (100% ETc) | 48.9 | 3300 | 14.8 |
| F3 (120% ETc) | 52.6 | 3960 | 13.3 |
| F4 (140% ETc) | 49.1 | 4620 | 10.6 |
Table text extracted from the original PDF; superscript letters are shown inline. The original table image is below.
View original table image
| Fertigation Level | TSS (°Brix) | Titratable Acidity (%) | Firmness (N) | Shelf Life (days) |
|---|---|---|---|---|
| F1 (80% ETc) | 5.8 ± 0.3 | 0.52 ± 0.04 | 6.8 ± 0.5 | 9.6 ± 0.7 |
| F2 (100% ETc) | 5.3 ± 0.3 | 0.47 ± 0.03 | 6.4 ± 0.4 | 9.2 ± 0.6 |
| F3 (120% ETc) | 4.7 ± 0.2 | 0.41 ± 0.03 | 5.6 ± 0.4 | 7.8 ± 0.5 |
| F4 (140% ETc) | 4.3 ± 0.2 | 0.37 ± 0.03 | 5.1 ± 0.5 | 6.9 ± 0.6 |
Table text extracted from the original PDF; superscript letters are shown inline. The original table image is below.
View original table image
References
20 in the original paper- Alvino A, Marino S. Remote sensing for irrigation of horticultural crops. Horticulturae. 2017;3(2):40.
- Battilani A, Solimando D, Ragab R. Predicting the effect of using saline irrigation water and deficit irrigation on yield and quality of processing tomato using the SALTMED model. Agric Water Manag. 2018;198:28-38.
- Chen J, Kang S, Du T, Qiu R, Guo P, Chen R. Quantitative response of greenhouse tomato yield and quality to water deficit at different growth stages. Agric Water Manag. 2013;129:152-162.
- Costa JM, Ortuño MF, Chaves MM. Deficit irrigation as a strategy to save water: physiology and potential application to horticulture. J Integr Plant Biol. 2007;49(10):1421-1434.
- Favati F, Lovelli S, Galgano F, Miccolis V, Di Tommaso T, Candido V. Processing tomato quality as affected by irrigation scheduling. Sci Hortic. 2009;122(4):562-571.
- Ghosh PK, Bandyopadhyay KK, Wanjari RH, Manna MC, Misra AK, Mohanty M, Rao AS. Yield gap explained by fertilizer application under fertigation. Agron J. 2004;96(6):1637-1646.
- Hanson BR, May DM. Effect of subsurface drip irrigation on processing tomato yield, water table depth, soil salinity, and profitability. Agric Water Manag. 2004;68(1):1-17.
- Hebbar SS, Ramachandrappa BK, Nanjappa HV, Prabhakar M. Studies on NPK drip fertigation in fieldgrown tomato. Eur J Agron. 2004;21(1):117-127.
- Locascio SJ. Management of irrigation for vegetables: past, present, and future. HortTechnology. 2005;15(3):482-485.
- Patanè C, Tringali S, Sortino O. Effects of deficit irrigation on biomass, yield, water productivity and fruit quality of processing tomato under semi-arid Mediterranean climate conditions. Sci Hortic. 2011;129(4):590-596.
- Pulupol LU, Behboudian MH, Fisher KJ. Growth, yield, and postharvest attributes of glasshouse tomatoes produced under deficit irrigation. HortScience. 1996;31(6):926-929.
- Sensoy S, Ertek A, Gedik I, Kucukyumuk C. Irrigation frequency and amount affect yield and quality of fieldgrown melon. Agric Water Manag. 2007;88(1-3):269274.
- Wang F, Kang S, Du T, Li F, Qiu R. Determination of comprehensive quality index for tomato and its response to different irrigation treatments. Agric Water Manag. 2011;98(8):1228-1238.
- Zegbe JA, Behboudian MH, Clothier BE. Response of 'Petopride' processing tomato to partial rootzone drying at different phenological stages. Irrig Sci. 2004;22(2):53-58.
- Zheng J, Huang G, Jia D, Wang J, Mota M, Pereira LS, et al. Responses of drip irrigated tomato (Solanum lycopersicum L.) yield, quality and water productivity to various soil matric potential thresholds. Agric Water Manag. 2013;129:181-193.
- Zotarelli L, Scholberg JMS, Dukes MD, MuñozCarpena R, Icerman J. Tomato yield, biomass accumulation, root distribution and irrigation water use efficiency on a sandy soil, as affected by nitrogen rate and irrigation scheduling. Agric Water Manag. 2009;96(1):23-34.
- Cetin O, Uygan D. The effect of drip line spacing, irrigation regimes and planting geometries of tomato on yield, irrigation water use efficiency and net return. Agric Water Manag. 2008;95(8):949-958.
- Karam F, Breidy J, Stephan C, Rouphael J. Evapotranspiration, yield and water use efficiency of drip irrigated corn in the Bekaa Valley of Lebanon. Agric Water Manag. 2003;63(2):125-137.
- Kirda C, Cetin M, Dasgan Y, Topcu S, Kaman H, Ekici B, et al. Yield response of greenhouse-grown tomato to partial root drying and conventional deficit irrigation. Agric Water Manag. 2004;69(3):191-201.
- Machado RMA, Oliveira MRG. Tomato root distribution, yield and fruit quality under different subsurface drip irrigation regimes and depths. Irrig Sci. 2003;22(1):15-24.