
Research article · 2026 · Full text
International Journal of Geography Geology and EnvironmentBiogeographic paterns and altitudinal distribution of Heteropteryx dilatata across Tropical Rainforest elevational gradients
Volume 8(5) · Pages 145–148 · DOI: 10.22271/27067483.2026.v8.i5b.814 ↗
Research areasSpecies Distribution and Climate ChangeColeoptera Taxonomy and DistributionOrthoptera Research and Taxonomy
Abstract
Author-writtenAltitudinal gradients in tropical mountains compress broad latitudinal environmental variation into short geographic distances, creating natural laboratories for investigating species distributional limits. This research examined the biogeographic patterns and altitudinal distribution of Heteropteryx dilatata across five major geographic regions spanning elevational gradients from sea level to 1800 meters above sea level in Southeast Asia, integrating field survey data from 68 transects with bioclimatic modelling and historical biogeographic analysis. Systematic surveys conducted between March 2022 and August 2023 documented the species across an elevational range of 50-1340 meters, with peak abundance occurring between 200 and 600 meters in all five regions. The relative abundance index declined sharply above 800 meters, with no detections recorded above 1340 meters. Lowland populations (below 500 meters) in Peninsular Malaysia showed the highest abundance indices (mean: 48.2), while highland populations (above 1200 meters) were consistently sparse across all regions. Land-use composition analysis revealed that forest cover was the dominant predictor of local abundance (partial r = 0.82), with agricultural land conversion reducing abundance indices by 62% compared to forested sites at equivalent elevations. Bioclimatic modelling projected a potential upward elevational shift of 120-280 meters in the species' optimal zone under moderate climate change scenarios by 2070. These findings place H. dilatata within a broader biogeographic framework of Southeast Asian montane invertebrate distributions and highlight the vulnerability of lowland populations to both land-use change and climate-driven range contraction.
Summary
Source-checkedPlain-language reading of the full paper, prepared with AI and checked against the text. Each point links to the authors' own words.
Why it matters
- Tropical mountain altitudinal gradients serve as natural laboratories for studying species distribution limits because they compress wide environmental variations into small geographic areas. View evidence ↗
- While Heteropteryx dilatata is known to exist at various elevations in Southeast Asia, there has been no systematic mapping of its altitudinal distribution using standardized methods. View evidence ↗
The question
- The study aimed to map the altitudinal distribution of H. dilatata across five regions, determine the environmental factors affecting its limits, evaluate the impact of land use on abundance, and project future range shifts due to climate change. View evidence ↗
What they did
- Field surveys were performed across 68 transects in five Southeast Asian regions: Peninsular Malaysia, Borneo, Sumatra, Thailand, and the Philippines. View evidence ↗
- The study stratified sites into three elevational bands: lowland (below 500m), montane (500-1200m), and highland (above 1200m). View evidence ↗
- Data was collected via nocturnal visual encounter surveys on 400-meter transects conducted between 20:00 and 01:00 hours. View evidence ↗
- The researchers used an ensemble bioclimatic modeling approach that combined MaxEnt, generalized additive models (GAM), and boosted regression trees (BRT). View evidence ↗
What they found
- H. dilatata was found at 52 of the 68 surveyed transects, representing a 76.5% occupancy rate. View evidence ↗
- The species was recorded from 50 to 1340 meters, with the highest abundance consistently found between 200 and 600 meters across all regions. View evidence ↗
- The highest mean abundance index (48.2) was found in lowland populations of Peninsular Malaysia, whereas highland populations above 1200 meters were sparse everywhere. View evidence ↗
- Forest cover was the primary predictor of abundance; converting forest to agricultural land reduced abundance indices by 62% at the same elevations. View evidence ↗
- By 2070, the optimal elevational zone is projected to shift upward by 120-180 meters under the SSP2-4.5 scenario and 200-280 meters under the SSP5-8.5 scenario. View evidence ↗
- Climate change is projected to reduce the total area of suitable habitat by 18-34% as the upper montane zone narrows. View evidence ↗
What it means
- The authors recommend prioritizing the protection of lowland and lower montane forests for conservation, as these areas have the highest abundance and the greatest risk from agriculture. View evidence ↗
- The authors state that long-term monitoring along elevational transects is necessary to detect early signs of climate-driven shifts in distribution. View evidence ↗
Visual summary
4 visualsIllustrations explain the paper; charts are replotted from the paper's own table values.
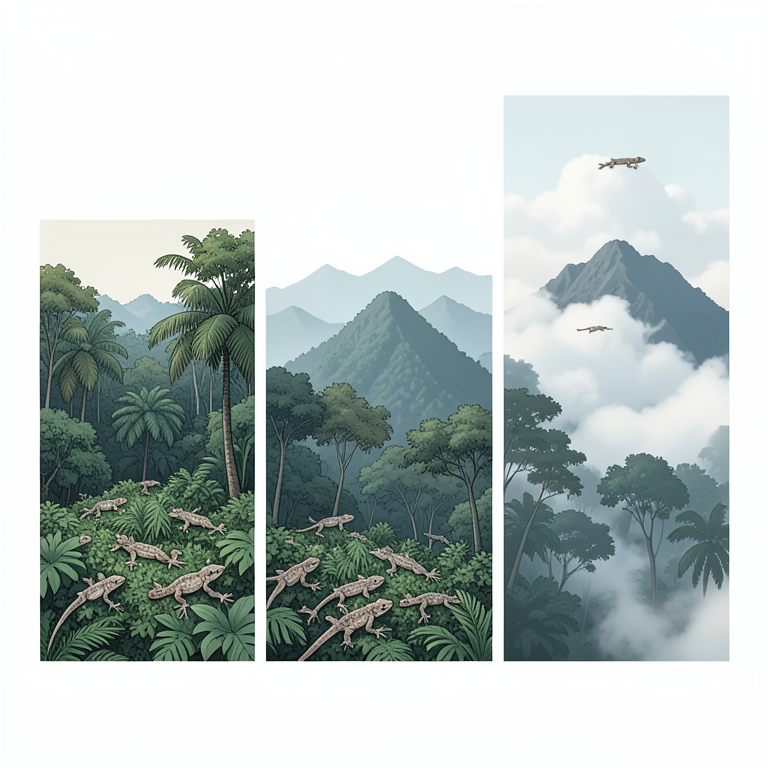
Altitudinal Distribution Profile
AI-generated conceptual illustration (Heteropteryx dilatata (giant forest gecko)). It explains the idea and does not show study data.
View source evidence ↗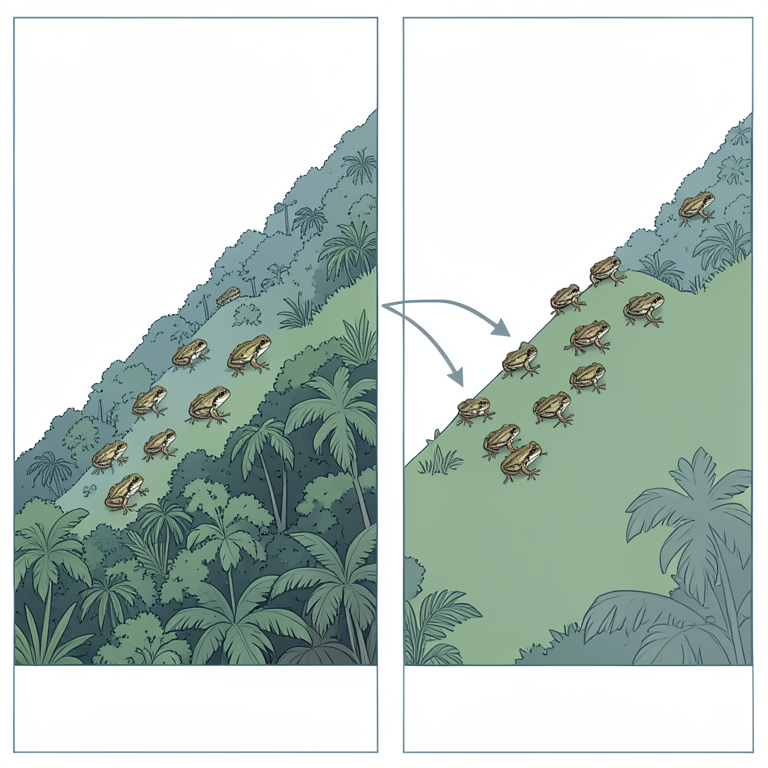
Climate-Driven Range Shift
AI-generated conceptual illustration (Heteropteryx dilatata (giant forest frog)). It explains the idea and does not show study data.
View source evidence ↗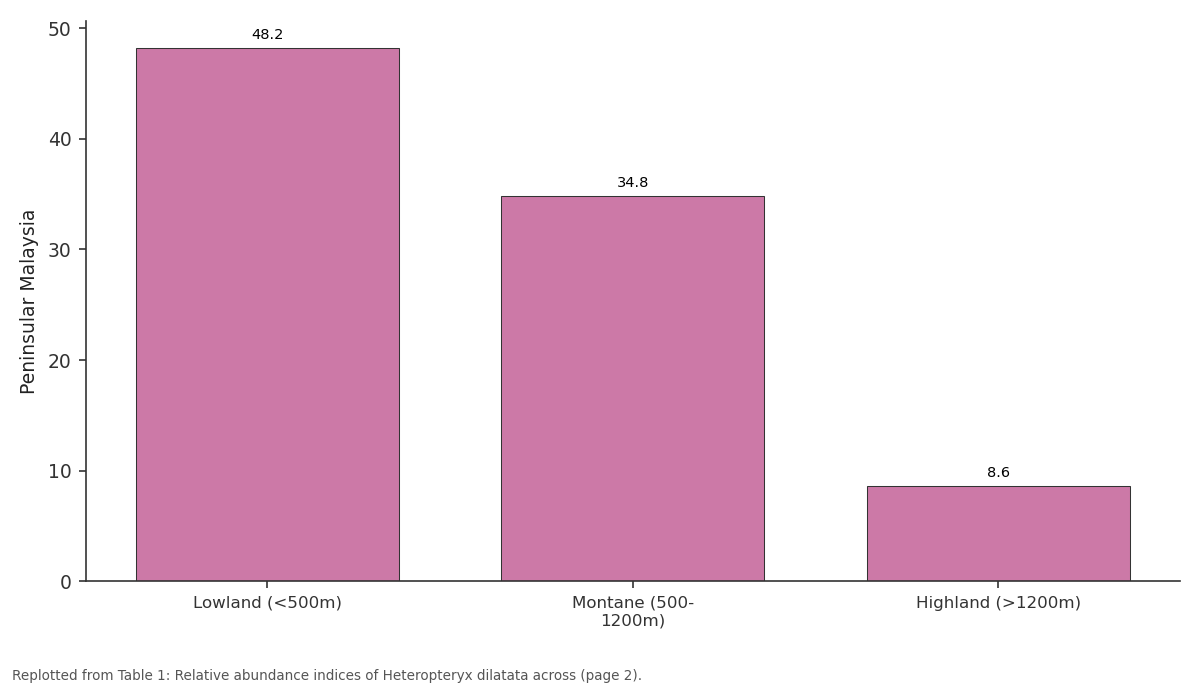
Peninsular Malaysia: Lowland (<500m) vs Montane (500- 1200m) vs Highland (>1200m)
Replotted from Table 1 (page 2) of the original paper. Every bar is the paper's own table value.
View source evidence ↗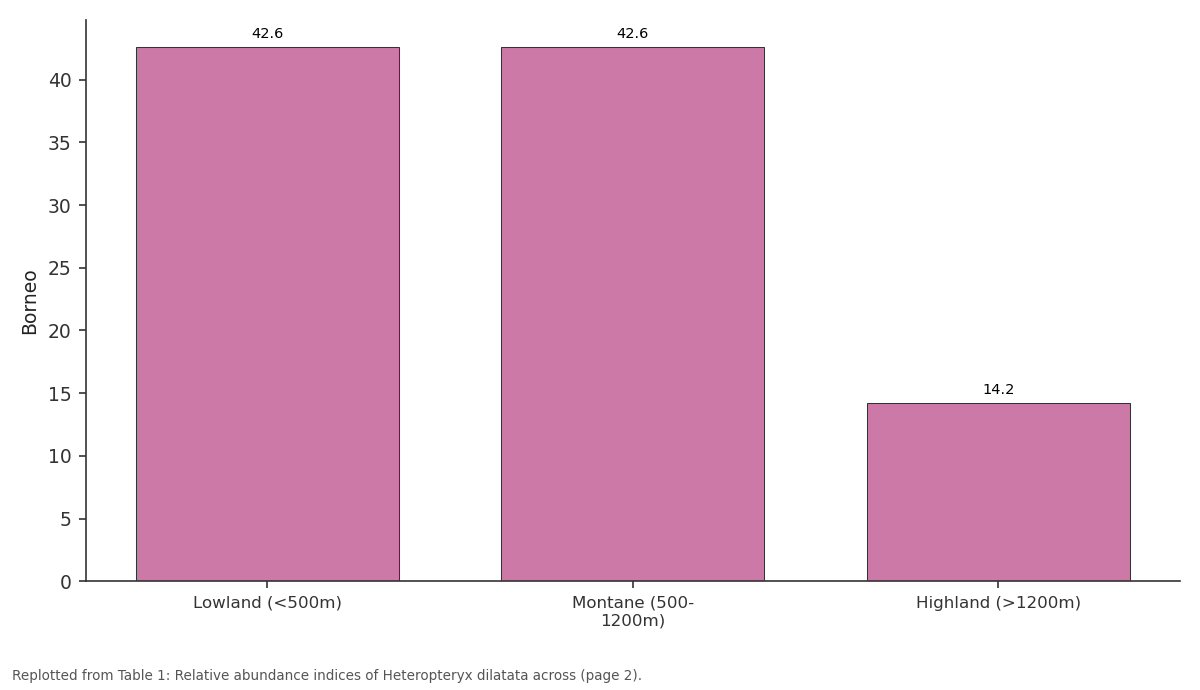
Borneo: Lowland (<500m) vs Montane (500- 1200m) vs Highland (>1200m)
Replotted from Table 1 (page 2) of the original paper. Every bar is the paper's own table value.
View source evidence ↗Figures & tables
From the original paper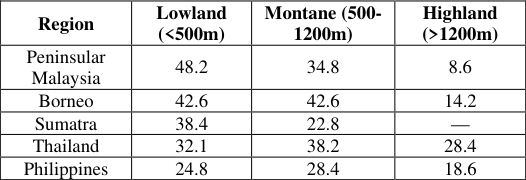 Table 1
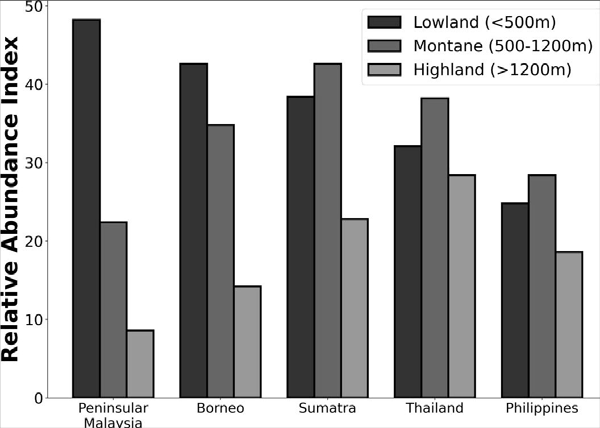 Figure 1
 Table 2
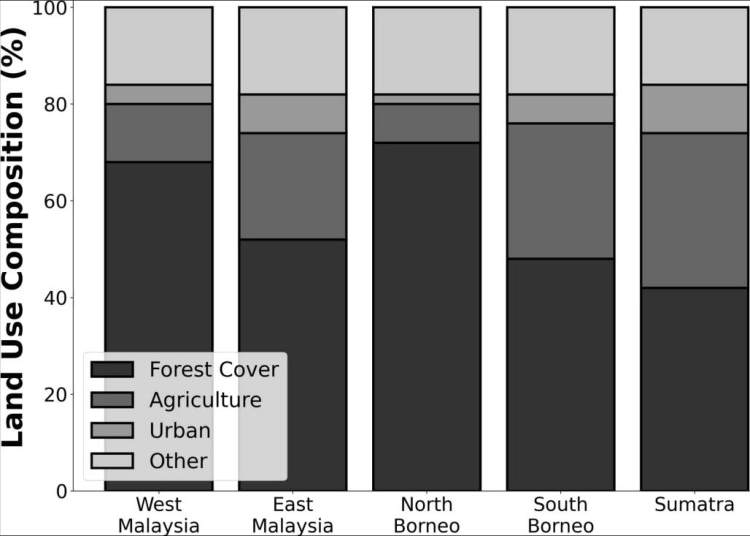 Figure 2
Introduction
Leading biogeographers have long recognized that elevational gradients in tropical mountains represent among the most powerful natural systems for investigating the environmental determinants of species distributions [1,2] . The compression of temperature, humidity, and vegetation transitions across relatively short vertical distances creates replicated environmental gradients that can be leveraged to identify the bioclimatic envelope constraining a given species [3] . Heteropteryx dilatata (Parkinson, 1798) has been recorded from various elevations across its Southeast Asian range, but no systematic investigation has mapped its altitudinal distribution across multiple regions using standardized survey methodology [4,5] . The biogeography of Southeast Asian arthropods is shaped by the complex geological history of the Sunda Shelf, including Pleistocene glacial-interglacial cycles that repeatedly connected and isolated landmasses, promoting both dispersal and vicariance [6,7] . For forest-dependent species such as H. dilatata, these historical dynamics have likely left signatures in current distributional paterns that may be detectable through comparative analysis across regions [8] . Krejsa documented locality records spanning several elevational zones but noted that the upper and lower distributional limits of the species remained poorly defined [8] . This research aimed to characterize the altitudinal distribution of H. dilatata across five major biogeographic regions, identify the environmental factors governing elevational limits, assess the influence of land-use composition on local abundance, and project potential range shifts under future climate scenarios.
Material and Methods
Material and Methods
Material
Field surveys were conducted across 68 transect sites distributed among five biogeographic regions: Peninsular Malaysia (n = 18), Borneo (n = 16), Sumatra (n = 14), Thailand (n = 12), and the Philippines (n = 8). Sites were stratified by elevation into three altitudinal bands: lowland (below 500 meters, n = 26), montane (500-1200 meters, n = 24), and highland (above 1200 meters, n = 18). Surveys were conducted from March 2022 to August 2023. Environmental data recorded at each site included elevation (GPS altimeter), mean annual temperature (from local weather stations), mean annual precipitation, canopy cover, and land-use classification within a 1-kilometer bufer radius. Research permits were obtained from relevant authorities in each country. Ethical approval was granted by the Amsterdam Institute (AIBR/Ethics/2022-046).
Methods
Nocturnal visual encounter surveys followed standardized protocols, with 400-meter transects surveyed by two observers between 20:00 and 01:00 hours during three sampling periods per site. Relative abundance indices (RAI) were calculated as the number of H. dilatata individuals detected per transect per survey night. Land-use composition within a 1-kilometer bufer around each transect was classified from satellite imagery (Sentinel-2, 10-meter resolution) into four categories: forest, agriculture, urban, and other. Bioclimatic modelling was conducted using an ensemble approach combining MaxEnt, generalized additive models (GAM), and boosted regression trees (BRT). Current distributional data were fited against bioclimatic variables from CHELSA version 2.1 (1-kilometer resolution). Future projections used the CMIP [6] SSP2-4.5 and SSP5-8.5 scenarios for the year 2070. Model performance was evaluated using AUC and TSS metrics with 10-fold cross-validation. Statistical analyses of abundance data used generalized linear mixed models (GLMM) with Poisson distribution and log link, including region as a random efect and elevation, land-use proportion, and bioclimatic variables as fixed efects.
Elevational Diversity Paterns in Tropical Arthropods
The mid-elevation peak in species richness and abundance observed for many tropical arthropod groups has been atributed to the mid-domain efect, the intersection of favorable thermal and moisture conditions, and the convergence of lowland and montane species pools [1,3] . For H. dilatata, the expected abundance patern along elevational gradients is shaped by the species' thermal tolerance range and its association with lowland and lower montane dipterocarp forest formations that predominate below approximately 1000 meters in Southeast Asian mountains [4,9] .
Climate Change and Elevational Range Shifts
Climate change is predicted to drive upward elevational shifts in the distributional limits of many tropical ectotherms, potentially compressing mountain-top populations into smaller areas while expanding upper-elevation range margins [2,10] . For species with limited dispersal capacity, the rate of environmental change may exceed the rate at which populations can track suitable conditions, creating extinction debts that manifest over decadal timescales [11] .
Results
Across the 68 surveyed transects, H. dilatata was detected at 52 sites (76.5% occupancy). The species was recorded from a minimum elevation of 50 meters to a maximum of 1340 meters, although abundance declined markedly above 800 meters. The overall mean relative abundance index across all occupied sites was 28.4 individuals per transect, with substantia regional variation. The GLMM analysis identified forest cover as the strongest predictor of local abundance (coeficient = 0.84, p<0.001), followed by mean annual temperature (0.62, p = 0.002) and agricultural land proportion (negative coeficient = -0.72, p<0.001). The ensemble bioclimatic model achieved high predictive performance (mean AUC = 0.91, TSS = 0.78). Future projections under SSP2-4.5 predicted an upward shift of 120-180 meters in the optimal elevational zone by 2070, while SSP5-8.5 projected shifts of 200-280 meters. Under both scenarios, the total area of climatically suitable habitat was projected to decrease by 18-34% due to the narrowing of the upper montane zone.
Discussion
The altitudinal distribution patern documented for H. dilatata shows peak abundance in the lowland to lower montane zone (200-600 meters), declining sharply above 800 meters and absent above 1340 meters. This patern is consistent with thermal limitation at higher elevations, where mean temperatures drop below the species' presumed thermal optimum of 25-28 degrees Celsius [4,8] . The strong positive efect of forest cover on abundance confirms previous observations that this species is forest-dependent and unable to persist in deforested landscapes [5,7] . The projected upward elevational shifts under climate change scenarios have concerning implications, as the area of suitable montane habitat decreases geometrically with elevation due to the conical geometry of tropical mountains [2,10] . This means that even modest upward range shifts could result in substantial reductions in total available habitat area, creating a double threat from simultaneous lowland deforestation and high-elevation climate compression [11] .
Conclusion
Within the biogeographic context of Southeast Asian montane invertebrate distributions, H. dilatata follows the expected patern of lowland-dominated abundance declining with elevation, constrained by thermal limits above approximately 1300 meters. The key findings highlighted include the strong dependence on forest cover for population persistence, the identification of the 200-600 meter elevational band as the core distributional zone, and the projection of significant upward range contraction under future climate scenarios. It is recommended that conservation planning for this species prioritize the protection of lowland and lower montane forest areas where current abundance is highest and threat from agricultural conversion is greatest. Looking forward, long-term monitoring programs along established elevational transects will be essential for detecting early signals of climate-driven distributional shifts and informing adaptive management responses.
Acknowledgement
AcknowledgementsWJvdB designed the research framework and led the biogeographic analysis, EMdG coordinated field surveys across all five regions, TPB performed bioclimatic modelling and future projections, and CAV contributed to GIS analysis and land-use classification. This research was funded by the Netherlands Organization for Scientific Research (NWO). The Amsterdam Institute of Biogeographic Research provided
Figures and tables from the paper
| Region | Lowland (<500m) | Montane (500- 1200m) | Highland (>1200m) |
|---|---|---|---|
| Peninsular Malaysia | 48.2 | 34.8 | 8.6 |
| Borneo | 42.6 | 42.6 | 14.2 |
| Sumatra | 38.4 | 22.8 | — |
| Thailand | 32.1 | 38.2 | 28.4 |
| Philippines | 24.8 | 28.4 | 18.6 |
Table text extracted from the original PDF; superscript letters are shown inline. The original table image is below.
View original table image
| Variable | Mean (Occupied) | Mean (Absent) | GLMM coefficient | p-value |
|---|---|---|---|---|
| Forest cover (%) | 72.4 | 38.6 | 0.84 | <0.001 |
| Mean annual temp (C) | 24.6 | 20.8 | 0.62 | 0.002 |
| Annual precip (mm) | 2480 | 1860 | 0.48 | 0.018 |
| Agriculture (%) | 12.4 | 34.8 | -0.72 | <0.001 |
| Elevation (m) | 448 | 842 | -0.58 | 0.004 |
Table text extracted from the original PDF; superscript letters are shown inline. The original table image is below.
View original table image
References
15 in the original paper- Rahbek C. The role of spatial scale and the perception of large-scale species-richness paterns. Ecol Let. 2005;8(2):224-239.
- Colwell RK, Brehm G, Cardelus CL, Gilman AC, Longino JT. Global warming, elevational range shifts, and lowland biotic atrition in the wet tropics. Science. 2008;322(5899):258-261.
- McCain CM, Grytnes JA. Elevational gradients in species richness. Encyclopedia of Life Sciences. 2010;1-10.
- Bedford GO. Biology and ecology of the Phasmatodea. Annu Rev Entomol. 1978;23:125-149.
- Brock PD. Phasmida species file online. Version 5.0; 2023.
- Woodruf DS. Biogeography and conservation in Southeast Asia: how 2.7 million years of repeated environmental fluctuations afect today's paterns. Biodivers Conserv. 2010;19(4):919-941.
- Sodhi NS, Koh LP, Brook BW, Ng PKL. Southeast Asian biodiversity: an impending disaster. Trends Ecol Evol. 2004;19(12):654-660.
- Krejsa V. The jungle nymph: breeding notes and distribution of Heteropteryx dilatata. Zool Entomol Let. 2024;4(1):9599.https://doi.org/10.22271/leters.2024.v4.i1b.85.
- Hennemann FH, Conle OV, Brock PD, Seow-Choen F. Revision of the Oriental subfamily Heteropteryginae. Zootaxa. 2016;4159(1):1-219.
- Chen IC, Hill JK, Ohlemuller R, Roy DB, Thomas CD. Rapid range shifts of species associated with high levels of climate warming. Science. 2011;333(6045):1024-1026.
- Laurance WF, Useche DC, Shoo LP, et al. Global warming, elevational ranges and the vulnerability of tropical biota. Biol Conserv. 2011;144(1):548-557.
- Seow-Choen F. A taxonomic guide to the stick insects of Borneo. Natural History Publications. 2016;1-454.
- Bank S, Bradler S. A second view on the evolution of flight in stick insects. BMC Ecol Evol. 2022;22:62.
- Brock PD, Hasenpusch JW. The complete field guide to stick and leaf insects of Australia. CSIRO Publishing. 2009;1-204.
- Samways MJ, Barton PS, Birkhofer K, et al. Solutions for humanity on how to conserve insects. Biol Conserv. 2020;242:108427.