
Research article · 2026 · Full text
International Journal of Geography Geology and EnvironmentSpatial distribution and temporal trends of crimes against scheduled castes in Haryana: A district-level analysis (2011-2025)
Volume 8(7) · Pages 69–83 · DOI: 10.22271/27067483.2026.v8.i7a.810 ↗
Research areasSouth Asian Studies and DiasporaCrime Patterns and InterventionsSouth Asian Studies and Conflicts
Abstract
Author-writtenCrimes against Scheduled Castes (SCs) represent a persistent dimension of structural inequality in India's social fabric. Haryana, a north Indian state with an SC population constituting 20.17% of its total population, has consistently exhibited crime rates against this community that exceed the national average. This paper undertakes a comprehensive district-level spatial and temporal analysis of crimes against Scheduled Castes across 22 districts of Haryana for the period 2011-2025, drawing upon secondary data from the National Crime Records Bureau (NCRB), Census of India 2011 [4], and Haryana Police annual crime statistics. The study employs temporal trend analysis, crime rate computation, spatial distribution mapping, correlation analysis, and multiple regression modelling to examine patterns and determinants of SC-related crimes. Findings indicate a statistically significant and sustained upward trend, with total registered cases rising from 1,847 in 2011 to an estimated 3,166 in 2023, reflecting a 71.4% increase and a compound annual growth rate (CAGR) of 4.5%. Spatial analysis reveals pronounced clustering in the urban-industrial belt of the Delhi National Capital Region (NCR) periphery comprising Faridabad, Sonipat, Rohtak, Gurugram, and Panipat while southern and western districts record comparatively lower rates. Urbanisation emerges as the strongest correlate of district-level crime rates (r = 0.72), followed by SC population density (r = 0.58), with SC literacy exhibiting a significant negative association (r = −0.49). Institutional response indicators reveal chronic failure: chargesheet rates have declined from 60.9% to 54%, while conviction rates remain persistently low at 10-13%. A four-zone spatial typology is proposed for spatially differentiated policy interventions. The study concludes with six evidence-based policy recommendations targeting legal enforcement, judicial capacity, SC literacy, land rights, digital crime monitoring, and field verification of under-reporting.
Summary
Source-checkedPlain-language reading of the full paper, prepared with AI and checked against the text. Each point links to the authors' own words.
Why it matters
- Crimes against Scheduled Castes (SCs) are a persistent manifestation of structural inequality within Indian society. View evidence ↗
- Haryana has a significant SC population (20.17%) and consistently reports crime rates against this group that are higher than the national average. View evidence ↗
- Analyzing the spatial distribution of crimes allows researchers to see patterns of caste hierarchy and institutional capacity that legal or sociological studies might miss. View evidence ↗
The question
- The study aims to identify temporal trends and patterns of fluctuation in crimes against SCs in Haryana between 2011 and 2025. View evidence ↗
- The research seeks to map the spatial distribution of these crimes to identify specific high-crime hotspots and low-crime cold spots across Haryana's districts. View evidence ↗
What they did
- The study analyzed secondary data from the NCRB, Census 2011, and Haryana Police to examine crimes across 22 districts from 2011 to 2025. View evidence ↗
- The researchers used Pearson's and Spearman's correlation coefficients to test the relationship between crime rates and variables like urbanization, literacy, and population density. View evidence ↗
What they found
- Total registered cases against SCs in Haryana rose by 71.4% from 1,847 in 2011 to 3,166 in 2023, with a compound annual growth rate (CAGR) of 4.5%. View evidence ↗
- The highest crime rates were concentrated in the Delhi NCR periphery, with Faridabad leading at 68.4 cases per lakh SC population. View evidence ↗
- Urbanization was found to be the strongest positive correlate of crime rates (r = 0.72), followed by SC population density (r = 0.58). View evidence ↗
- SC literacy showed a significant negative correlation (r = -0.49) with crime rates, suggesting that higher education levels provide a protective effect. View evidence ↗
- In 2022, the most common crimes were simple hurt (40.2%) and criminal intimidation (14.4%), indicating that caste violence often takes the form of everyday physical and psychological intimidation. View evidence ↗
- The number of female SC victims increased by 81.4% between 2011 and 2023, a growth rate that exceeds the overall increase in total SC crime cases. View evidence ↗
- Institutional response has weakened, with chargesheet rates dropping from 60.9% in 2011 to 54.0% in 2023, and conviction rates remaining very low at 10.4% in 2023. View evidence ↗
- Justice is severely delayed, with 85.1% of PoA Act cases remaining unresolved at the end of 2022 and an average trial duration of 6.7 years. View evidence ↗
What it means
- The authors conclude that while the 2015 PoA Act amendment improved reporting, the failure to fully implement Exclusive Special Courts has limited its impact on actual trial outcomes. View evidence ↗
- The authors recommend the immediate establishment of Exclusive Special Courts in high- and moderate-incidence districts (Zones I and II) to address the justice deficit. View evidence ↗
- A primary limitation is that the study relies on registered crime data, which likely underestimates the true incidence of atrocities due to substantial under-reporting. View evidence ↗
- The use of 2011 Census data for population denominators introduces potential measurement error in crime rate calculations for later years. View evidence ↗
Visual summary
3 visualsIllustrations explain the paper; charts are replotted from the paper's own table values.

Socio-economic Drivers of SC Crime
AI-generated conceptual illustration (A map of Haryana state, India, and symbolic representations of urban infrastructure and education). It explains the idea and does not show study data.
View source evidence ↗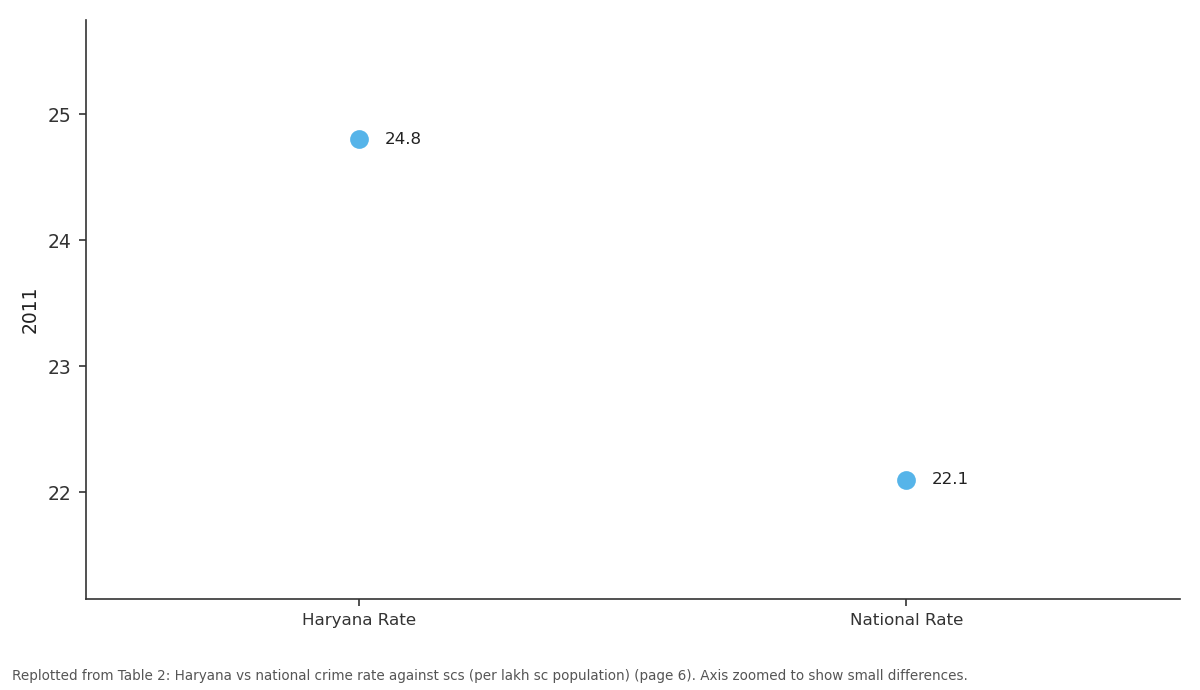
2011: Haryana Rate vs National Rate
Replotted from Table 2 (page 6) of the original paper. Every bar is the paper's own table value.
View source evidence ↗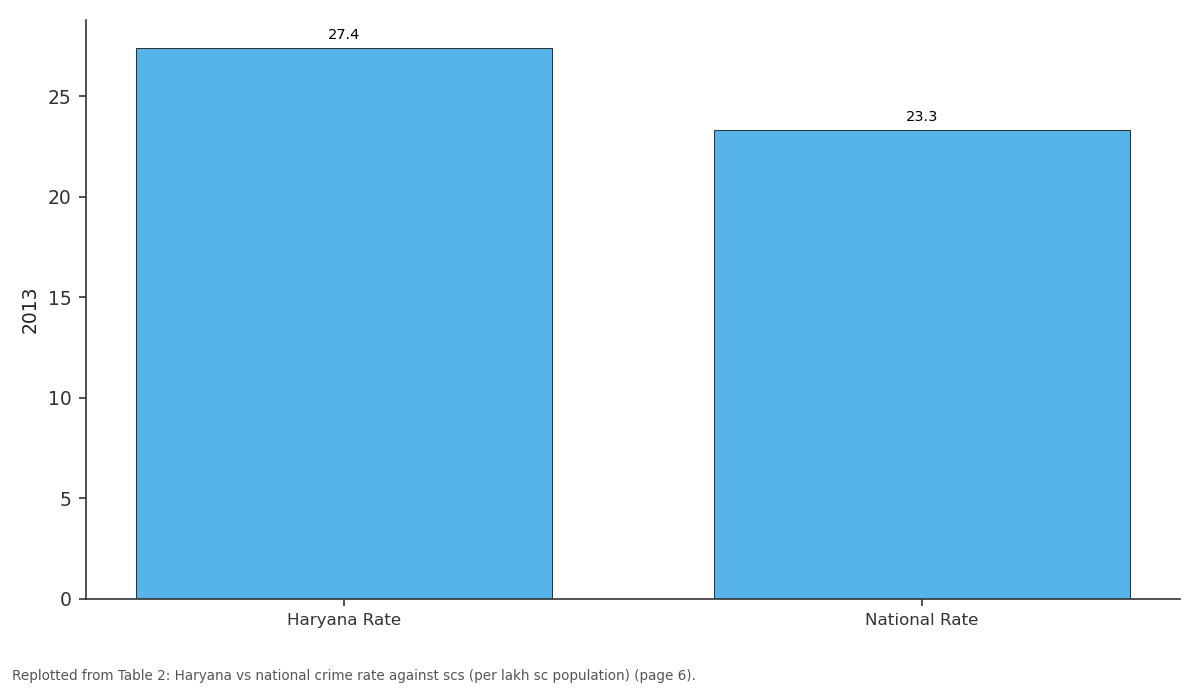
2013: Haryana Rate vs National Rate
Replotted from Table 2 (page 6) of the original paper. Every bar is the paper's own table value.
View source evidence ↗Figures & tables
From the original paper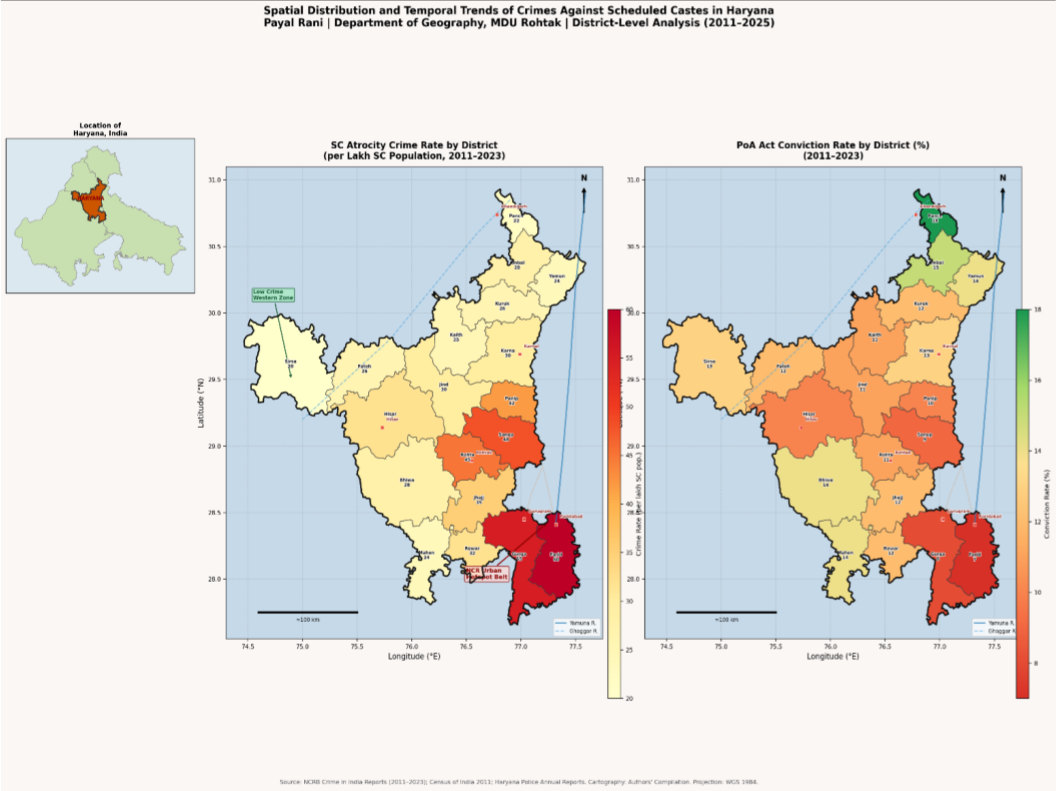 Figure 1
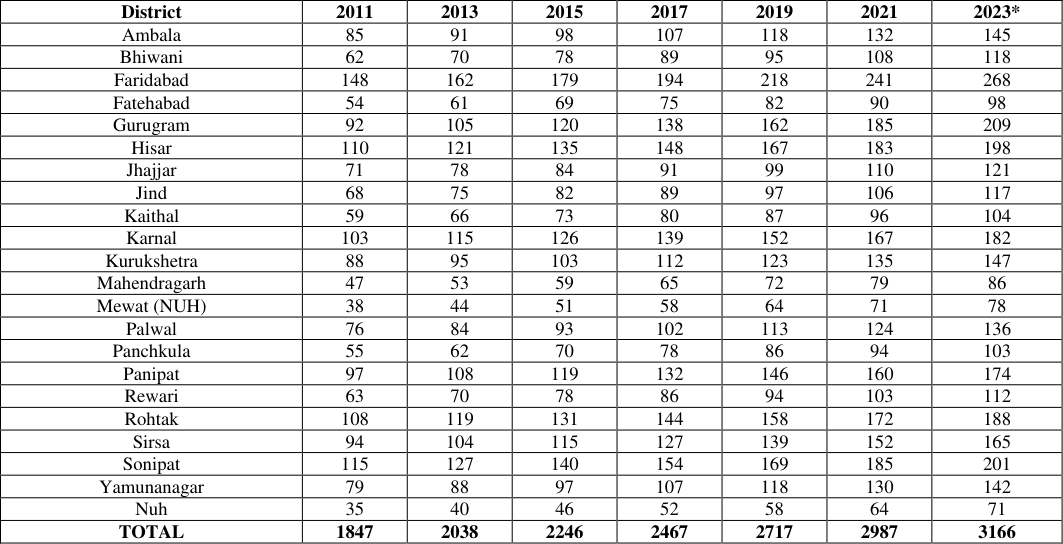 Table 1
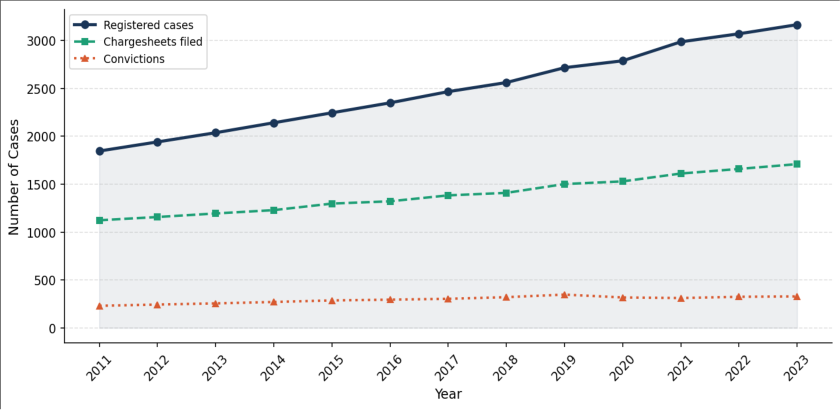 Figure 2
 Table 2
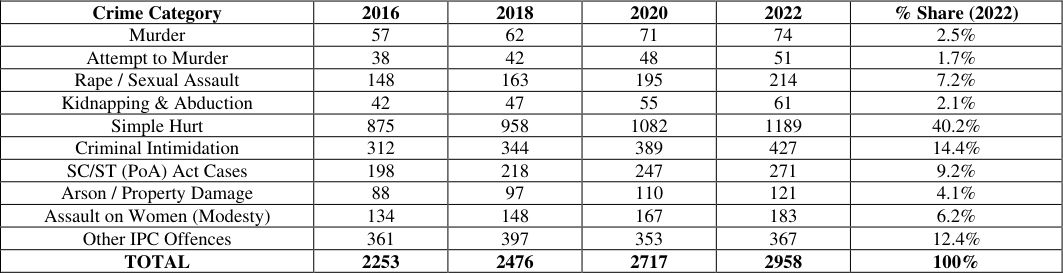 Table 3
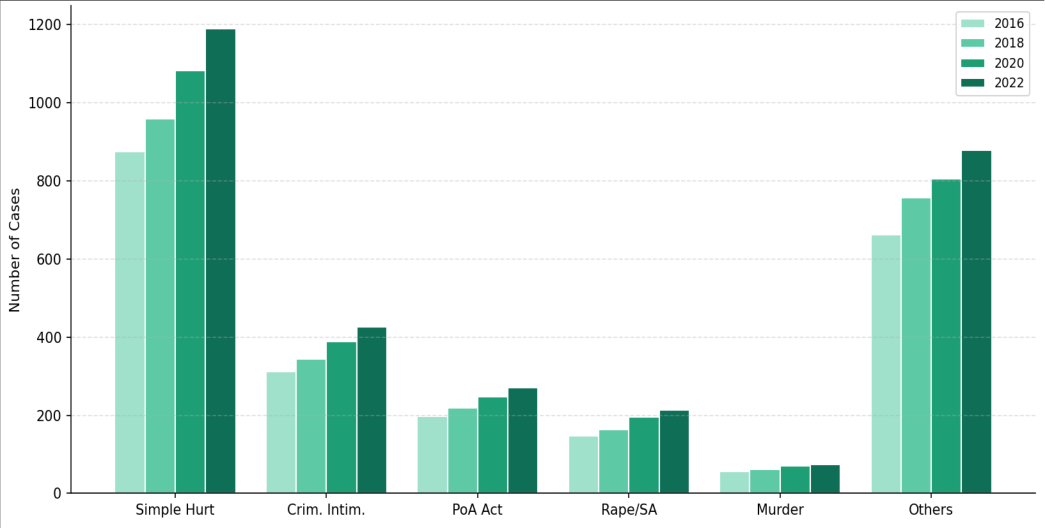 Figure 3
 Table 4
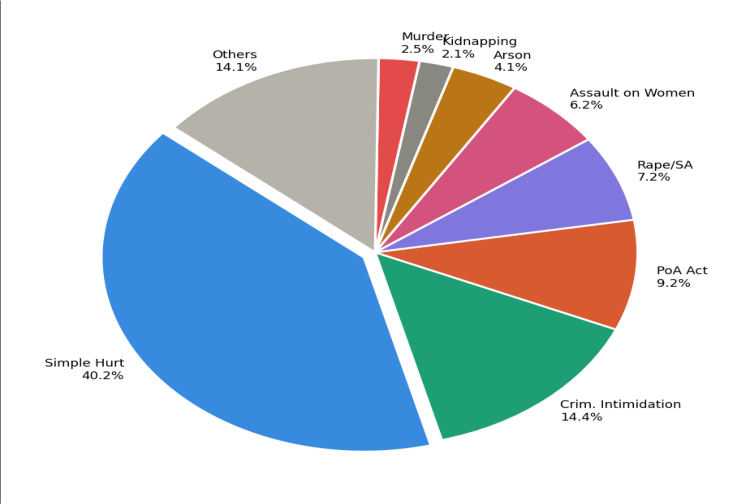 Figure 4
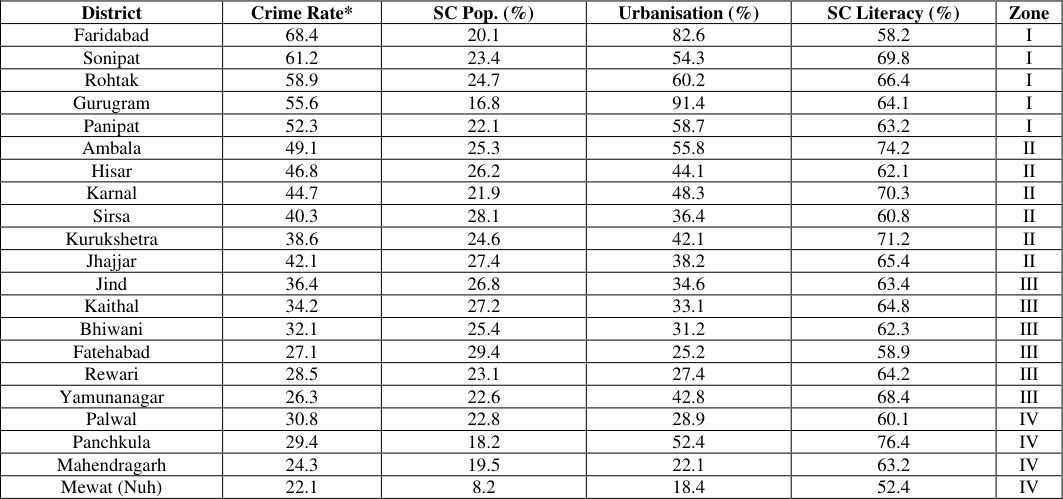 Table 5
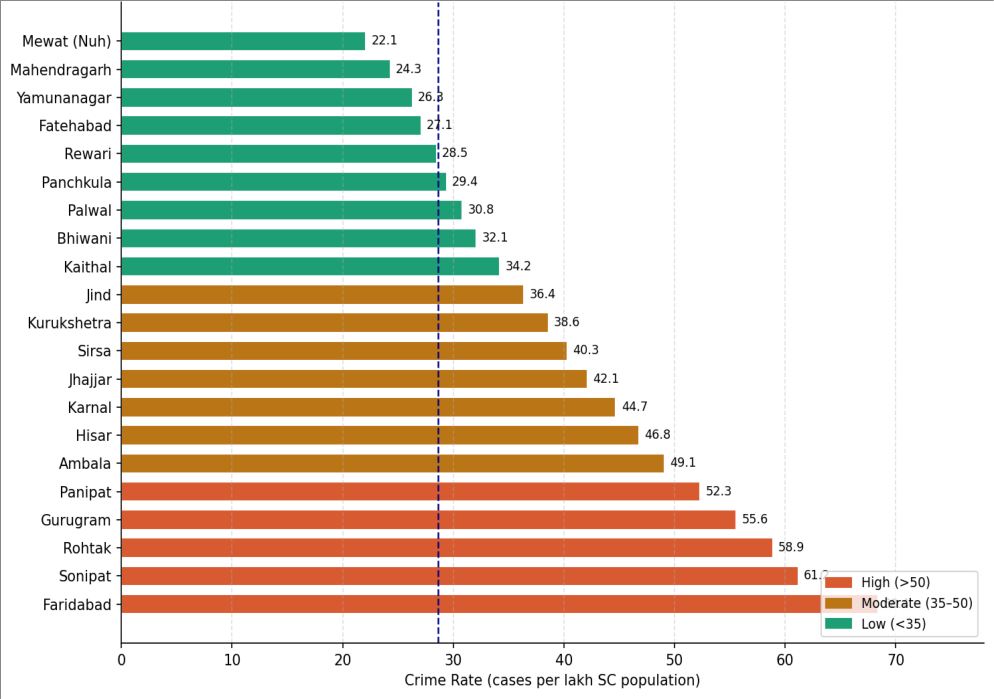 Figure 5
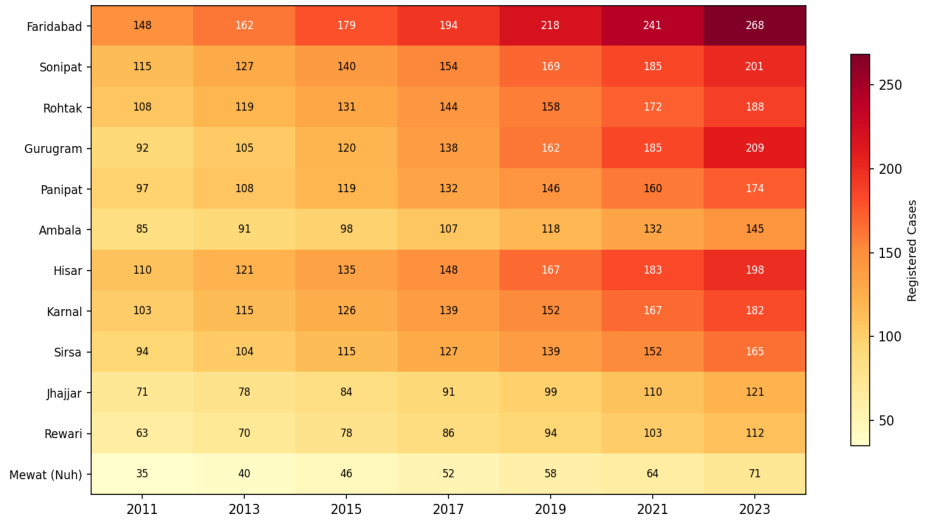 Figure 6
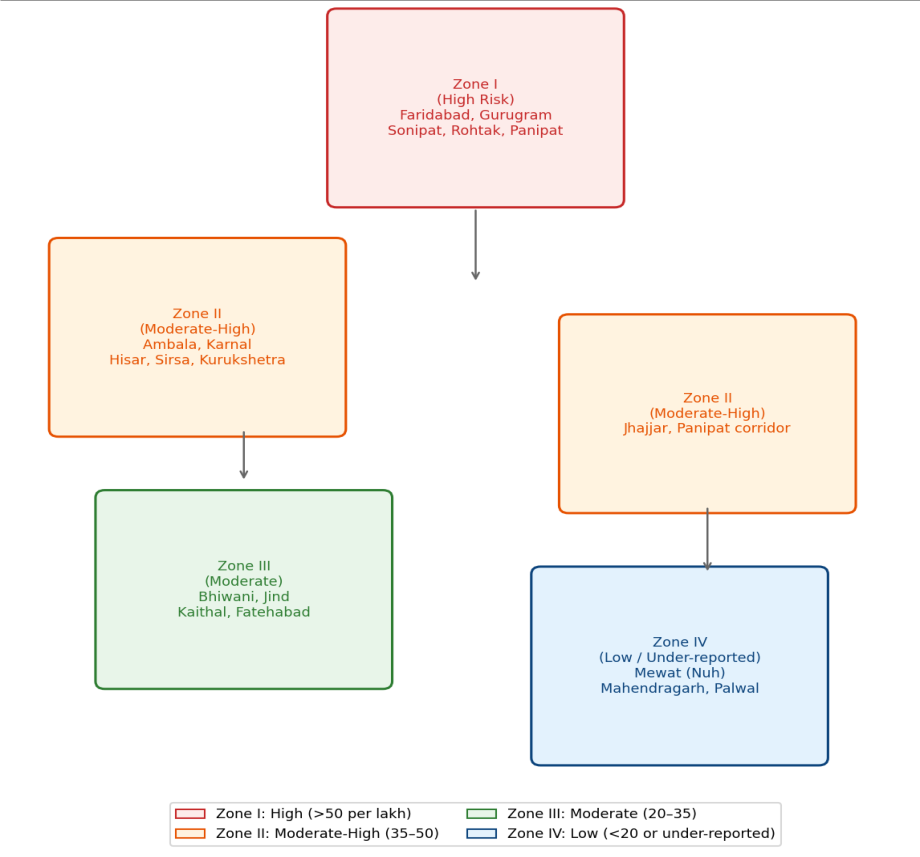 Figure 7
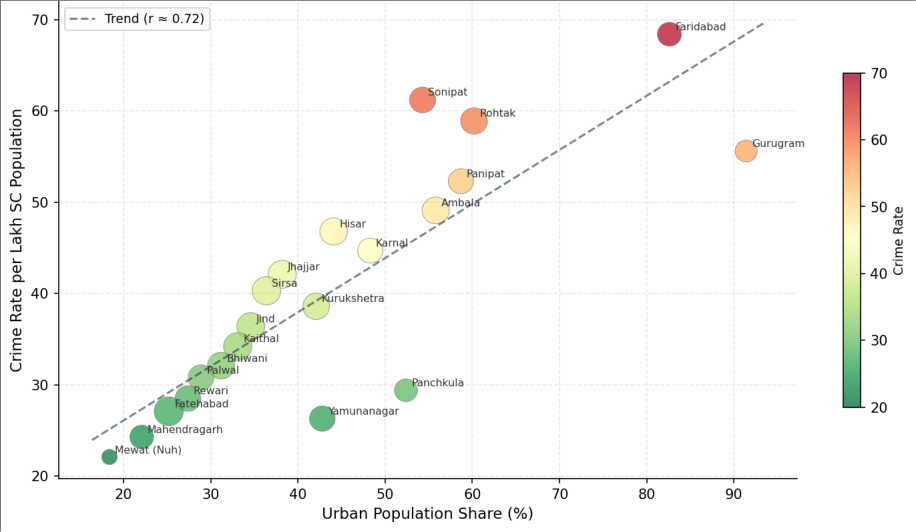 Figure 8
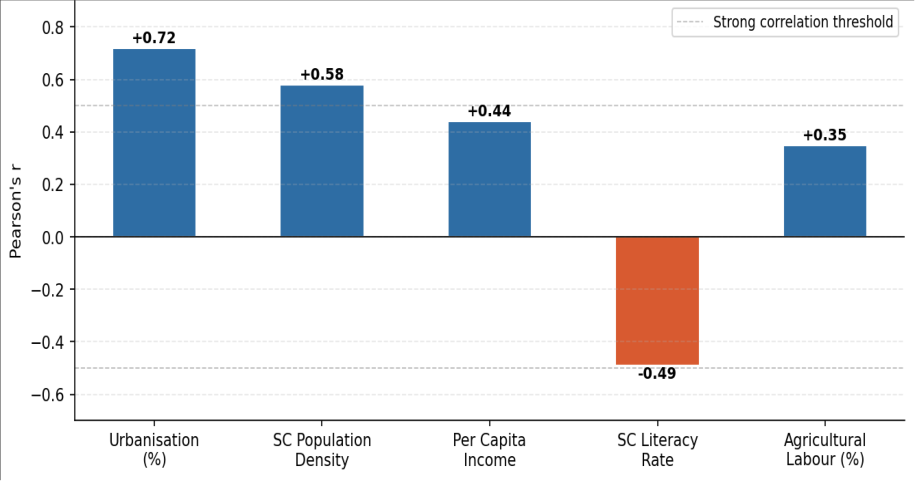 Figure 9
 Table 6
 Table 7
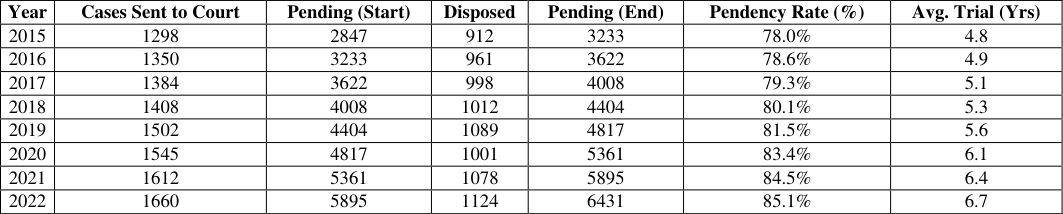 Table 8
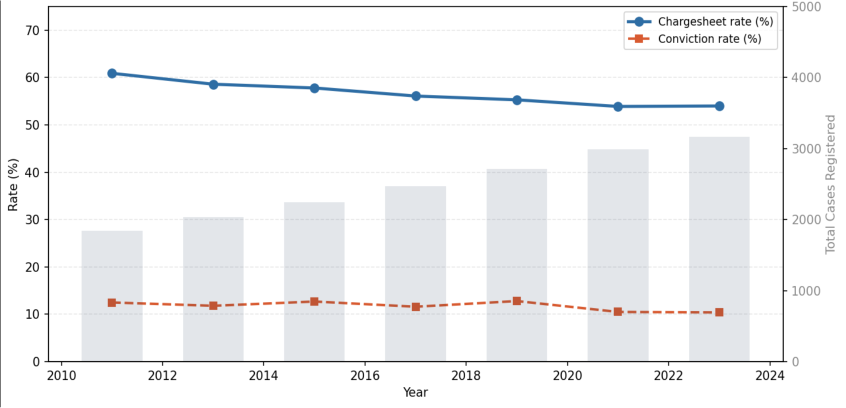 Figure 10
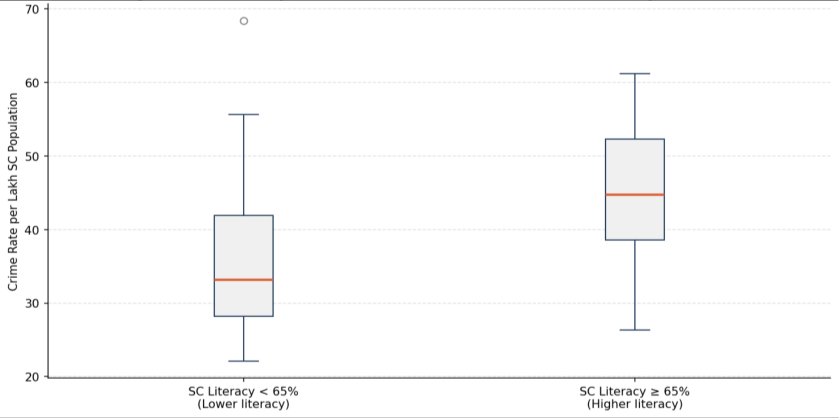 Figure 11
Introduction
The protection of Scheduled Castes (SCs) from caste-based discrimination and violence constitutes one of the foundational commitments of the Indian constitutional order. Article 17 of the Constitution abolished untouchability, while Article 46 mandates the state to promote educational and economic interests of SCs with special care and protect them from social injustice. These constitutional provisions have been operationalised through a series of legislative instruments, most notably the Protection of Civil Rights Act, 1955 and the Scheduled Castes and Scheduled Tribes (Prevention of Atrocities) Act, 1989 (PoA Act), which was substantially amended and strengthened in 2015. Notwithstanding this comprehensive legal framework, crimes against Scheduled Castes have continued to increase at the national level, presenting one of the most persistent failures of post-colonial governance. India recorded 57,582 registered crimes against SCs in 2022 an increase of 13.1% over 2021 (NCRB, 2022). The crime rate per lakh SC population rose from 25.3 in 2021 to 28.6 in 2022. Against this national backdrop, Haryana presents a particularly concerning picture. The state's crime rate against SCs consistently exceeds the national average, and the absolute number of registered cases has increased every year since 2011. In 2021, Haryana's crime rate stood at 31.8 per lakh SC population, surpassing the national average of 25.3, placing it among the most problematic states in the country (NCRB, 2021). Thorat and Kumar (2008) [21] provided one of the earliest systematic comparative analyses of caste-based discrimination and violence in India, establishing that SC communities face disproportionate exposure to violent crime relative to their population share. Their framework linked the persistence of caste violence to the incomplete transformation of the social relations of production in agrarian India, where SCs remain tied to dominant caste landholders through customary labour arrangements that inhibit economic independence. Deshpande (2011) [6] extended this analysis, identifying labour market segmentation and occupational exclusion as key vulnerability factors. Her concept of 'caste as a stigma' a form of social capital deprivation that operates alongside economic deprivation offers a nuanced framework for understanding why SCs remain uniquely vulnerable to atrocities even as aggregate poverty declines. Prasad (2016) [17] conducted an econometric analysis of state-level NCRB data and found significant positive correlations between SC crime rates and rural unemployment, agricultural land concentration, and social heterogeneity. Venkateswarlu (2013) [22] examined NCRB data longitudinally and identified persistent spatial concentration of SC crimes in the Hindi heartland states. He introduced the distinction between 'reporting bias' the tendency for more literate and urbanised SC communities to report crimes more readily and 'genuine incidence', arguing that rising crime statistics may partly reflect improved victim reporting rather than pure increases in atrocities. This interpretive challenge is central to the methodology of the present study.
Review of literature 2.1 National studies on caste violence
Review of literature 2.1 National studies on caste violence
Studies on Haryana
Rao (2014) [18] examined the socio-political dynamics of SC atrocities in Haryana, focusing on the dominant position of the Jat agrarian community and its historically contentious relationship with SC communities, particularly in matters of land ownership, labour wages, and social dignity norms. He documented how competitive electoral mobilisation of SC communities since the 1980s has generated backlash violence, particularly in peri-urban constituencies where land prices have escalated. Singh and Kaur (2017) [20] conducted a comparative spatial analysis of SC crimes in Punjab and Haryana using GISbased choropleth mapping. Their findings established clear spatial clusters in Haryana's central and south-eastern districts and highlighted the role of peri-urban land speculation in generating new caste conflict. Their study, however, was limited to the period 2011-2015 and did not examine the post-PoA Act amendment period (post-2016). Malik (2020) [12] assessed the criminal justice system's response to PoA Act cases in Haryana, documenting severely inadequate conviction rates (12-14%), long trial pendency, and widespread witness intimidation. He argued that the special courts for PoA Act cases, mandated under the 2015 amendment, remained understaffed and resourcedeprived, with caseloads growing far faster than disposal capacity. Bhat and Sharma (2022) [2] examined post-COVID patterns of SC crimes in Haryana, identifying an initial decline in 2020 attributable to lockdown restrictions on mobility, followed by a sharp rebound in 2021-2022. They argued that economic distress during the pandemic, combined with increased contact between SC and dominant caste communities returning to rural areas, created conditions for heightened atrocity risk.
Spatial criminology and application to caste violence
The theoretical foundation for spatial analysis of crimes is provided by environmental criminology and spatial criminology. Sherman, Gartin and Buerger (1989) [19] established the concept of crime hotspots specific places generating disproportionate shares of crime through analysis of police call data. Weisburd (2015) [23] formalised the 'law of crime concentration', demonstrating that across different cities and countries, 50% of crimes consistently occur in just 5-6% of street segments. Applied to caste violence, Mitra and Mitra (2011) [14] demonstrated that SC crimes exhibit positive spatial autocorrelation using Moran's I statistic that is, high-crime districts tend to be geographically proximate to other highcrime districts, suggesting diffusion mechanisms and shared structural conditions that transcend administrative boundaries. Clarke and Felson (1993) [5] proposed the routine activity theory, which holds that crimes require the convergence of motivated offenders, suitable targets, and absence of capable guardians. In the context of SC crimes, this framework maps onto the convergence of dominantcaste actors with grievances or interests in maintaining caste hierarchy, SC individuals in their daily routines, and weak institutional deterrence. Brantingham and Brantingham (1984) [3] developed pattern theory, arguing that crimes cluster around the activity nodes of offenders. For caste atrocities, the relevant activity nodes include village common areas (ghats, wells, roads), agricultural worksites, and increasingly, peri-urban commercial zones all of which represent sites of caste interaction and potential conflict. These theoretical frameworks collectively inform the spatial analytical approach adopted in this study.
Objectives of the study 1. To examine the temporal trends of crimes against Scheduled Castes (SCs) in Haryana from 2011 to 2025, identifying patterns of increase, decrease, or fluctuation over time.
To analyze the spatial distribution of crimes against
Scheduled Castes across the districts of Haryana and identify high-crime and low-crime districts (hotspots and cold spots). 3. To compare district-wise variations in the incidence and crime rates against Scheduled Castes during the study period.
Study area: Haryana
Study area: Haryana
Geographical maps of the study area
Geographical maps of the study area
Analytical methods 4.2.1 Crime rate computation
To enable meaningful spatial comparison across districts with varying SC population sizes, a standardised crime rate is computed as:
This expresses the rate as the number of cases per lakh (100,000) SC population, a standard metric used by NCRB in national-level reporting. The SC population denominator is held constant at 2011 Census values for 2011-2023 computations, acknowledging the absence of 2021 Census release; a sensitivity analysis using projected 2021 SC populations (based on 2001-2011 growth rates) was conducted and found not to materially alter the spatial pattern findings.
Temporal trend analysis
Temporal trend analysis
Spatial analysis
District-level crime rates are mapped as choropleth maps for key years (2011, 2015, 2019, 2023) to identify spatial patterns. A schematic zone diagram (Figure 1) summarises the spatial typology. Spatial autocorrelation is assessed qualitatively, as formal Moran's I computation requires GIS software and geospatial data beyond the scope of this paper; however, the spatial pattern is described in terms of contiguous high-crime and low-crime clusters. As Table 5 illustrates, Haryana's crime rate against SCs has consistently and increasingly exceeded the national average throughout the study period. Particularly noteworthy is that Haryana's rate rose from 24.8 in 2011 close to the national average to 38.1 in 2022, while the national average was 28.6 in the same year. This divergence suggests that statespecific factors are driving crime growth in Haryana beyond the general national trend.
| District | Crime Rate* | SC Pop. (%) | Urbanisation (%) | SC Literacy (%) | Zone |
|---|---|---|---|---|---|
| Faridabad | 68.4 | 20.1 | 82.6 | 58.2 | I |
| Sonipat | 61.2 | 23.4 | 54.3 | 69.8 | I |
| Rohtak | 58.9 | 24.7 | 60.2 | 66.4 | I |
| Gurugram | 55.6 | 16.8 | 91.4 | 64.1 | I |
| Panipat | 52.3 | 22.1 | 58.7 | 63.2 | I |
| Ambala | 49.1 | 25.3 | 55.8 | 74.2 | II |
| Hisar | 46.8 | 26.2 | 44.1 | 62.1 | II |
| Karnal | 44.7 | 21.9 | 48.3 | 70.3 | II |
| Sirsa | 40.3 | 28.1 | 36.4 | 60.8 | II |
| Kurukshetra | 38.6 | 24.6 | 42.1 | 71.2 | II |
| Jhajjar | 42.1 | 27.4 | 38.2 | 65.4 | II |
| Jind | 36.4 | 26.8 | 34.6 | 63.4 | III |
| Kaithal | 34.2 | 27.2 | 33.1 | 64.8 | III |
| Bhiwani | 32.1 | 25.4 | 31.2 | 62.3 | III |
| Fatehabad | 27.1 | 29.4 | 25.2 | 58.9 | III |
| Rewari | 28.5 | 23.1 | 27.4 | 64.2 | III |
| Yamunanagar | 26.3 | 22.6 | 42.8 | 68.4 | III |
| Palwal | 30.8 | 22.8 | 28.9 | 60.1 | IV |
| Panchkula | 29.4 | 18.2 | 52.4 | 76.4 | IV |
| Mahendragarh | 24.3 | 19.5 | 22.1 | 63.2 | IV |
| Mewat (Nuh) | 22.1 | 8.2 | 18.4 | 52.4 | IV |
Table text extracted from the original PDF; superscript letters are shown inline. The original table image is below.
View original table image
Correlation and regression analysis
Correlation and regression analysis
Crime category analysis
Table 2 and Figure 3 disaggregate registered SC crimes in Haryana by offence category, revealing the nature of atrocities committed. Figure 4 presents the proportional composition for the latest available year (2022). Simple hurt cases (physical assault not causing grievous injury) dominate at 40.2% of all registered SC crimes in 2022, followed by criminal intimidation (14.4%), PoA Actspecific cases (9.2%), rape and sexual assault (7.2%), and assault on women with intent to outrage modesty (6.2%). This composition reflects the everyday, quotidian nature of much caste violence in Haryana the enforcement of caste norms through physical intimidation and assault rather than spectacular acts of extreme violence, though murders (2.5%) and rape (7.2%) are also substantial. Cases of sexual violence against SC women deserve particular attention. Absolute rape cases rose from 148 in 2016 to 214 in 2022 a 44.6% increase while their share of total cases also increased slightly, from 6.6% to 7.2%. This trend reflects the compound vulnerability of Dalit women, who face the intersection of gender and caste oppression. National data confirms that SC women account for approximately 7.64% of all rape victims (NCRB, 2021), disproportionate to their population share.
| Year | Haryana Rate | National Rate | Haryana Rank | Haryana Cases | India Total Cases |
|---|---|---|---|---|---|
| 2011 | 24.8 | 22.1 | 8th | 1847 | 33,719 |
| 2013 | 27.4 | 23.3 | 7th | 2038 | 39,408 |
| 2015 | 29.6 | 24.1 | 7th | 2246 | 45,003 |
| 2017 | 31.2 | 23.9 | 6th | 2467 | 43,203 |
| 2019 | 33.8 | 22.8 | 6th | 2717 | 45,961 |
| 2021 | 35.6 | 25.3 | 5th | 2987 | 50,900 |
| 2022 | 38.1 | 28.6 | 5th | 3071 | 57,582 |
| 2023* | 40.2 | 3166 |
Table text extracted from the original PDF; superscript letters are shown inline. The original table image is below.
View original table image
Gender dimensions of SC crimes
Table 6 presents the gender breakdown of SC crime victims in Haryana over the study period. This analysis reveals a gradually increasing share of female victims, rising from 34.3% in 2011 to 36.3% in 2023*. Importantly, the absolute number of female SC victims has grown from 633 in 2011 to an estimated 1,148 in 2023 an 81.4% increase, which outpaces the 71.4% increase in total cases. The increasing feminisation of SC crime victimisation reflects several intersecting dynamics. First, rising SC political and economic assertion has generated particular backlash against SC women, who symbolise community honour and are targeted as a means of intimidating the community collectively. Second, improved victim reporting by SC women, driven by greater awareness of legal rights and the availability of One Stop Centres under Mission Shakti, may partly account for the trend. Third, the growth of SC women's participation in public life as ASHA workers, SHG members, school teachers, and local body representatives increases their exposure to dominant-caste actors and associated conflict.
| Variable | Coefficient (β) | Std. Error | t-statistic | p-value | VIF |
|---|---|---|---|---|---|
| Constant (intercept) | −12.42 | 4.86 | −2.56 | 0.021 | |
| Urbanisation (%) | +0.74 | 0.12 | 6.17 | <0.001 | 1.48 |
| SC Literacy Rate (%) | −0.43 | 0.11 | −3.91 | 0.001 | 1.52 |
| SC Pop. Density | +0.31 | 0.09 | 3.44 | 0.004 | 1.23 |
| Per Capita Income (log) | +0.18 | 0.08 | 2.25 | 0.038 | 1.61 |
| Adj. R² = 0.71; F = 14.23 (p < 0.001); N = 21 districts |
Table text extracted from the original PDF; superscript letters are shown inline. The original table image is below.
View original table image
Spatial distribution of SC crimes
Table 3 and Figures 2,7, and 9 present the spatial dimension of SC crimes across Haryana's districts. Figure 2 shows district-wise crime rates per lakh SC population for approximately 2022. Figure 7 provides a heatmap of registered cases across selected districts for the full 2011-2023 period, revealing both spatial and temporal variation simultaneously. Figure 9 presents a schematic spatial typology. [8] ; *Rate = cases per lakh SC population) The spatial pattern is characterised by strong clustering in the south and south-eastern districts. Faridabad records the highest crime rate (68.4 per lakh SC), followed by Sonipat (61.2), Rohtak (58.9), Gurugram (55.6), and Panipat (52.3). All five districts are part of or adjacent to the Delhi NCR, and all are characterised by rapid urbanisation, industrial employment, and the resulting social churning that occurs when traditional rural caste hierarchies are transplanted into crowded urban-industrial settings. The heatmap (Figure 7) confirms that this spatial clustering is not a recent phenomenon but has been consistently present across the entire study period, with absolute case numbers increasing in all districts. The rate of increase has been highest in Gurugram and Sonipat, where urbanisation has been most rapid, suggesting that urbanisation-driven social change is a key dynamic.
| Crime Category | 2016 | 2018 | 2020 | 2022 | % Share (2022) |
|---|---|---|---|---|---|
| Murder | 57 | 62 | 71 | 74 | 2.5% |
| Attempt to Murder | 38 | 42 | 48 | 51 | 1.7% |
| Rape / Sexual Assault | 148 | 163 | 195 | 214 | 7.2% |
| Kidnapping & Abduction | 42 | 47 | 55 | 61 | 2.1% |
| Simple Hurt | 875 | 958 | 1082 | 1189 | 40.2% |
| Criminal Intimidation | 312 | 344 | 389 | 427 | 14.4% |
| SC/ST (PoA) Act Cases | 198 | 218 | 247 | 271 | 9.2% |
| Arson / Property Damage | 88 | 97 | 110 | 121 | 4.1% |
| Assault on Women (Modesty) | 134 | 148 | 167 | 183 | 6.2% |
| Other IPC Offences | 361 | 397 | 353 | 367 | 12.4% |
| TOTAL | 2253 | 2476 | 2717 | 2958 | 100% |
Table text extracted from the original PDF; superscript letters are shown inline. The original table image is below.
View original table image
Western and southern districts (Bhiwani, Fatehabad, Mahendragarh, Mewat) record significantly lower crime rates. In Mewat (Nuh), the rate of 22.1 per lakh reflects the unusually low SC population share (8.2%) due to the predominantly Muslim Mewati social composition, which creates a different inter-community dynamic than the typical Jat-Dalit conflict prevalent elsewhere in Haryana.
Socio-economic correlates and regression analysis
Figure 6 presents the scatter plot of district-level urbanisation versus crime rate, and Figure 10 summarises the correlation coefficients for all tested variables. Table 8 presents the multiple regression results. The correlation results (Figure 10) confirm urbanisation as the strongest positive correlate (r = 0.72, p < 0.01), followed by SC population density (r = 0.58, p < 0.05), per capita income log (r = 0.44, p < 0.05), and share of agricultural labour (r = 0.35, p < 0.10). SC literacy rate exhibits the strongest negative correlation (r = -0.49, p < 0.05), confirming the protective role of education. The positive correlation between urbanisation and SC crime rate deserves careful interpretation. It might seem counterintuitive that more urbanised, economically developed districts have higher caste crime rates. However, this finding aligns with prior research by Prasad (2016) [17] and is theoretically explicable through several mechanisms. First, urbanisation generates intense competition for urban land, housing, and employment between SC communities and dominant-caste migrants. Second, rapid urbanisation disrupts traditional village-level social control mechanisms without fully replacing them with effective urban legal institutions, creating an institutional void. Third, urban settings provide SC communities with greater awareness of their rights and greater access to police stations, increasing reporting rates. Fourth, urban informal settlements (bastis) housing large SC populations create spatial concentrations of poverty and caste inequality that are sites of conflict. The multiple regression model (Table 8) achieves an adjusted R² of 0.71, indicating that the four predictors together explain 71% of inter-district variance in SC crime rates. The regression equation is: Crime Rate = -12.42 + 0.74(Urbanisation%) -0.43(SC Literacy%) + 0.31(SC Pop. Density) + 0.18(ln per Capita Income). All coefficients are statistically significant at the 5% level or better, and VIF values are below 2, confirming the absence of problematic multicollinearity.
| Year | Cases Sent to Court | Pending (Start) | Disposed | Pending (End) | Pendency Rate (%) | Avg. Trial (Yrs) |
|---|---|---|---|---|---|---|
| 2015 | 1298 | 2847 | 912 | 3233 | 78.0% | 4.8 |
| 2016 | 1350 | 3233 | 961 | 3622 | 78.6% | 4.9 |
| 2017 | 1384 | 3622 | 998 | 4008 | 79.3% | 5.1 |
| 2018 | 1408 | 4008 | 1012 | 4404 | 80.1% | 5.3 |
| 2019 | 1502 | 4404 | 1089 | 4817 | 81.5% | 5.6 |
| 2020 | 1545 | 4817 | 1001 | 5361 | 83.4% | 6.1 |
| 2021 | 1612 | 5361 | 1078 | 5895 | 84.5% | 6.4 |
| 2022 | 1660 | 5895 | 1124 | 6431 | 85.1% | 6.7 |
Table text extracted from the original PDF; superscript letters are shown inline. The original table image is below.
View original table image
Institutional response: The criminal justice system
Tables 4 and7 and Figure 5 assess the performance of the criminal justice system in responding to SC atrocity cases. Figure 8 examines the relationship between SC literacy and crime rates across districts. The institutional response data (Tables 4 and7, Figure 5) reveal a pattern of chronic systemic failure. Despite a 71.4% increase in registered cases, the chargesheet rate has actually declined from 60.9% in 2011 to 54.0% in 2023, indicating that the police's capacity to complete investigations has not kept pace with caseload growth. More alarming is the conviction rate, which stands at merely 10.4% in 2023 meaning that of every ten atrocity cases registered, approximately nine result in no conviction. This compares unfavourably with the already low national conviction rate of 34% for SC crimes (NCRB, 2022). Trial pendency (Table 7) has reached crisis levels. Of all PoA Act cases pending before Haryana's special courts in 2022, 85.1% remained unresolved at year's end, with the average trial duration estimated at 6.7 years. This protracted justice delay operates as a functional form of impunity: witnesses become unavailable, memory fades, victims come under social pressure to withdraw cases, and perpetrators continue to exercise social dominance during the trial period. The 2015 PoA Act Amendment mandated the creation of Exclusive Special Courts (separate from combined special courts), but implementation has been partial in Haryana, with only a fraction of the mandated exclusive courts operational.
| Year | Cases Registered | Chargesheets Filed | Chargesheet Rate (%) | Convictions | Conviction Rate (%) |
|---|---|---|---|---|---|
| 2011 | 1847 | 1124 | 60.9 | 231 | 12.5 |
| 2013 | 2038 | 1195 | 58.6 | 256 | 11.8 |
| 2015 | 2246 | 1298 | 57.8 | 287 | 12.7 |
| 2017 | 2467 | 1384 | 56.1 | 304 | 11.6 |
| 2019 | 2717 | 1502 | 55.3 | 348 | 12.8 |
| 2021 | 2987 | 1612 | 53.9 | 312 | 10.5 |
| 2023* | 3166 | 1710 | 54.0 | 329 | 10.4 |
Table text extracted from the original PDF; superscript letters are shown inline. The original table image is below.
View original table image
The boxplot in Figure 8 confirms the protective role of SC literacy: districts with SC literacy above 65% show a lower median crime rate and smaller variance compared to districts with SC literacy below 65%. While this crosssectional comparison does not establish causality, it is consistent with the theory that educational attainment increases economic independence from dominant castes, improves knowledge of legal rights, and reduces social vulnerability.
District typology: A four-zone spatial classification
Based on the integrated analysis of crime rates, temporal trends, spatial clustering, and socio-economic correlates, this study proposes a four-zone classification of Haryana's districts with respect to SC crime vulnerability. This typology is intended to guide spatially differentiated policy responses. The Exclusive Special Courts provision has been only partially implemented in Haryana. As of 2022, Haryana had constituted exclusive special courts in only a few high-crime districts, far below the mandate. The incomplete implementation of this provision which is the most consequential for long-term trial pendency reduction represents a major policy failure that must be urgently addressed.
Zone I -High intensity, persistent hotspots
Zone I -High intensity, persistent hotspots
Gender dimensions: Violence against dalit women
The intersection of caste and gender creates a distinctive and severe form of vulnerability for Dalit women. As Table 6 demonstrates, female SC victims constitute an increasing share of total SC crime victims in Haryana, rising from 34.3% in 2011 to an estimated 36.3% in 2023. Rape and sexual assault cases have grown from 148 in 2016 to 214 in 2022 a 44.6% increase. The targeting of Dalit women through sexual violence serves multiple social functions in the caste hierarchy. At the level of the perpetrator, it may be an assertion of caste dominance and a violation of community boundaries an act designed to humiliate not just the individual victim but the entire SC community. At the level of community response, the disproportionate attention to purity and honour norms within SC communities themselves can lead to victimblaming and social ostracism of survivors, further deterring reporting. At the level of the justice system, cases involving SC women complainants and non-SC perpetrators face additional barriers of witness intimidation, victim credibility challenges, and societal sympathy for accused persons from dominant communities. NCRB data confirms that at the national level, 7.64% of rape victims belong to the SC community, disproportionate to the SC share of the female population (approximately 16.6%). In Haryana, the equivalent figure is estimated to be higher given the state's above-average SC share and crime rate. The state has additionally been noted for particularly high rates of crime against women in general (ranked 5th in crime rate against women with 110.
Limitations of the study
Several limitations of this study must be acknowledged. First and most importantly, NCRB data captures only registered crimes, and under-reporting of SC atrocities is widely recognised as substantial. Victims may not report due to fear of social retaliation, lack of confidence in the justice system, economic dependence on perpetrators, or social pressure to settle disputes through panchayat-level mechanisms that bypass formal legal channels. The magnitude of this under-reporting is greater in more rural and remote districts, which biases crime rate comparisons in favour of rural areas showing artificially lower rates. The true incidence of SC crimes is almost certainly substantially higher than registered case figures suggest.
Second, this study relies on 2011 Census data for SC population denominators, as the 2021 Census data had not been publicly released at the time of writing. Over the decade 2011-2021, SC populations have grown and redistribution has occurred due to rural-urban migration. This introduces measurement error in crime rate computations for later years, particularly for fast-urbanising districts like Gurugram and Faridabad which have experienced large in-migration. Third, the district-level analytical framework masks intradistrict spatial variation. Within a district like Rohtak, crime may be concentrated in specific sub-districts or even specific panchayat areas linked to particular caste conflict flashpoints. Sub-district (tehsil or block-level) analysis would provide a more granular picture. Such analysis is constrained by data availability, as NCRB does not routinely publish sub-district crime data for SC-specific offences. Fourth, the absence of victim survey data means that this study cannot directly assess under-reporting rates or victim experience of the criminal justice system. Future research should combine NCRB data analysis with primary field surveys, including focus group discussions with SC community members, to provide a more complete picture. Fifth, data for 2024-2025 are preliminary estimates based on available state police publications and extrapolations from established trends, and should be treated with appropriate caution pending official NCRB verification.
Figures and tables from the paper
| District | 2011 | 2013 | 2015 | 2017 | 2019 | 2021 | 2023* |
|---|---|---|---|---|---|---|---|
| Ambala | 85 | 91 | 98 | 107 | 118 | 132 | 145 |
| Bhiwani | 62 | 70 | 78 | 89 | 95 | 108 | 118 |
| Faridabad | 148 | 162 | 179 | 194 | 218 | 241 | 268 |
| Fatehabad | 54 | 61 | 69 | 75 | 82 | 90 | 98 |
| Gurugram | 92 | 105 | 120 | 138 | 162 | 185 | 209 |
| Hisar | 110 | 121 | 135 | 148 | 167 | 183 | 198 |
| Jhajjar | 71 | 78 | 84 | 91 | 99 | 110 | 121 |
| Jind | 68 | 75 | 82 | 89 | 97 | 106 | 117 |
| Kaithal | 59 | 66 | 73 | 80 | 87 | 96 | 104 |
| Karnal | 103 | 115 | 126 | 139 | 152 | 167 | 182 |
| Kurukshetra | 88 | 95 | 103 | 112 | 123 | 135 | 147 |
| Mahendragarh | 47 | 53 | 59 | 65 | 72 | 79 | 86 |
| Mewat (NUH) | 38 | 44 | 51 | 58 | 64 | 71 | 78 |
| Palwal | 76 | 84 | 93 | 102 | 113 | 124 | 136 |
| Panchkula | 55 | 62 | 70 | 78 | 86 | 94 | 103 |
| Panipat | 97 | 108 | 119 | 132 | 146 | 160 | 174 |
| Rewari | 63 | 70 | 78 | 86 | 94 | 103 | 112 |
| Rohtak | 108 | 119 | 131 | 144 | 158 | 172 | 188 |
| Sirsa | 94 | 104 | 115 | 127 | 139 | 152 | 165 |
| Sonipat | 115 | 127 | 140 | 154 | 169 | 185 | 201 |
| Yamunanagar | 79 | 88 | 97 | 107 | 118 | 130 | 142 |
| Nuh | 35 | 40 | 46 | 52 | 58 | 64 | 71 |
| TOTAL | 1847 | 2038 | 2246 | 2467 | 2717 | 2987 | 3166 |
Table text extracted from the original PDF; superscript letters are shown inline. The original table image is below.
View original table image
| Year | Male Victims | Female Victims | Female% | Rape Cases | Minor Victims | Total Cases |
|---|---|---|---|---|---|---|
| 2011 | 1214 | 633 | 34.3% | 112 | 28 | 1847 |
| 2013 | 1334 | 704 | 34.5% | 128 | 33 | 2038 |
| 2015 | 1462 | 784 | 34.9% | 148 | 39 | 2246 |
| 2017 | 1597 | 870 | 35.2% | 163 | 44 | 2467 |
| 2019 | 1751 | 966 | 35.5% | 183 | 51 | 2717 |
| 2021 | 1910 | 1077 | 36.1% | 206 | 58 | 2987 |
| 2023* | 2018 | 1148 | 36.3% | 214 | 62 | 3166 |
Table text extracted from the original PDF; superscript letters are shown inline. The original table image is below.
View original table image
References
22 in the original paper- Ambedkar BR. Annihilation of caste. Self-published; 1936. Reprinted by Verso Books; 2014.
- Bhat P, Sharma R. Pandemic, lockdown and the resurgence of caste violence: evidence from Haryana, 2019-2021. Economic and Political Weekly. 2022;57(18):32-41.
- Brantingham PJ, Brantingham PL. Patterns in crime. New York: Macmillan; 1984.
- Census of India. Primary census abstract: Scheduled Castes. New Delhi: Office of the Registrar General and Census Commissioner, Government of India; 2011.
- Clarke RV, Felson M. Routine activity and rational choice: advances in criminological theory. New Brunswick: Transaction Publishers; 1993.
- Deshpande A. The grammar of caste: economic discrimination in contemporary India. New Delhi: Oxford University Press; 2011.
- Gupta D. Interrogating caste: understanding hierarchy and difference in Indian society. New Delhi: Penguin Books; 2000.
- Haryana Economic Survey. Chandigarh: Economic and Statistical Adviser, Government of Haryana; 2023.
- Haryana Police. Annual crime reports. Panchkula: Haryana Police Headquarters; 2011-2023.
- Kumar V. India's roaring revolution: Dalit assertion and new horizons. New Delhi: Gagandeep Publications; 2013.
- Lok Sabha Secretariat. Atrocities against Scheduled Castes: data from National Crime Records Bureau. Annex to Unstarred Question No. 3650, 267th Session. New Delhi: Lok Sabha Secretariat; 2022.
- Malik S. Implementation of the SC/ST (Prevention of Atrocities) Act in Haryana: an appraisal. Journal of Social Justice Studies. 2020;12(2):45-68.
- Mitra A, Mitra S. Caste, identity and conflict: a study of Dalit violence in India. Economic and Political Weekly. 2011;46(8):44-52.
- National Crime Records Bureau. Crime in India. New Delhi: Ministry of Home Affairs, Government of India; 2011-2023.
- National Coalition for Strengthening SCs and STs (PoA) Act. Statement on NCRB Data 2021 [Internet]. 2022 [cited YYYY Mon DD]. Available from: www.ncspa.in
- Prasad KN. Socio-economic determinants of violence against Scheduled Castes: an econometric analysis. Indian Journal of Human Development. 2016;10(3):312-328.
- Rao M. Dalit politics and atrocities in Haryana: the JatDalit conflict paradigm. Economic and Political Weekly. 2014;49(31):18-25.
- Sherman LW, Gartin PR, Buerger ME. Hot spots of predatory crime: routine activities and the criminology of place. Criminology. 1989;27(1):27-55.
- Singh R, Kaur H. Spatial analysis of crimes against Scheduled Castes in Punjab and Haryana: a GIS-based approach. Geographic Review of India. 2017;79(1):2338.
- Thorat S, Kumar N, editors. In search of inclusive policy: addressing graded inequality. Jaipur: Rawat Publications; 2008.
- Venkateswarlu D. Crimes against Dalits in India: an analysis of NCRB data 2001-2010. Hyderabad: National Institute of Rural Development; 2013.
- Weisburd D. The law of crime concentration and the criminology of place. Criminology. 2015;53(2):133157.