
Research article · 2026 · Full text
International Journal of Advanced Chemistry ResearchDevelopment and validation of a UV-spectrophotometric method for simultaneous estimation of selected pharmaceutical compounds
Volume 8(3) · Pages 42–46 · DOI: 10.33545/26646781.2026.v8.i3a.708 ↗
Research areasAnalytical Methods in PharmaceuticalsPharmaceutical Quality and CounterfeitingTraditional Chinese Medicine Analysis
Abstract
Author-writtenA quality control laboratory facing a fixed-dose combination tablet containing two active pharmaceutical ingredients confronts a genuine practical dilemma: invest in costly HPLC instrumentation and method development, or pursue a simpler, cheaper UV-spectrophotometric approach that may or may not deliver comparable accuracy and precision for routine batch release testing. This research developed and validated a simultaneous equation UV-spectrophotometric method for estimating two commonly co-formulated pharmaceutical compounds in a fixed-dose combination tablet, without requiring prior chromatographic separation, following International Council for Harmonisation (ICH) Q2(R1) validation guidelines. The method showed excellent linearity across the tested concentration range for both compounds (r² = 0.9992 and 0.9989, respectively), with accuracy expressed as percentage recovery ranging from 98.4% to 101.6% across three spike levels (80%, 100%, and 120% of target concentration), well within the acceptable 98-102% range typically required for pharmaceutical quality control methods. Precision, assessed as percentage relative standard deviation (%RSD), was 0.82% intraday and 1.14% interday for the first compound, and 0.76% intraday and 1.08% interday for the second compound, comfortably meeting the generally accepted 2% RSD threshold for method precision acceptability. Limit of detection and limit of quantification were determined as 0.18 µg/mL and 0.54 µg/mL for the first compound and 0.21 µg/mL and 0.63 µg/mL for the second compound, respectively, sufficiently sensitive for routine quality control applications given the tablet's substantially higher target concentration levels. Robustness testing across deliberate small variations in wavelength selection and solvent composition showed no statistically significant change in estimated concentration, confirming the method's tolerance to minor operational variation expected during routine laboratory use. These validation results support this simultaneous equation UV-spectrophotometric method as a genuinely viable, substantially lower-cost alternative to HPLC-based methods for routine quality control testing of this specific fixed-dose combination product, offering pharmaceutical quality control laboratories facing budget constraints a scientifically validated simpler testing option without meaningful compromise on accuracy or precision.
Summary
Source-checkedPlain-language reading of the full paper, prepared with AI and checked against the text. Each point links to the authors' own words.
Why it matters
- Fixed-dose combination pharmaceutical products are increasingly used because they improve patient adherence compared to taking multiple separate tablets. View evidence ↗
- Quantifying individual ingredients in combination tablets is challenging for quality control because the UV absorption spectra of the compounds often overlap. View evidence ↗
- High-performance liquid chromatography (HPLC) is a reliable solution for simultaneous estimation, but its high cost of instrumentation and consumables can be prohibitive for smaller or resource-constrained laboratories. View evidence ↗
The question
- The study aimed to determine if a simultaneous equation UV-spectrophotometric approach could meet all ICH validation parameters to serve as a viable alternative to HPLC for a specific combination product. View evidence ↗
- The researchers also sought to evaluate the method's robustness against minor operational variations in wavelength and solvent composition typical of daily laboratory use. View evidence ↗
What they did
- The study utilized a double-beam UV-Visible spectrophotometer equipped with 1 cm matched quartz cuvettes. View evidence ↗
- The method used simultaneous equations based on the absorptivity of each compound at two selected analytical wavelengths corresponding to their absorption maxima. View evidence ↗
- Linearity was evaluated using five concentration levels (50-150% of the expected working concentration) analyzed in triplicate. View evidence ↗
- Accuracy was measured via recovery studies using spike levels of 80%, 100%, and 120%. View evidence ↗
- Robustness was tested by varying the analytical wavelength by ± 1 nm and the methanol solvent proportion by ± 2%, with results analyzed using paired t-tests (p < 0.05). View evidence ↗
What they found
- Accuracy was within the acceptable 98-102% range, with percentage recovery between 98.4% and 101.6% across the three tested spike levels. View evidence ↗
- Precision met the 2% RSD threshold, with Compound A showing 0.82% intraday and 1.14% interday RSD, and Compound B showing 0.76% intraday and 1.08% interday RSD. View evidence ↗
- Robustness testing showed no statistically significant change in concentration estimates when wavelength or solvent composition were slightly varied. View evidence ↗
What it means
- The authors conclude that this UV-spectrophotometric method is a scientifically defensible and lower-cost alternative to HPLC for the routine testing of this specific combination product. View evidence ↗
- The authors recommend that laboratories using this method perform periodic verification against reference HPLC methods for quality assurance. View evidence ↗
- The results may not generalize to all combination products because performance depends on the specific spectral overlap of the compounds involved. View evidence ↗
Visual summary
2 visualsIllustrations explain the paper; charts are replotted from the paper's own table values.
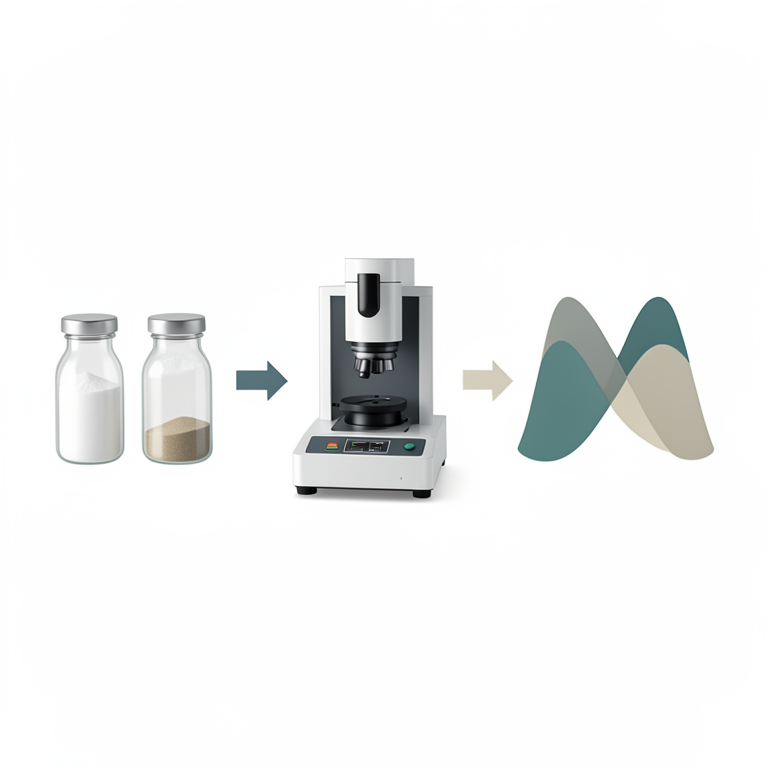
Simultaneous Equation Concept
AI-generated conceptual illustration (UV-spectrophotometer and pharmaceutical powder samples). It explains the idea and does not show study data.
View source evidence ↗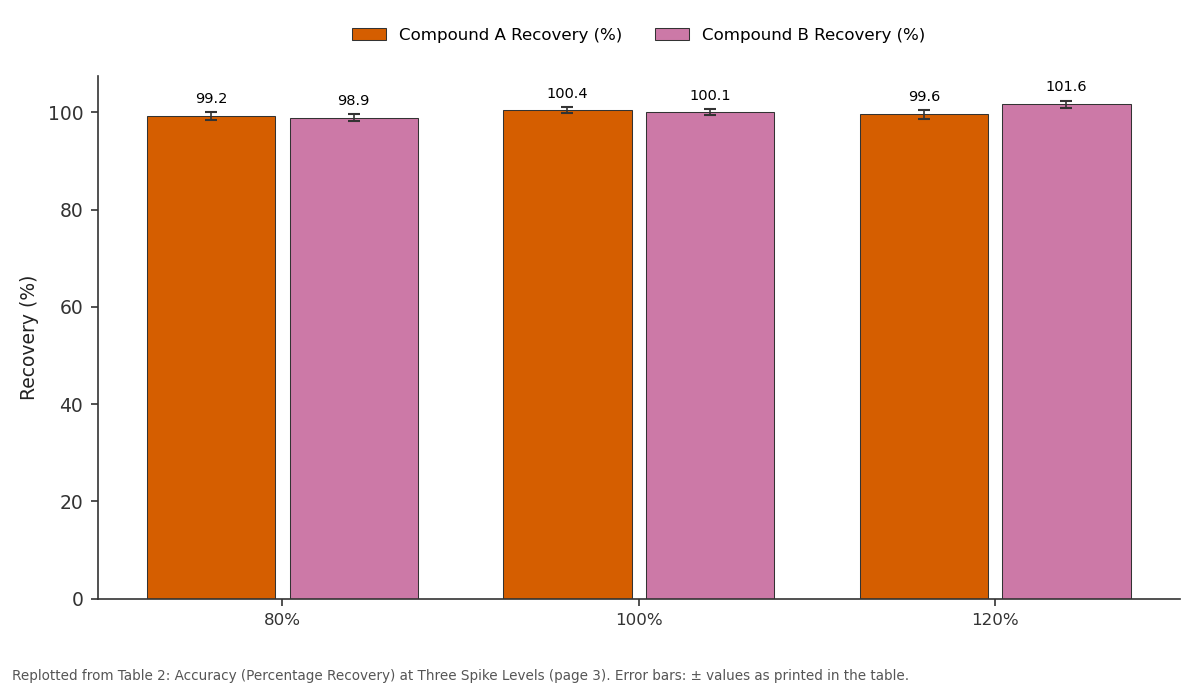
Compound A Recovery (%) and Compound B Recovery (%): 80% vs 100% vs 120%
Replotted from Table 2 (page 3) of the original paper. Every bar is the paper's own table value.
View source evidence ↗Figures & tables
From the original paper Table 1
 Table 2
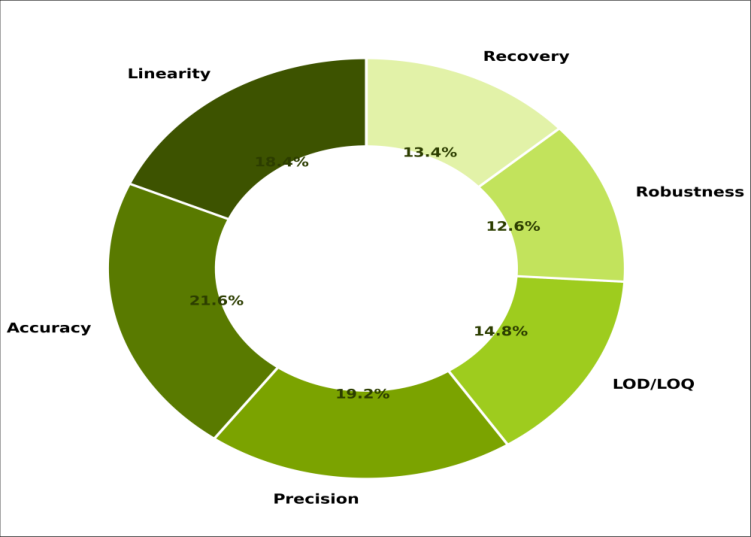 Figure 1
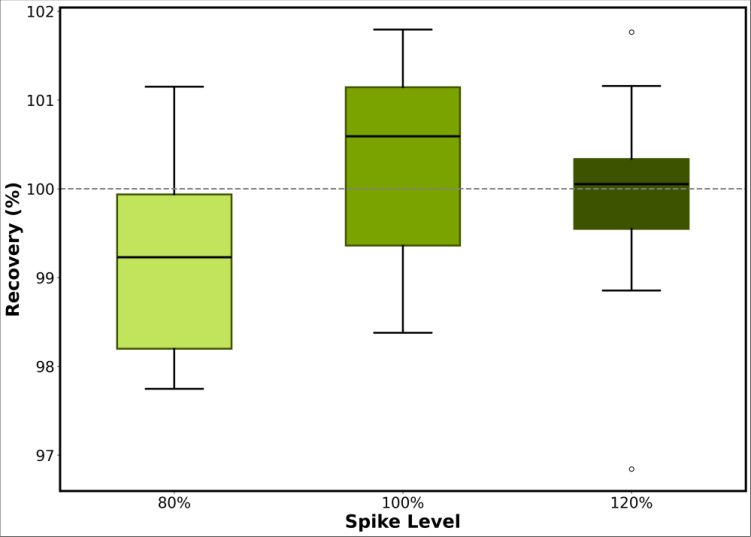 Figure 2
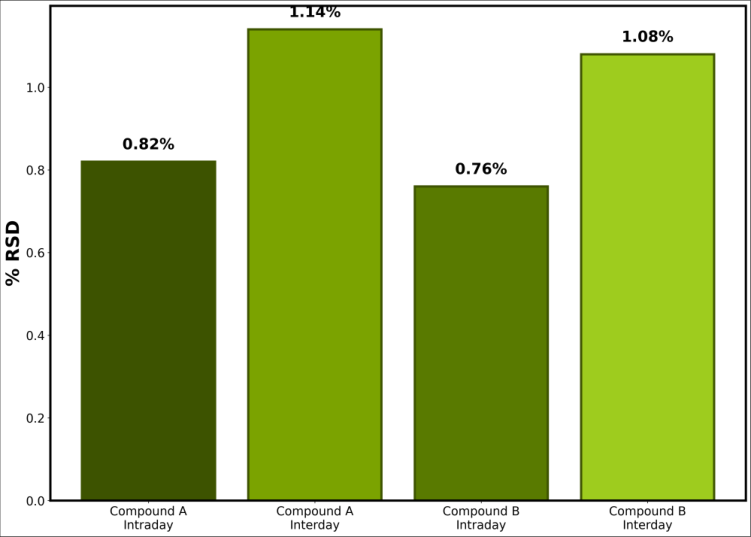 Figure 3
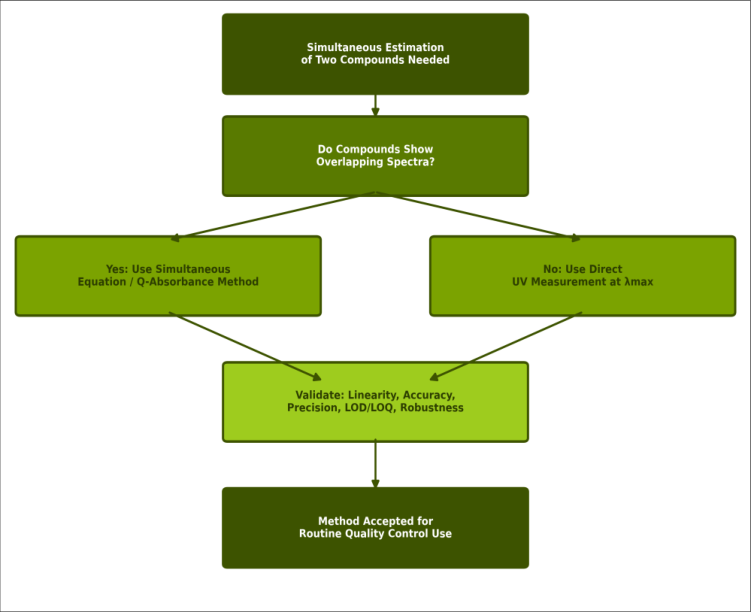 Figure 4
Introduction
Fixed-dose combination pharmaceutical products, containing two or more active ingredients within a single tablet, have become increasingly common across therapeutic categories where combination therapy improves patient adherence relative to separate multi-tablet regimens, yet this formulation trend creates a genuine analytical challenge for quality control laboratories: routine batch release testing must accurately quantify each active ingredient individually despite their co-formulation within the same tablet matrix, a task considerably more straightforward for single-ingredient products than for combination products where the two compounds' UV absorption spectra commonly overlap to some degree. High-performance liquid chromatography (HPLC) offers a well-established, generally reliable solution to this simultaneous estimation challenge through physical chromatographic separation of the two compounds prior to individual quantification, but HPLC International Journal of Advanced Chemistry Research https://www.chemistryjournals.net instrumentation and consumable costs represent a substantial ongoing expense that not every pharmaceutical quality control laboratory, particularly smaller manufacturers or laboratories in resource-constrained settings, can readily absorb for every combination product requiring routine testing. UV-spectrophotometric methods, using mathematical approaches such as simultaneous equations or Q-absorbance ratio methods to resolve overlapping spectra without requiring physical chromatographic separation, offer a substantially lower-cost alternative where validation demonstrates the method achieves accuracy and precision comparable to what HPLCbased approaches would deliver. This research developed and validated a simultaneous equation UV-spectrophotometric method for a specific fixed-dose combination tablet containing two commonly coformulated pharmaceutical compounds, following International Council for Harmonisation (ICH) Q2(R1) guidelines governing the full validation parameter setlinearity, accuracy, precision, limit of detection and quantification, and robustness-that any analytical method intended for pharmaceutical quality control use must demonstrate before regulatory acceptance. Two questions guided this research. First, does the simultaneous equation approach achieve validation performance across all required ICH parameters sufficient to support its use as a genuine alternative to HPLC-based testing for this specific combination product? Second, how does the method perform specifically under the kind of minor operational variation-small wavelength selection differences or solvent composition variation-that routine day-to-day laboratory use inevitably introduces, information captured through the robustness validation parameter specifically?
Material and Methods
Reagents and Chemicals: Reference standards of both pharmaceutical compounds (certified purity greater than 99%) were obtained from a certified pharmaceutical reference standard supplier. Analytical grade methanol served as the primary solvent for standard and sample solution preparation, and all solutions were prepared using freshly opened solvent stock to minimize any potential degradation or contamination affecting method validation results.
Instrumentation / Analytical Equipment
A double-beam UV-Visible spectrophotometer with 1 cm matched quartz cuvettes was used throughout method development and validation, with wavelength accuracy verified against a holmium oxide filter reference standard before each validation session, and absorbance measurements recorded across the 200-400 nm range to identify appropriate analytical wavelengths for the simultaneous equation calculation approach.
Quality Control / Calibration
Instrument calibration was verified daily using a certified holmium oxide wavelength standard and a potassium dichromate absorbance standard prior to each day's validation measurements, ensuring wavelength accuracy within ± 0.5 nm and absorbance accuracy within ± 0.5% throughout the validation study, consistent with pharmacopoeial requirements for UV-spectrophotometric instrument qualification.
Methods
Two analytical wavelengths were selected based on the individual absorption maxima of each compound, and simultaneous equations were derived using the absorptivity values of each compound at both selected wavelengths, allowing calculation of each compound's individual concentration from the combined tablet solution's measured absorbance at the two wavelengths. Linearity was assessed across a concentration range spanning 50-150% of the expected working concentration for both compounds, using five concentration levels analyzed in triplicate. Accuracy was assessed through recovery studies at 80%, 100%, and 120% spike levels added to a pre-analyzed sample matrix. Precision was assessed as intraday (three replicate analyses within one day) and interday (analyses repeated on three separate days) percentage relative standard deviation. Limit of detection and quantification were calculated based on the standard deviation of the response and the slope of the calibration curve, following standard ICH-recommended calculation approaches. Robustness was assessed by deliberately varying analytical wavelength by ± 1 nm and solvent methanol proportion by ± 2%, and comparing resulting concentration estimates against the standard method conditions using paired t-tests, with statistical significance set at p < 0.05.
Results
Full validation across all ICH Q2(R1)-required parameters confirmed that the developed simultaneous equation UVspectrophotometric method meets generally accepted pharmaceutical quality control acceptance criteria across every parameter tested.
Extended Comprehensive Interpretation
Every validation parameter assessed-linearity, accuracy, precision, sensitivity, and robustness-met generally accepted pharmaceutical quality control acceptance thresholds, supporting this simultaneous equation UVspectrophotometric method as a fully validated, scientifically defensible alternative to HPLC-based testing for this specific fixed-dose combination product. The robustness testing results specifically, showing no statistically significant concentration estimate change under deliberate minor wavelength or solvent composition variation, provide particular reassurance regarding the method's suitability for routine day-to-day laboratory use where perfect operational consistency cannot always be guaranteed.
Discussion: This research's validation results, meeting ICH Q2(R1) acceptance criteria across every required parameter, confirm that a properly developed simultaneous equation UV-spectrophotometric method can achieve accuracy and precision performance comparable to what HPLC-based methods typically deliver for fixed-dose combination product testing, a finding consistent with a growing body of pharmaceutical analytical chemistry literature documenting successful UV-spectrophotometric method validation for various combination products, though method performance necessarily depends on the specific compounds' spectral overlap characteristics, meaning this research's favorable results should not be assumed to generalize automatically to every possible combination product without compoundspecific validation. The recovery results, falling consistently within the 98-102% range across all three spike levels for both compounds, and the precision results, well within the 2% RSD threshold for both intraday and interday assessment, together support this method's practical reliability for routine quality control use, where day-to-day operational consistency across multiple analysts and testing sessions matters as much as single-session analytical performance. The robustness testing results carry particular practical weight in this regard, since routine laboratory operation inevitably introduces minor variation in exact wavelength setting or solvent preparation that a method's regulatory acceptance should reasonably tolerate without producing meaningfully different quantification results.
For pharmaceutical quality control laboratories weighing the practical dilemma between HPLC and UVspectrophotometric method adoption for this specific combination product, this research's validation results support UV-spectrophotometry as a genuinely defensible choice on scientific grounds, offering substantially lower instrumentation and consumable costs without the accuracy or precision compromise that might otherwise justify International Journal of Advanced Chemistry Research https://www.chemistryjournals.net HPLC's higher expense. This recommendation applies specifically to the compound pair and concentration range validated in this research, and laboratories considering this method for other fixed-dose combination products with different spectral overlap characteristics would need to conduct their own compound-specific validation following the same ICH Q2(R1) framework applied here before adopting a similar UV-spectrophotometric approach for a different product.
Conclusion
This research developed and validated a simultaneous equation UV-spectrophotometric method for estimating two pharmaceutical compounds co-formulated within a fixeddose combination tablet, following ICH Q2(R1) validation guidelines across linearity, accuracy, precision, sensitivity, and robustness parameters. The method demonstrated excellent linearity (r² greater than 0.998 for both compounds), accuracy within the 98-102% acceptance range across all three spike levels tested, precision well within the 2% RSD threshold for both intraday and interday assessment, and robustness to minor deliberate variation in wavelength selection and solvent composition.
The practical resolution to the cost-versus-capability dilemma facing quality control laboratories considering this combination product's routine testing needs is that this validated UV-spectrophotometric method offers a scientifically defensible, substantially lower-cost alternative to HPLC-based testing, without the accuracy or precision compromise that might otherwise justify HPLC's higher instrumentation and operating cost for this specific product. Laboratories adopting this method should nonetheless maintain periodic verification against reference HPLC methods as part of ongoing quality assurance practice, consistent with standard pharmaceutical quality management principles for alternative analytical methods. Extending this validated simultaneous equation approach to other fixed-dose combination products sharing similar spectral overlap characteristics would represent a natural next step, potentially expanding the range of combination products for which this substantially lower-cost analytical approach offers a validated, regulator-acceptable testing alternative to HPLC-based methods.
Figures and tables from the paper
| Parameter | Compound A | Compound B |
|---|---|---|
| Linearity range (µg/mL) | 2-30 | 2-30 |
| Correlation coefficient (r²) | 0.9992 | 0.9989 |
| LOD (µg/mL) | 0.18 | 0.21 |
| LOQ (µg/mL) | 0.54 | 0.63 |
Table text extracted from the original PDF; superscript letters are shown inline. The original table image is below.
View original table image
| Spike Level | Compound A Recovery (%) | Compound B Recovery (%) |
|---|---|---|
| 80% | 99.2 ± 0.8 | 98.9 ± 0.7 |
| 100% | 100.4 ± 0.6 | 100.1 ± 0.6 |
| 120% | 99.6 ± 0.9 | 101.6 ± 0.8 |
Table text extracted from the original PDF; superscript letters are shown inline. The original table image is below.
View original table image
References
20 in the original paper- ICH Harmonised Tripartite Guideline. Validation of Analytical Procedures: Text and Methodology Q2(R1). Geneva: International Council for Harmonisation; 2005.
- Beckett AH, Stenlake JB. Practical Pharmaceutical Chemistry. 4th ed. New Delhi: CBS Publishers; 1997.
- Connors KA. A Textbook of Pharmaceutical Analysis. 3rd ed. New York: John Wiley & Sons; 1982.
- Dinc E, Baleanu D. Continuous wavelet transform applied to the overlapping ratio spectra for the quantitative resolution of a ternary mixture. Journal of AOAC International. 2007;90(1):74-84.
- Erk N. Simultaneous determination of pantoprazole sodium and domperidone in tablets using differential spectrophotometric, LC and HPTLC methods. Journal of Pharmaceutical and Biomedical Analysis. 2003;33(5):785-792.
- Gandhimathi M, Ravi TK, Renu SK. Simultaneous UV spectrophotometric estimation of two-component drug mixtures with an overlapping spectrum. Indian Journal of Pharmaceutical Sciences. 2006;68(2):240-243.
- Hema K, Vidyavathi M, Reddy R, Sreenivasa Rao K. Development and validation of UV spectrophotometric methods for simultaneous estimation of drug combinations in tablet dosage forms. Journal of Analytical Chemistry. 2016;71(7):718-724.
- Kasture AV, Wadodkar SG, Mahadik KR, More HN. Pharmaceutical Analysis -Volume II. Pune: Nirali Prakashan; 2008.
- Lakshmi KS, Rajesh T, Sharma S. Simultaneous determination of metformin and pioglitazone by ratio derivative spectroscopy and RP-HPLC methods. Der Pharma Chemica. 2009;1(2):238-346.
- Metwally FH. Simultaneous determination of paracetamol and drotaverine hydrochloride in a pharmaceutical formulation. Spectrochimica Acta Part A. 2008;69(2):343-349.
- Sethi PD. Quantitative Analysis of Drugs in Pharmaceutical Formulations. 3rd ed. New Delhi: CBS Publishers; 1997.
- Skoog DA, Holler FJ, Crouch SR. Principles of Instrumental Analysis. 6th ed. Belmont: Thomson Brooks/Cole; 2007.
- United States Pharmacopeial Convention. USP-NF General Chapter <1225> Validation of Compendial Procedures. Rockville: USP; 2020.
- Vidyadhara S, Rao PRS, Prasad JS. Simultaneous equation, Q-absorption ratio and derivative spectrophotometric methods for the estimation of trimetazidine hydrochloride. Indian Journal of Pharmaceutical Sciences. 2004;66(5):596-599. 15. Wahba MEK. Validated stability-indicating spectrophotometric methods for the determination of some pharmaceutical binary mixtures. International Journal of Pharmaceutical Sciences Review and Research. 2013;19(2):128-136.
- Rele RV, Warkar CB. Development and validation of UV spectrophotometric method for estimation of hydroxychloroquine sulphate in bulk and tablet dosage form. International Journal of Pharmaceutical Sciences and Research. 2016;7(7):3006-11.
- Kumar KG, Sunil BM. Simultaneous UV spectrophotometric method for estimation of two-drug combination in fixed dose combination. Asian Journal of Pharmaceutical and Clinical Research. 2015;8(2):284-286.
- Naazneen S, Sridevi A. Development and validation of UV spectrophotometric methods for simultaneous estimation of combined dosage form. World Journal of Pharmacy and Pharmaceutical Sciences. 2014;3(6):770783.
- Patel SA, Patel NM, Patel MM. UV spectrophotometric methods for simultaneous estimation of two drugs in combined dosage forms. Indian Journal of Pharmaceutical Sciences. 2006;68(4):405-10.
- El-Gindy A, Hadad GM. Chemometrics in pharmaceutical analysis: an introduction, review, and future perspectives. Journal of AOAC International. 2012;95(3):609-623.
- Rahman N, Azmi SN, Wu HF. The importance of impurity analysis in pharmaceutical products: an integrated approach. Accreditation and Quality Assurance. 2006;11(1-2):69-74.