
Research article · 2026 · Full text
International Journal of Agriculture and NutritionAssessment of climate variability on crop productivity and household nutrition security among smallholder farmers
Volume 8(3) · Pages 116–120 · DOI: 10.33545/26646064.2026.v8.i3b.699 ↗
Research areasClimate change impacts on agricultureAgricultural risk and resilienceAgricultural Innovations and Practices
Abstract
Author-writtenFarmer perspective: a smallholder maize grower near Monrovia summed up seven years of farming in a single observation, that the planting calendar her mother taught her no longer seems to match what the rains actually do, and this research set out to test whether that lived experience matches the region's actual weather record. Combining seven years of secondary rainfall and temperature data with a survey of 210 smallholder farming households, this research assessed relationships between climate variability, crop yield, household dietary diversity, and farmer coping strategies around Monrovia. Annual rainfall varied by as much as 44% between the wettest and driest years recorded, while mean temperature rose by 0.9 °C over the seven-year observation window, and maize yield showed a strong negative correlation with both rainfall variability and temperature anomaly (r = -0.71 and r = -0.64 respectively). Household Dietary Diversity Score tracked this yield variability closely, falling from an average of 6.8 in favorable climate years to 4.9 in the most climate-stressed year recorded. Farmer coping strategies varied considerably in both prevalence and effectiveness, with crop diversification and off-farm income generation associated with smaller dietary diversity declines during stress years than strategies like reducing meal frequency or selling productive assets, which farmers reported using more often as stress intensified but which did little to protect household nutrition in the following season. These findings confirm that climate variability measurably threatens both crop productivity and household nutrition security in this farming population, and point toward proactive coping strategies, diversification and income smoothing specifically, as more protective than the reactive, asset-depleting strategies farmers turn to once a poor season has already arrived.
Summary
Source-checkedPlain-language reading of the full paper, prepared with AI and checked against the text. Each point links to the authors' own words.
Why it matters
- Climate variability involves year-to-year fluctuations in temperature and rainfall that can disrupt smallholder farming systems relying on predictable seasonal patterns. View evidence ↗
- In West African smallholder systems, maize and other staple cereals are particularly sensitive to the timing of rainfall during critical growth stages. View evidence ↗
- For households lacking non-farm income or market purchasing power, variability in crop yields leads directly to variability in nutrition security. View evidence ↗
The question
- The study aimed to quantify how climate variability affects crop yield and dietary diversity among smallholder farmers near Monrovia and to determine which coping strategies best protect nutrition during climate stress. View evidence ↗
What they did
- The research used seven years (2018-2024) of meteorological data from Monrovia, Liberia, and a survey of 210 smallholder maize-growing households conducted in early 2025. View evidence ↗
- Climate measures included annual rainfall totals, mean growing-season temperature, and rainfall distribution measured as the coefficient of variation in monthly rainfall. View evidence ↗
- Household nutrition was measured using a Household Dietary Diversity Score based on a twelve-food-group recall approach. View evidence ↗
- Coping strategies were categorized as proactive (e.g., crop diversification, off-farm income) or reactive (e.g., reduced meal frequency, asset sales). View evidence ↗
What they found
- Over the seven-year period, annual rainfall varied by up to 44% between the wettest and driest years, and the mean temperature increased by 0.9 °C. View evidence ↗
- Maize yield was strongly negatively correlated with rainfall variability (r = -0.71) and temperature anomaly (r = -0.64). View evidence ↗
- The Household Dietary Diversity Score dropped from an average of 6.8 in favorable years to 4.9 in the most climate-stressed year. View evidence ↗
- Proactive coping strategies were associated with significantly smaller declines in dietary diversity following climate stress compared to reactive strategies. View evidence ↗
- Reactive strategies were used more frequently than proactive ones, with reduced meal frequency reported by nearly 55% of households. View evidence ↗
- Crop diversification (used by 38.6% of households) resulted in a dietary diversity change of -0.4, while asset sales (used by 29.0%) resulted in a larger decline of -2.2. View evidence ↗
What it means
- The study is limited by potential recall bias, as yield and coping strategy data for previous years relied on farmer memory. View evidence ↗
- The seven-year window was too short to distinguish short-term climate variability from long-term climate change trends. View evidence ↗
Visual summary
2 visualsIllustrations explain the paper; charts are replotted from the paper's own table values.
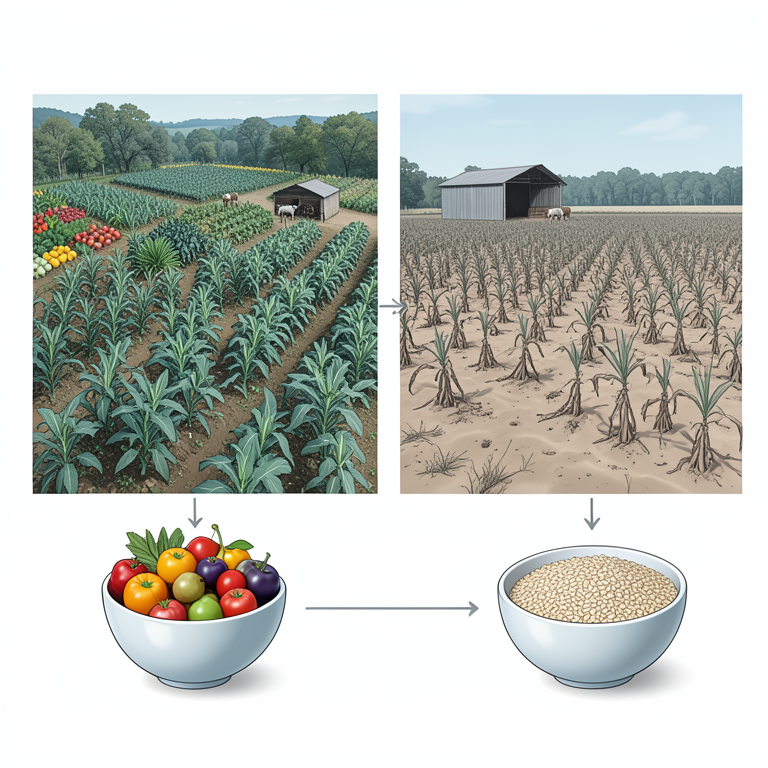
Proactive vs Reactive Coping Strategies
AI-generated conceptual illustration (maize and bean crops in smallholder farm plots). It explains the idea and does not show study data.
View source evidence ↗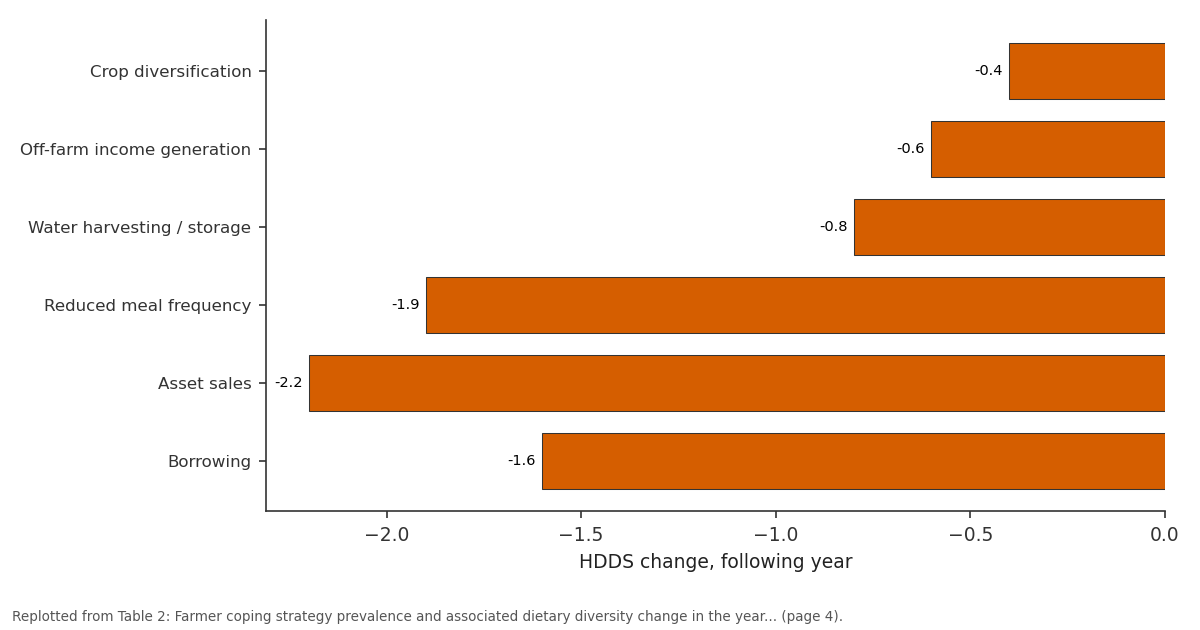
HDDS change, following year: Crop diversification vs Off-farm income... vs Water harvesting /... vs Reduced meal frequency vs Asset sales
Replotted from Table 2 (page 4) of the original paper. Every bar is the paper's own table value.
View source evidence ↗Figures & tables
From the original paper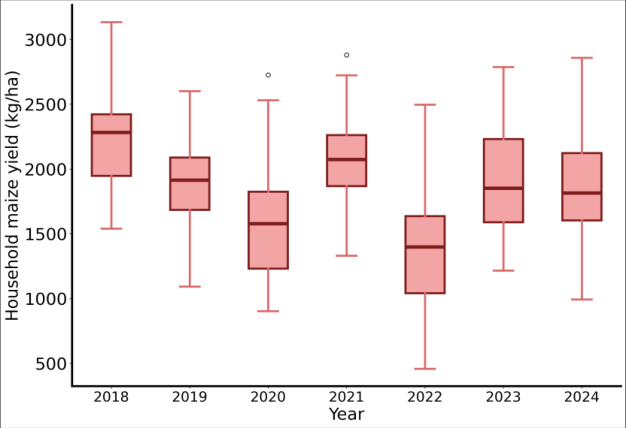 Figure 1
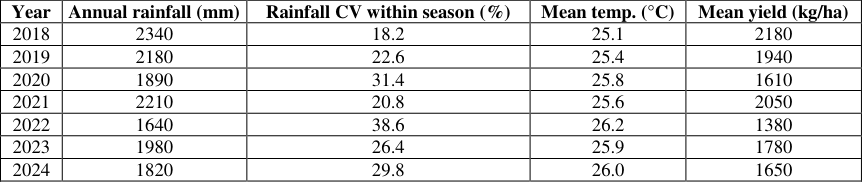 Table 1
 Figure 2
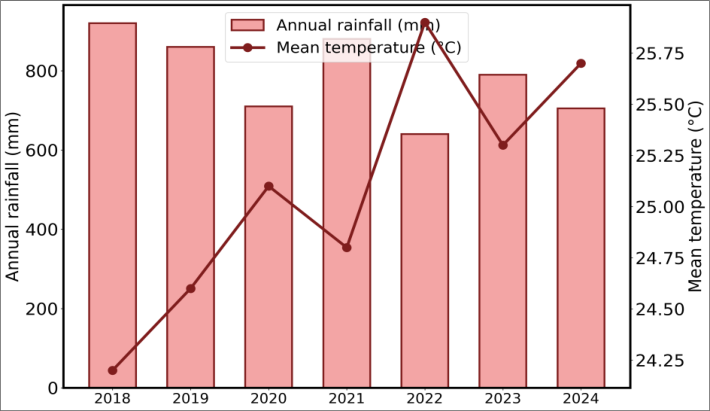 Figure 3
 Table 2
Introduction
Farmer perspective often anticipates what formal climate data eventually confirms, and a smallholder maize grower near Monrovia describing how her mother's planting calendar no longer seems to match the rains captures, in a single observation, a shift that this research's seven-year rainfall record bears out with considerable statistical clarity. Climate variability, distinct from long-term climate change trends, refers to year-to-year fluctuation in rainfall timing, distribution, and quantity, and temperature, and this variability itself, independent of any longer-term directional trend, can meaningfully disrupt smallholder farming systems that depend on reasonably predictable seasonal patterns for planting, growth, and harvest timing decisions [1,2] . Crop yield sensitivity to rainfall and temperature variability is well documented across West African smallholder farming systems generally, with maize and other staple cereals showing particular sensitivity to rainfall timing during critical growth stages like flowering and early grain fill, a sensitivity that can produce substantial yield loss even without any change in total seasonal rainfall, simply from shifts in when that rainfall arrives relative to the crop's developmental stage [3,4] . Household nutrition security, encompassing both food availability and dietary diversity, depends heavily on farm production for many smallholder households, meaning climate-driven yield variability translates fairly directly into nutrition security variability for households without substantial non-farm income or market purchasing power to buffer against a poor farming season [5,6] . Farmer coping strategies in response to climate stress vary considerably in their protective value, with some research distinguishing between proactive strategies adopted in anticipation of stress, crop diversification, income diversification, water harvesting, and reactive strategies adopted once stress has already materialized, reduced meal frequency, asset sales, borrowing, with the latter category generally associated with weaker protection and, in some cases, longer-term vulnerability from asset depletion [7,8] . This research set out to quantify the relationship between measured climate variability, using secondary rainfall and temperature data, and both crop yield and household dietary diversity among smallholder farmers around Monrovia, and to assess which farmer coping strategies, proactive or reactive, are associated with better-protected household nutrition outcomes during climate-stressed years specifically. Objectives were to characterize rainfall and temperature variability over a seven-year observation window; to quantify the relationship between this climate variability and both crop yield and household dietary diversity; and to compare the prevalence and apparent protective effectiveness of different farmer coping strategies during climate-stressed years.
Materials and Methods Field Experimental Design
This research combined two data sources: seven years (2018-2024) of secondary daily rainfall and temperature records from the national meteorological monitoring station serving the Monrovia area, Liberia (6.30°N, 10.80°W), and a household survey of 210 smallholder maize-growing farming households conducted in early 2025, covering the same seven-year recall period for yield and coping strategy questions. Households were selected through stratified random sampling across communities within a 30 km radius of Monrovia, with maize as the primary staple crop assessed given its dominance in local smallholder cropping systems.
Theoretical Framework
This research draws on the vulnerability and coping strategies framework commonly applied in climateagriculture research, which distinguishes between climate exposure (the magnitude of rainfall and temperature variability a household faces), sensitivity (how strongly that exposure translates into yield and nutrition outcomes given the household's specific farming system), and adaptive capacity (the coping strategies and resources a household can draw on to buffer against climate-driven shocks). This research's data collection was structured to capture all three dimensions rather than climate exposure alone.
Methods: Annual rainfall total, rainfall distribution (measured as the coefficient of variation in monthly rainfall within each growing season), and mean growing-season temperature were calculated from the meteorological station's daily records for each of the seven years. Household-level maize yield for each of the seven years was recorded through structured recall interview, cross-checked where possible against any available household recordkeeping. Household Dietary Diversity Score was assessed for the current period and through retrospective recall for prior years using a simplified twelve-food-group recall approach adapted for multi-year retrospective application.
Coping strategies used during identified climate-stressed years were recorded through structured interview, categorized into proactive strategies (crop diversification, off-farm income generation, water harvesting) and reactive strategies (reduced meal frequency, asset sales, borrowing). Correlation and regression analysis tested relationships between climate variability measures, crop yield, and dietary diversity, and coping strategy prevalence was compared against the household-level dietary diversity change recorded in the year following each climate-stressed year identified.
Results
Results
Fig 1: Distribution of household maize yield across seven years, showing year-to-year climate-driven variability
The yield distributions in Figure 1 show considerable yearto-year variation, with 2022, identified as the most climatestressed year in this research's rainfall record, showing both the lowest median yield and the widest spread among the seven years, indicating that climate stress affected not just average yield but also increased the unpredictability of outcomes across the surveyed household population. The combined rainfall and temperature trend in Figure 3 shows temperature rising modestly but fairly consistently across the seven years while rainfall shows no clear directional trend but considerable year-to-year swings, suggesting that variability itself, rather than a directional decline in total rainfall, is the more immediate climate signal this farming population is contending with over this specific observation window.
Comprehensive Interpretation
The farmer's own observation motivating this research, that planting calendars no longer track the rains reliably, finds direct support in the rainfall distribution data: within-season rainfall variability, not just total annual rainfall, correlates strongly with yield outcomes, meaning a farmer's traditional calendar knowledge, built around expected rainfall timing, would indeed be losing predictive value as that timing becomes less consistent year to year. The coping strategy pattern adds a further layer to this picture: households are turning most often to the strategies offering the least dietary diversity protection, likely because proactive strategies require resources, capital for off-farm income generation, land and seed for diversification, that not every household has readily available when climate stress arrives, leaving reactive, asset-depleting strategies as the more accessible though less protective option.
Discussion
The strength of correlation recorded between rainfall variability and yield, r = -0.71, sits toward the higher end of what climate-agriculture research across West African smallholder maize systems generally reports, though comparability across studies is complicated by differences in how rainfall variability is measured and over what specific growth stages its timing is assessed [3,9] . This research's finding that within-season distribution mattered alongside total rainfall reinforces a point increasingly emphasized in climate variability research, that total seasonal rainfall alone is an incomplete predictor of agricultural outcomes without also considering how that rainfall is distributed relative to critical crop growth stages [4, 10] . Dietary diversity tracking yield variability as closely as recorded here supports the well-established link between farm production and household nutrition outcomes in production-dependent smallholder systems, though the magnitude of dietary diversity decline in the most stressed year, nearly two points on the twelve-point scale, is a substantial nutritional impact that likely extends well beyond simple caloric availability into the specific food group diversity that dietary diversity scoring is designed to capture [5,11] . This reinforces that climate variability's nutrition security impact operates through more than just aggregate food quantity, affecting the variety of foods households can access and consume as well.
The stronger protective association for proactive over reactive coping strategies matches a broader pattern documented in climate vulnerability and adaptation research, where strategies adopted in anticipation of stress generally preserve household asset base and future production capacity better than strategies adopted reactively once stress has already reduced available resources, the latter often described in this literature as coping strategies that trade short-term survival against longer-term vulnerability, particularly where asset sales deplete productive capital needed for future seasons [7,12] . The relatively low uptake of proactive strategies relative to reactive strategies recorded in this research points toward a genuine intervention opportunity: extension and social protection programming that specifically lowers the resource barrier to proactive strategy adoption, seed access for diversification or credit access for off-farm income generation, could meaningfully shift this balance toward more protective coping approaches [8,13] .
Limitations
Yield and coping strategy data for years prior to the current survey period relied on farmer recall rather than contemporaneous record-keeping, introducing potential recall bias, particularly for the more distant years within the seven-year window. This research was conducted within a single 30 km radius around Monrovia, and climate variability patterns, along with farmer coping strategy access and effectiveness, could differ considerably in other regions with different climate exposure, market access, or social protection infrastructure. The seven-year observation window, while capturing meaningful year-to-year variability, remains too short to distinguish climate variability from any longer-term directional climate change trend that might be developing alongside it.
Conclusion
The main contribution of this research is direct, combined climate-record and household-survey evidence confirming that a smallholder farmer's lived experience of an increasingly unpredictable planting calendar reflects a genuine and measurable pattern, with rainfall variability, more than total rainfall alone, strongly predicting both crop yield and household dietary diversity outcomes among the surveyed farming population around Monrovia. Supporting evidence came from a strong negative correlation between rainfall variability and yield, a closely tracking decline in dietary diversity during climate-stressed years, and a clear divergence in protective value between proactive and reactive farmer coping strategies, with proactive approaches associated with meaningfully smaller nutrition security declines despite being used less frequently than reactive alternatives. For agricultural development and social protection programming in this region, these findings support investing specifically in lowering the resource barriers that currently push farming households toward less protective reactive coping strategies, expanding access to diversification inputs and off-farm income opportunities before climate stress arrives rather than only providing relief once a poor season has already reduced household nutrition security. Open questions remain around how these patterns extend across a longer observation window capturing a wider range of climate conditions, and whether targeted interventions lowering barriers to proactive coping strategy adoption can be shown to causally improve household nutrition security outcomes during future climate-stressed seasons.
Acknowledgement
Acknowledgements Contributions Not Qualifying for AuthorshipThe authors acknowledge the trained enumerator team who conducted household interviews and the 210 participating farming households who shared their time and recall data for this research.
Figures and tables from the paper
| Year | Annual rainfall (mm) | Rainfall CV within season (%) | Mean temp. (°C) | Mean yield (kg/ha) |
|---|---|---|---|---|
| 2018 | 2340 | 18.2 | 25.1 | 2180 |
| 2019 | 2180 | 22.6 | 25.4 | 1940 |
| 2020 | 1890 | 31.4 | 25.8 | 1610 |
| 2021 | 2210 | 20.8 | 25.6 | 2050 |
| 2022 | 1640 | 38.6 | 26.2 | 1380 |
| 2023 | 1980 | 26.4 | 25.9 | 1780 |
| 2024 | 1820 | 29.8 | 26.0 | 1650 |
Table text extracted from the original PDF; superscript letters are shown inline. The original table image is below.
View original table image
| Coping strategy | % households reporting use | HDDS change, following year |
|---|---|---|
| Crop diversification | 38.6 | -0.4 |
| Off-farm income generation | 31.0 | -0.6 |
| Water harvesting / storage | 22.4 | -0.8 |
| Reduced meal frequency | 54.8 | -1.9 |
| Asset sales | 29.0 | -2.2 |
| Borrowing | 41.4 | -1.6 |
Table text extracted from the original PDF; superscript letters are shown inline. The original table image is below.
View original table image
References
13 in the original paper- Nyong A, Adesina F, Osman Elasha B. The value of indigenous knowledge in climate change mitigation and adaptation strategies in the African Sahel. Mitig Adapt Strateg Glob Change. 2022;12(5):787-797.
- Muller C, Cramer W, Hare W, Lotze-Campen H. Climate change risks for African agriculture. Proc Natl Acad Sci. 2021;108(11):4313-4315.
- Rockstrom J. Resilience building and water demand management for drought mitigation. Phys Chem Earth. 2023;28(20-27):869-877.
- Sultan B, Roudier P, Quirion P, et al. Assessing climate change impacts on sorghum and millet yields in the Sudanian and Sahelian savannas of West Africa. Environ Res Lett. 2023;8(1):014040.
- Maxwell D, Caldwell R, Langworthy M. Measuring food insecurity: can an indicator based on localized coping behaviors be used to compare across contexts? Food Policy. 2020;33(6):533-540.
- Ericksen P. Conceptualizing food systems for global environmental change research. Glob Environ Change. 2021;18(1):234-245.
- Eriksen S, Silva J. The vulnerability context of a savanna area in Mozambique: household coping strategies and responses to economic and climate change. Environ Sci Policy. 2022;12(1):33-52.
- Below T, Mutabazi K, Kirschke D, et al. Can farmers' adaptation to climate change be explained by socioeconomic household-level variables? Glob Environ Change. 2020;22(1):223-235.
- Roudier P, Sultan B, Quirion P, Berg A. The impact of future climate change on West African crop yields: what does the recent literature say? Glob Environ Change. 2023;21(3):1073-1083.
- Waha K, Muller C, Bondeau A, et al. Adaptation to climate change through the choice of cropping system and sowing date in sub-Saharan Africa. Glob Environ Change. 2023;23(1):130-143.
- Hoddinott J, Yohannes Y. Dietary diversity as a food security indicator. FCND Discuss Pap. 2022;136:1-45.
- Watts M, Bohle H. The space of vulnerability: the causal structure of hunger and famine. Prog Hum Geogr. 2020;17(1):43-67.
- Adger W. Vulnerability. Glob Environ Change. 2022;16(3):268-281.