
Research article · 2026 · Full text
International Journal of Geography Geology and EnvironmentBlueprint for security and development: A four-layer geospatial intelligence framework for sustainable governance in the naxal-affected bastar Region, India
Volume 8(7) · Pages 118–130 · DOI: 10.22271/27067483.2026.v8.i7b.812 ↗
Research areasSouth Asian Studies and ConflictsRemote Sensing and Land UseEnvironmental and Biological Research in Conflict Zones
Abstract
Author-writtenThe Naxal-affected Bastar region of Chhattisgarh, India, represents one of the most complex geopolitical landscapes where immense natural resource wealth coexists with extreme underdevelopment and persistent insurgency. This study addresses the critical 'data vacuum' in this inaccessible conflict zone by designing, implementing and validating a comprehensive Four-Layer Geospatial Intelligence (GEOINT) Framework. Layer 1 constructs a canopy-compensated digital twin through multi-sensor data fusion (Sentinel-1 SAR, Sentinel-2 optical, ALOS PALSAR DEM), producing a high-precision Land Use/Land Cover classification and terrain model. Layer 2 maps the previously 'unmapped' human terrain through systematic grid-based manual digitization of over 1,200 settlements, coupled with Night-Time Lights analysis for electrification proxy assessment. Layer 3 quantifies the 'tyranny of distance' through a weighted friction surface model of infrastructure accessibility, revealing critical healthcare connectivity gaps. Layer 4 synthesizes all preceding layers into predictive models: a Security Risk Surface and a Development Suitability Model, integrated via a 2x2 Policy Matrix classifying the landscape into Golden Zones, Contested Zones, Stable Zones and No-Go Zones. Statistical validation using geolocated conflict incident data (2015-2024) confirms significant correlation (p<0.05) between modeled high-risk zones and actual insurgent activity. The framework demonstrates that security and development in Bastar constitute a coupled socio-spatial system where geographic isolation, forest density and governance deficits are mutually reinforcing. This research provides a replicable, open-source methodology for integrated conflict-development analysis using exclusively unclassified geospatial data, applicable to other inaccessible conflict-affected regions globally.
Summary
Source-checkedPlain-language reading of the full paper, prepared with AI and checked against the text. Each point links to the authors' own words.
Why it matters
- The Bastar region in India is a complex area where significant natural resources exist alongside extreme underdevelopment and ongoing Naxal insurgency. View evidence ↗
- A 'data vacuum' exists in Bastar due to the insurgency, leading to outdated maps and fragmented data, which hinders effective planning and resource allocation. View evidence ↗
- The insurgency has negatively affected essential services in the region, including healthcare, education, and economic mobility. View evidence ↗
The question
- The study aims to create and validate an open-source, four-layer geospatial framework to address the region's isolation, insurgency, and underdevelopment. View evidence ↗
What they did
- The first layer uses a fusion of Sentinel-1 SAR, Sentinel-2 optical, and ALOS PALSAR DEM data to create a high-precision land use/land cover classification and terrain model. View evidence ↗
- The second layer involves the manual digitization of over 1,200 settlements and the use of Night-Time Lights data to assess electrification. View evidence ↗
- The third layer employs a weighted friction surface model to measure infrastructure accessibility and identify gaps in healthcare connectivity. View evidence ↗
- The final layer integrates the previous data into a Security Risk Surface and a Development Suitability Model, categorized by a 2x2 Policy Matrix. View evidence ↗
What they found
- The study identified over 1,200 settlements that were previously unmapped or incorrectly located, highlighting a significant gap in official government records. View evidence ↗
- Settlements without electricity ('dark settlements') are primarily found in dense forests and rugged areas, which strongly correlate with insurgent influence. View evidence ↗
- High-security risk zones are strongly correlated with dense forests, remote settlements, and poor infrastructure, serving as operational areas for insurgents. View evidence ↗
- Validation using conflict data from 2015-2024 showed a statistically significant correlation (p<0.05) between the modeled high-risk zones and actual insurgent activity. View evidence ↗
- The Development Suitability Model determined that 21% of the region's landscape is highly suitable for infrastructure development. View evidence ↗
What it means
- The authors conclude that security and development in Bastar are linked in a system where forest density, geographic isolation, and governance failures reinforce each other. View evidence ↗
- The study provides a replicable, open-source method for analyzing conflict and development using unclassified data, which can be applied to other conflict zones worldwide. View evidence ↗
- Security constraints prevented physical ground-truthing, introducing uncertainty into the land use/land cover classification. View evidence ↗
- The study relied on 2011 Census data, which is significantly outdated and does not capture recent population dynamics or conflict-driven displacement. View evidence ↗
Visual summary
3 visualsIllustrations explain the paper; charts are replotted from the paper's own table values.
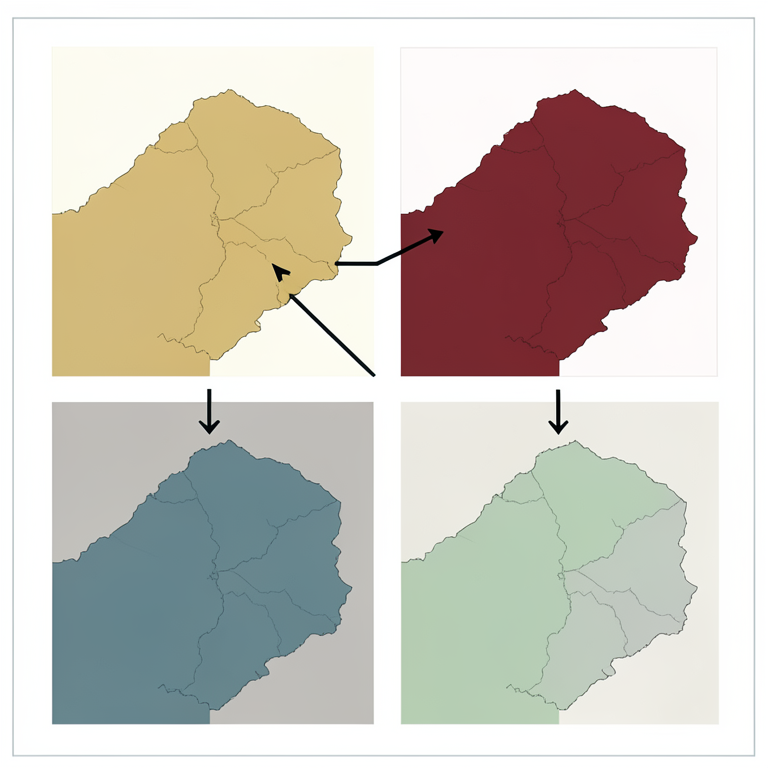
The 2x2 Policy Matrix Concept
AI-generated conceptual illustration (A topographic map of the Bastar region in India). It explains the idea and does not show study data.
View source evidence ↗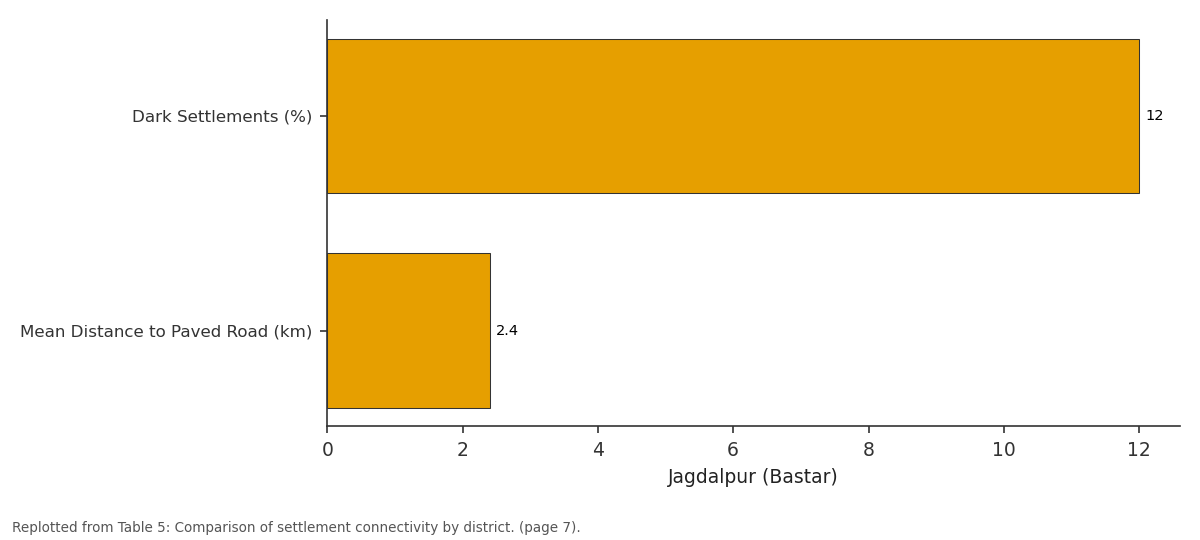
Jagdalpur (Bastar): Dark Settlements (%) vs Mean Distance to Paved...
Replotted from Table 5 (page 7) of the original paper. Every bar is the paper's own table value.
View source evidence ↗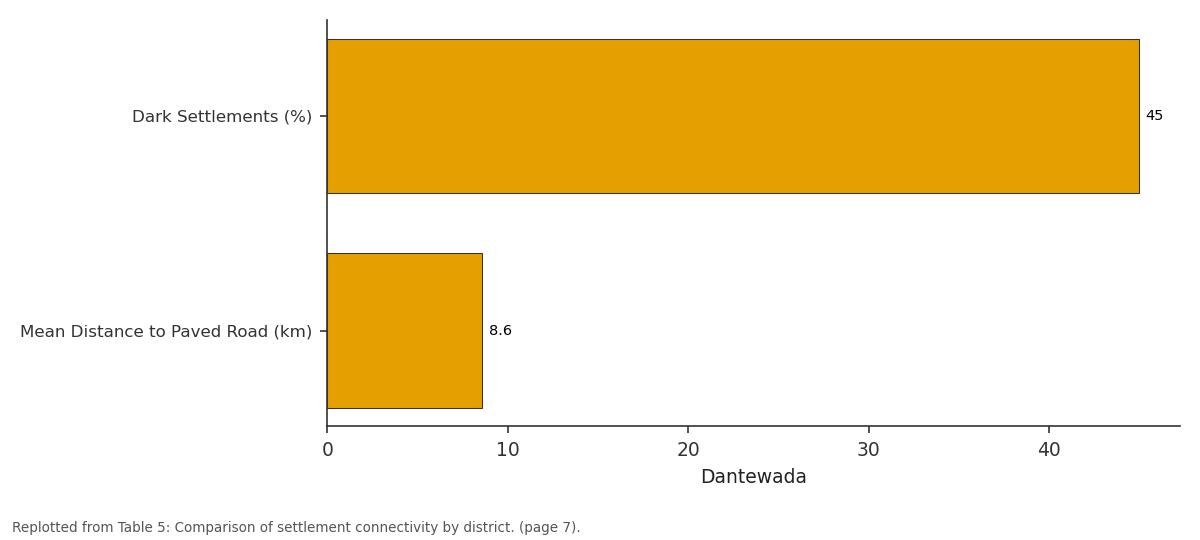
Dantewada: Dark Settlements (%) vs Mean Distance to Paved...
Replotted from Table 5 (page 7) of the original paper. Every bar is the paper's own table value.
View source evidence ↗Figures & tables
From the original paper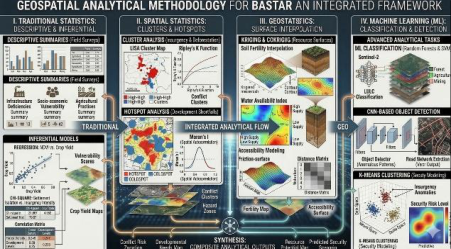 Figure 4
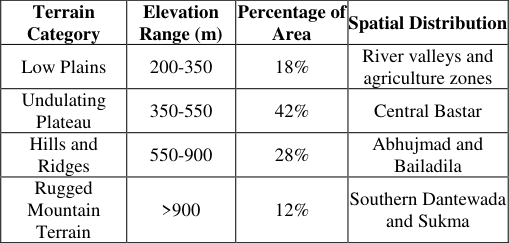 Table 1
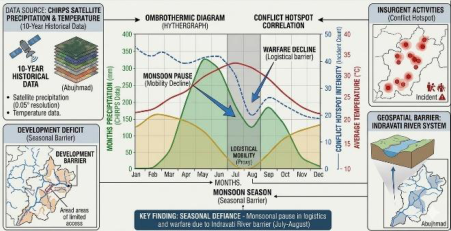 Figure 4
 Table 3
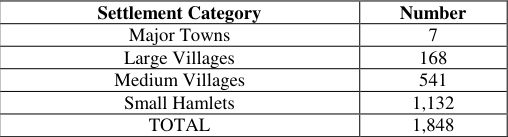 Table 4
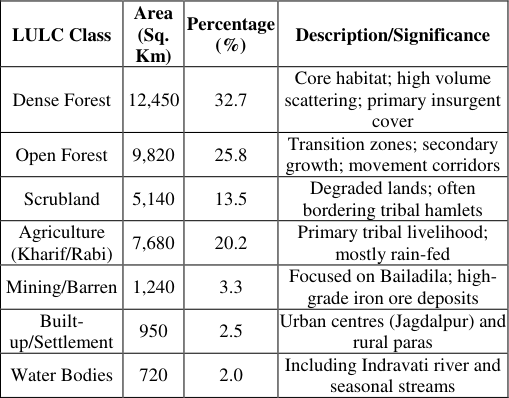 Table 2
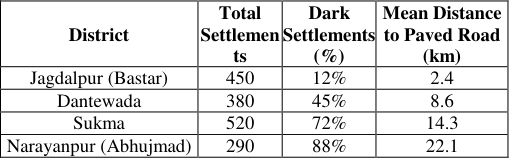 Table 5
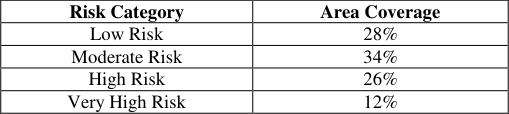 Table 8
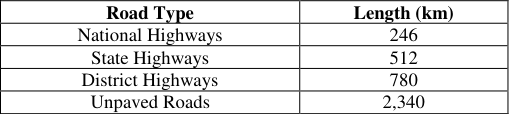 Table 6
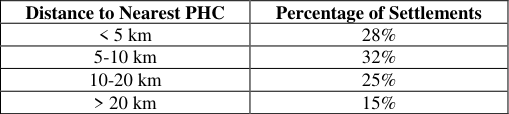 Table 7
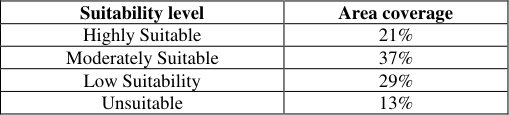 Table 9
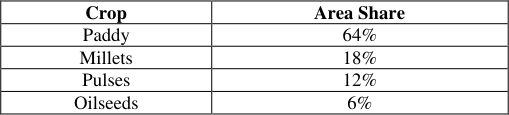 Table 12
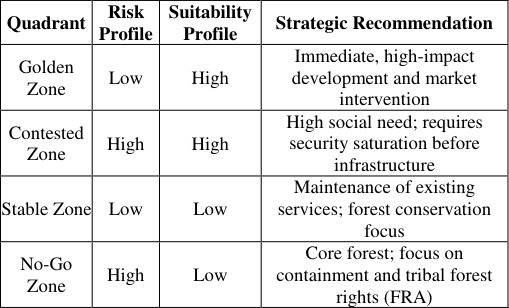 Table 10
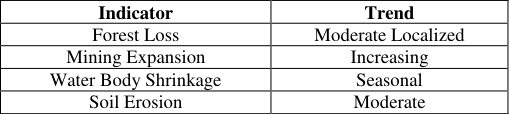 Table 11
Introduction
The evolution of geospatial science in the twenty-first century signifies one of the most consequential technological transformations in spatial decision-making, governance and national security. Geographic Information Systems (GIS), Remote Sensing (RS), Global Navigation Satellite Systems (GNSS) and geospatial analytics have transitioned from tools of cartographic visualization to strategic instruments of governance and intelligence. Contemporary geospatial capabilities extend into predictive analytics, real-time monitoring, early warning systems, humanitarian response, security planning, precision agriculture and environmental management (Gao, 2021; Goodchild, 2007; Kitchin, 2014) [16,19,28] . As digital capabilities deepen, geospatial techniques increasingly serve as the backbone of sustainable development and security operations in regions marked by socio-political conflict, environmental vulnerability and developmental challenges. The integration of advanced technologies, including Artificial Intelligence (AI), Machine Learning (ML), Deep Learning, Big Data analytics, Internet of Things (IoT), cloud computing and high-resolution satellite constellations, has substantially enhanced the potential of geospatial science. Geospatial Intelligence (GEOINT), which synthesizes spatial science with high-end analytics, now plays an indispensable role in national security, counterinsurgency operations, border management, ecological monitoring and disaster preparedness (Coorey, 2018; National Research Council, 2010) [9] . In India, where vast Geographical expanses encompass dense forests, fragile ecosystems, mineral-rich belts and socio-politically sensitive regions, geospatial technologies have become essential for informed governance. The Naxal-affected Bastar region of Chhattisgarh emerges as a strategically significant case for the application of geospatial science. Located in the southern part of Chhattisgarh, Bastar encompasses dense deciduous forests, hill ranges, extensive plateaus, rivers including the Indravati and tribal communities such as the Gonds, Muria, Maria, Dorla and Bhatra whose livelihoods are deeply intertwined with the natural environment (Elwin, 1947; Sundar, 2007) [12,41] . Despite its natural richness, Bastar remains one of India's most socio-economically backward regions, characterized by persistent naxal insurgency, infrastructural deficits, governance challenges and complex socio-political dynamics between the State, local communities and insurgent groups. Bastar's rugged landscape, dense forests, scattered settlements, limited road infrastructure and sparse telecommunication networks have historically complicated governance and service provision. The region, part of the larger 'Red Corridor' spanning multiple Indian states, is regarded as one of the most strategically challenging areas for both security forces and development organizations (Ministry of Home Affairs, 2023). The insurgency has impacted every facet of regional life, affecting access to education, healthcare, basic services, economic development, mobility, and market access and resource management. In this context, geospatial technologies present a robust framework for comprehensively analyzing the landscape, detecting insurgency trends, planning developmental initiatives, assessing environmental transformations and bolstering governance systems. Remote sensing facilitates observation of remote forest interiors where field surveys are challenging; GIS offers layered mapping that combines socio-economic, environmental, infrastructural and security data into cohesive decisionsupport systems; and high-resolution satellite imagery aids in identifying deforestation trends, illegal mining locations and changing settlement patterns (Ayam et al. 2020; Hassan et al. 2016) [3,22] . The mineral resources of Bastar, particularly the high-grade hematite iron ore of the Bailadila range, present both economic opportunities and environmental challenges. These Archean-age banded iron formations, mined primarily by the National Mineral Development Corporation (NMDC), contribute significantly to regional economic potential through establishments such as the Nagarnar Integrated Steel Plant, while simultaneously raising environmental concerns, socio-political disputes and resource management challenges. The Maoist movement commonly known as Naxalism or Left Wing Extremism, emerging in the late 1960s as a radical agrarian movement advocating land reforms and socio-economic justice, gradually spread into forested areas where government presence was minimal and developmental neglect was significant. The consolidation of major Naxalite groups into the Communist Party of India (Maoist) in 2004 marked a pivotal escalation of insurgency activities. The Indian government has recognized Left Wing Extremism as one of the most severe internal security threats, leading to increased clashes between insurgent factions and security forces. This research is motivated by a central problem: the lack of comprehensive, real-time, geospatially informed data systems for security, governance, resource management and development planning in the Naxal-affected region of Bastar. This 'data vacuum' is created and sustained by the long-standing insurgency, resulting in outdated topographic maps, fragmented datasets among government departments, restricted access to high-resolution satellite imagery, absence of continuous environmental monitoring and unreliable land-use and resource maps. This data deficit leads to improper planning, slow development and misallocation of resources. The present study aims to bridge this gap by designing, testing and validating a replicable, unclassified and open-source geospatial framework, the Four-Layer Blueprint, capable of simultaneously addressing the region's entrenched challenges including topographical isolation, insurgency, infrastructural underdevelopment, environmental vulnerability and socio-economic marginalization. The study utilizes a suite of advanced geospatial techniques including multi-sensor satellite imagery (optical and Synthetic Aperture Radar), Geographic Information Systems and multi-criteria spatial analytics to create a multi-layered digital twin of the Bastar region, serving as the primary analytical foundation for integrated security and development planning.
Study area
The Bastar Division of Chhattisgarh comprises seven districts: Bastar (Jagdalpur), Dantewada, Sukma, Bijapur, Kanker, Kondagaon and Narayanpur. Geologically, the region represents an extension of the Deccan Plateau, with the Bailadila Range hosting some of the world's highestgrade hematite iron ore deposits. The forests, constituting part of the vast Dandakaranya belt, are dense, biodiverse and rich in non-timber forest products (NTFPs) including tendu leaves, mahua and bamboo, which form the backbone of the local tribal economy. The Indravati River, considered the region's lifeline, traverses the landscape creating significant features including the Chitrakoot waterfalls (Map-1(b).
Map-1(b): Bastar and red corridor
The region's terrain is characterized by: (i) low plains (200-350m elevation) occupying approximately 18% of the area, comprising river valleys and agricultural zones; (ii) undulating plateau (350-550m) covering 42% of Central Bastar; (iii) hills and ridges (550-900m) constituting 28% in Abhujmad and Bailadila; and (iv) rugged mountain terrain exceeding 900m comprising 12% of the area in southern Dantewada and Sukma. This topographic diversity creates significant challenges for infrastructure development while simultaneously providing strategic advantages for insurgent operations. Bastar consistently ranks at the bottom of human development indices in India, with low literacy rates, high infant mortality, limited healthcare access and endemic malnutrition. This paradox of immense natural wealth coexisting with extreme poverty constitutes what scholars term the 'resource curse,' where development, when it arrives, is perceived as extractive, designed to remove resources while leaving local populations displaced and destitute. The insurgency thrives on these grievances, while the government argues that delivery of development infrastructure is impeded by the insurgency itself, which actively targets such infrastructure. The study area boundaries were defined not solely by administrative district lines but also by the 'Security Vacuum' zones identified in Ministry of Home Affairs reports, ensuring the research focused on the core of the crisis rather than its periphery. This purposive selection approach identified Bastar as a 'Critical Case' where significant resource potential paradoxically coexists with severe infrastructural isolation.
Materials and Methods
Materials and Methods
Research design
This study adopts a geospatial-first, sequential explanatory mixed-methods design organized around the creation of four distinct, interconnected geospatial layers. The methodology is fundamentally integrated and multidimensional, emphasizing the interdependence of security concerns, developmental deficits, and environmental change and governance structures. Quantitative spatial analysis, spectral interpretation, GIS-based modeling and machine learning techniques form the scientific-technical backbone, while qualitative inquiry through key informant interviews and participatory mapping exercises ensures that tribal perspectives, administrative challenges and socio-political nuances are incorporated.
Data sources and database architecture
Acknowledging that no single sensor can fully capture the intricacies of Bastar's landscape, particularly given persistent monsoon cloud cover and dense tropical forests, the database incorporates data across the electromagnetic spectrum: optical (surface reflectance), Synthetic Aperture Radar (structural backscatter) and thermal (anthropogenic emissions). The database follows a hybrid architecture combining file-based geodatabases for high-resolution imagery with structured metadata protocols.
Raster database
The raster database provides the spectral and radiometric foundation of the study. The Optical Backbone comprises Sentinel-2 Multi-Spectral Instrument (MSI) Level-2A data from the European Space Agency (ESA), selected for its 10meter spatial resolution and 5-day temporal revisit capability, crucial for detecting fragmented agricultural fields and small tribal settlements (Map-4.
Map 4.2.2 (C):
Map 4.2.2 (C):
Database management
All datasets were standardized to WGS 84 / UTM Zone 44N (EPSG: 32644) for accurate metric calculations. The study employed the OGC GeoPackage (.gpkg) standard for unified storage. Data organization followed a hierarchical structure: Raw Data, Pre-Processing, Analysis and Final Product. Pre-processing included atmospheric correction via Sen2Cor, geometric co-registration using Ground Control Points (bridges and road intersections) with RMSE less than 0.5 pixels, cloud masking with temporal median compositing and hydrological conditioning of DEM datasets.
The Four-layer geospatial blueprint methodology
The analytical framework is organized around the sequential construction of four interconnected geospatial layers, transitioning from physical reality to strategic modeling. All geospatial analysis was conducted using QGIS 3.34 (Prizren) for vector and raster manipulation and Google Earth Engine (GEE) for cloud-based computational tasks, particularly Random Forest classification (Fig4.2.12).
Layer 2: The human terrain
Systematic grid-based manual digitization was employed to map 'unmapped' settlements. A 5km x 5km vector grid covered the entire study area and each cell was systematically scanned at 1:5,000 scale using highresolution base imagery. Every visible cluster of three or more structures was digitized as a polygon, ensuring capture of subtle visual signatures of tribal hamlets that automated algorithms often misclassify. These polygons were joined with Census 2011 attributes where spatial correspondence existed. Zonal Statistics for electrification modeling employed VIIRS Night-Time Lights data overlaid on the settlement layer. The algorithm calculated mean radiance values within each settlement polygon. A threshold based on known electrified control points (Jagdalpur peri-urban areas) classified settlements as 'Dark/Un-electrified' or 'Light/Electrified,' creating a binary map of state connectivity.
Layer 3: the connectivity matrix
Layer 3: the connectivity matrix
Statistical validation
A Chi-Square test was employed to validate the Security Risk Model by testing the correlation between modeled 'High Risk' zones and actual geolocated incidents of IED blasts and ambushes (2015-2024). A statistically significant correlation (p<0.05) confirms the predictive power of the model.
Qualitative methods
Qualitative methods
Hydrological networks
Hydrological analysis identified major river systems including the Indravati, Sabari, Shankini and Dankini, with 112 seasonal streams and 14 reservoirs mapped across the study area (Map-5.2.3). Rivers serve dual roles: providing irrigation potential and ecosystem services while acting as physical barriers for connectivity and causing seasonal isolation during monsoon periods. A 10km distance in the Abujhmad forest represents a significantly higher traversal 'cost' than 10km on the plains of Jagdalpur (Map-5.4).
Road network analysis
The integrated road network model classified roads into four categories, revealing severe last-mile connectivity deficits Sixty-four percent of identified interior settlements fall outside the 60-minute travel time isochrone for any PHC, representing operationally disconnected populations. This spatial inequality directly affects infant mortality, maternal health outcomes and disease outbreak response. This matrix provides spatially explicit guidance for differentiated governance strategies across the entire Bastar landscape (Map-5.5.3).
Environmental and resource management findings
Satellite image analysis indicates increasing pressures on Bastar's ecosystems. Mining activity is particularly concentrated in the Bailadila iron ore region, raising concerns regarding ecological sustainability (Map-5.6).
Discussion
The findings of this study demonstrate that security and development in the Bastar region constitute a coupled sociospatial system where geography, insurgency, governance and development interact dynamically. The Four-Layer Geospatial Blueprint provides evidence for several critical interrelationships that have implications for both theory and practice.
Geography as a strategic variable
The terrain morphology analysis reveals that Bastar's physical geography is not merely an environmental context but an active strategic factor shaping patterns of governance and conflict. The rugged terrain and extensive forest cover offer decisive advantages to insurgent groups, enabling mobility and concealment in remote areas that remain difficult for security forces to access (Fearon & Laitin, 2003; Berman & Laitin, 2008) [4,14] . The Topographic Ruggedness Index (TRI) analysis quantifies this relationship, demonstrating that high-ruggedness zones coincide with both insurgent operational areas and infrastructure development challenges. This finding aligns with the conflict geography literature, which establishes that terrain complexity, forest density and remoteness are systematically exploited by guerrilla movements (Hoelscher et al. 2012; Mukherjee, 2017) [23,32] . The 'weaponization of geography' observed in Bastar, where insurgents have systematically exploited the dense triplecanopy tropical moist deciduous forests and rugged undulating terrain, confirms the theoretical framework proposed by conflict geographers. The natural barriers created by hills, plateaus and rivers have been transformed into military assets, making the construction and protection of roads a high-risk endeavor. This finding has direct implications for counterinsurgency strategy, suggesting that terrain-informed geospatial intelligence must precede operational planning.
The Resource paradox
The Bailadila iron ore belt, while economically critical, exhibits high Security Risk rankings due to the rugged terrain and the weaponization of geography by insurgents. This paradox, where mineral wealth coexists with security vulnerability, reflects the broader 'resource curse' dynamics observed in conflict-affected resource-rich regions globally (Homer-Dixon, 1991) [24] . The LULC classification reveals that mining areas constitute only The integration of sustainable extraction practices with ecological impact tracking, as enabled by the Four-Layer Blueprint, offers a pathway toward resolving this paradox.
The human terrain and governance deficits
The identification of over 1,200 previously unmapped settlements represents a critical finding with profound governance implications. When settlements are not accurately mapped, they are systematically excluded from development schemes, infrastructure planning and welfare programs. This administrative invisibility perpetuates cycles of marginalization and, as the FGDs confirmed, fuels the insurgent narrative that the state is absent or indifferent to tribal welfare. The electrification proxy analysis reveals a direct spatial correlation between state absence and insurgency influence. Districts such as Narayanpur (Abhujmad), where 88% of settlements are classified as 'Dark,' represent zones where the state's reach has effectively ceased, creating governance vacuums that insurgents fill. This finding validates the theoretical proposition that insurgency thrives not merely in poor areas but in areas where the state is spatially absent.
The tyranny of distance and infrastructure gaps
The finding that 64% of interior settlements fall outside the 60-minute travel time isochrone for any Primary Health Center quantifies the spatial dimension of healthcare inequality in Bastar. This is not merely a matter of distance but of terrain complexity, road quality and security conditions that compound to create effective isolation. The weighted friction model demonstrates that standard Euclidean distance metrics significantly underestimate the true accessibility challenges in this terrain.
The discrepancy between official road maps and ground reality, where many 'official' roads are overgrown or breached, reveals a critical data quality issue. Government datasets that do not reflect actual traversability lead to flawed planning assumptions and resource misallocation.
The systematic digitization and quality assessment of the road network performed in this study addresses this gap, providing a more realistic foundation for infrastructure planning.
5.5
The agriculture-security nexus NDVI analysis indicates that agricultural productivity is lowest in 'dark settlements' far from paved roads, establishing a direct link between connectivity and livelihood security. Agriculture in Bastar remains predominantly rain-fed and subsistence-oriented, with paddy occupying 64% of cultivated area. The correlation between low agricultural intensity, settlement isolation and insurgency presence suggests that livelihood insecurity is both a consequence and a driver of conflict. This finding supports the argument that development interventions targeting agricultural productivity, irrigation infrastructure and market connectivity can serve dual securitydevelopment objectives.
Integrated framework performance
The statistical validation of the Security Risk Model, confirming significant correlation (p<0.05) between modeled high-risk zones and actual geolocated conflict incidents, demonstrates that an integrated geospatial framework using exclusively unclassified, open-source data can produce actionable security intelligence. This finding addresses a critical gap in the literature, where military GEOINT methods are typically classified and inaccessible to civilian researchers and development planners (Coorey, 2018; Clarke, 2001) [8,9] . The 2x2 Policy Matrix represents a novel contribution by simultaneously visualizing security risk and development potential, enabling policymakers to move beyond binary security-or-development approaches toward integrated strategies tailored to specific landscape conditions. The identification of 'Golden Zones' (Low Risk, High Suitability), 'Contested Zones' (High Risk, High Suitability), 'Stable Zones' (Low Risk, Low Suitability) and 'No-Go Zones' (High Risk, Low Suitability) provides a spatially explicit decision-support tool.
Methodological innovation
This study demonstrates that the 'data vacuum' of an inaccessible conflict zone can be overcome through multisensor data fusion, virtual ground-truthing and secondary data triangulation. The fusion of Sentinel-1 SAR (structural information) with Sentinel-2 optical (spectral information) and ALOS PALSAR DEM (topographic information) enabled canopy-compensated LULC classification that would be impossible with any single sensor. The 'remote ground-truthing' methodology, using high-resolution reference imagery and systematic virtual digitization, provides a replicable approach for other inaccessible regions.
The Participatory GIS component, involving Screen-Based Participatory Mapping with NGO workers and district planners, demonstrated that geospatial outputs can be validated and enriched through local knowledge integration even when physical access is restricted. This approach addresses ethical concerns about top-down surveillance by incorporating community perspectives into the analytical framework.
Policy implications
The Four-Layer Geospatial Blueprint generates actionable implications across multiple domains of governance, security planning and sustainable development. The spatially explicit outputs provide evidence-based foundations for targeted interventions that acknowledge the heterogeneity of the Bastar landscape.
Security planning
The Security Risk Surface enables predictive deployment of security resources based on geographic favorability for insurgent operations rather than reactive response to incidents. High-risk corridors identified through the MCDA model, validated against historical conflict data, can inform patrol route optimization, outpost siting and vulnerability assessment for critical infrastructure. The integration of terrain analysis (line-of-sight, least-cost path modeling) with forest density and proximity variables provides a comprehensive operational picture. The framework also supports ethical security planning by identifying civilian settlement patterns within risk zones, enabling measures to minimize collateral impact.
Infrastructure planning
The Development Suitability Model and Infrastructure Gap Analysis provide quantitative foundations for prioritizing road construction, healthcare facility placement and communication tower deployment. The finding that 64% of settlements are outside the 60-minute PHC isochrone establishes a measurable target for healthcare infrastructure investment. The weighted friction model identifies optimal route alignments that minimize terrain cost while maximizing population connectivity. The 'Golden Zone' classification enables phased development strategies that begin with low-risk, high-impact investments and progressively expand into contested areas as security conditions improve.
Tribal development
The settlement mapping database, identifying over
Figures and tables from the paper
| Features | Number/Length |
|---|---|
| Major Rivers | 4 |
| Seasonal Streams | 112 |
| Reservoirs | 14 |
Table text extracted from the original PDF; superscript letters are shown inline. The original table image is below.
View original table image
| Settlement Category | Number |
|---|---|
| Major Towns | 7 |
| Large Villages | 168 |
| Medium Villages | 541 |
| Small Hamlets | 1,132 |
| TOTAL | 1,848 |
Table text extracted from the original PDF; superscript letters are shown inline. The original table image is below.
View original table image
| Risk Category | Area Coverage |
|---|---|
| Low Risk | 28% |
| Moderate Risk | 34% |
| High Risk | 26% |
| Very High Risk | 12% |
Table text extracted from the original PDF; superscript letters are shown inline. The original table image is below.
View original table image
| Road Type | Length (km) |
|---|---|
| National Highways | 246 |
| State Highways | 512 |
| District Highways | 780 |
| Unpaved Roads | 2,340 |
Table text extracted from the original PDF; superscript letters are shown inline. The original table image is below.
View original table image
| Distance to Nearest PHC | Percentage of Settlements |
|---|---|
| < 5 km | 28% |
| 5-10 km | 32% |
| 10-20 km | 25% |
| > 20 km | 15% |
Table text extracted from the original PDF; superscript letters are shown inline. The original table image is below.
View original table image
| Suitability level | Area coverage |
|---|---|
| Highly Suitable | 21% |
| Moderately Suitable | 37% |
| Low Suitability | 29% |
| Unsuitable | 13% |
Table text extracted from the original PDF; superscript letters are shown inline. The original table image is below.
View original table image
| Crop | Area Share |
|---|---|
| Paddy | 64% |
| Millets | 18% |
| Pulses | 12% |
| Oilseeds | 6% |
Table text extracted from the original PDF; superscript letters are shown inline. The original table image is below.
View original table image
| Indicator | Trend |
|---|---|
| Forest Loss | Moderate Localized |
| Mining Expansion | Increasing |
| Water Body Shrinkage | Seasonal |
| Soil Erosion | Moderate |
Table text extracted from the original PDF; superscript letters are shown inline. The original table image is below.
View original table image
References
41 in the original paper- Adriaensen F, Chardon JP, De Blust G, Swinnen E, Villalba S, Gulinck H, et al. The application of least-cost modelling as a functional landscape model. Landsc Urban Plan. 2003;64(4):233-247.
- Armed Conflict Location & Event Data Project (ACLED). Conflict data and analysis [Internet]. 2023 [cited 2026 Jul 16]. Available from: https://acleddata.com/
- Ayam GP, Chandrakar K, Dewangan SK. Land use and land cover change analysis in Bastar region of Chhattisgarh using remote sensing and GIS techniques. J Geogr Inf Syst. 2020;12(3):245-260.
- Berman E, Laitin DD. Religion, terrorism and public goods: Testing the club model. J Public Econ. 2008;92(10-11):1942-1967.
- Berry BJL. Geography of market centers and retail distribution. Englewood Cliffs (NJ): Prentice-Hall; 1964.
- Boulding KE. Conflict and A general theory. New York: Harper & Row; 1962.
- Campbell JB, Wynne RH. Introduction to remote sensing. 5th ed. New York: Guilford Press; 2011.
- Clarke KC. Geoprocessing and the analysis of conflict. In: Geographic Information Systems and Science. New York: John Wiley & Sons; 2001.
- Coorey S. Geospatial intelligence in contemporary security operations. In: The Routledge Handbook of Security Studies. London: Routledge; 2018.
- Craig WJ, Harris TM, Weiner D. Community participation and geographic information systems. London: Taylor & Francis; 2002.
- Deutsch M. The resolution of conflict: Constructive and destructive processes. New Haven (CT): Yale University Press; 1973.
- Elwin V. The Muria and their ghotul. London: Oxford University Press; 1947.
- European Space Agency. Copernicus Sentinel satellite missions [Internet]. 2023 [cited 2026 Jul 16]. Available from: https://sentinel.esa.int
- Fearon JD, Laitin DD. Ethnicity, insurgency and civil war. Am Polit Sci Rev. 2003;97(1):75-90.
- Forest Survey of India. India state of forest report 2021. Dehradun: Ministry of Environment, Forest and Climate Change; 2021.
- Gao S. Geospatial artificial intelligence (GeoAI). In: Oxford Bibliographies in Geography. Oxford: Oxford University Press; 2021.
- Gebbers R, Adamchuk VI. Precision agriculture and food security. Science. 2010;327(5967):828831.
- Goodchild MF. Geographic information science. Int J Geogr Inf Syst. 1992;6(1):31-45.
- Goodchild MF. Citizens as sensors: The world of volunteered geography. GeoJournal. 2007;69(4):211-221.
- Government of India. Guidelines for geospatial data liberalization. New Delhi: Department of Science and Technology; 2021.
- Government of India. National Geospatial Policy 2022. New Delhi: Ministry of Science and Technology; 2022.
- Hassan R, Khan AA, Ahmad F. Urban expansion and land use change analysis using remote sensing and GIS. Sustain Cities Soc. 2016;24:28-37.
- Hoelscher K, Miklian J, Nygard HM. Understanding the causes of conflict in India. Int Area Stud Rev. 2012;15(3):203-223.
- Homer-Dixon T. Environmental scarcity and violent conflict. In: Population and Environment in Developing Countries. Oxford: Oxford University Press; 1991.
- Indian Space Research Organisation (ISRO). Indian remote sensing satellite data user handbook. Hyderabad: National Remote Sensing Centre; 2023.
- Jensen JR. Introductory digital image processing: A remote sensing perspective. 2nd ed. Upper Saddle River (NJ): Prentice Hall; 1996.
- Jensen JR. Remote sensing of the environment: An earth resource perspective. 2nd ed. Boston: Pearson Education; 2014.
- Kitchin R. The data revolution: Big data, open data, data infrastructures and their consequences. London: Sage Publications; 2014.
- Lillesand T, Kiefer RW, Chipman J. Remote sensing and image interpretation. 7th ed. Hoboken (NJ): Wiley; 2015.
- Macedonia M. GIS and military decision support systems. In: Geospatial Information Systems in Military Operations. Washington (DC): National Defense University Press; 2002.
- Ministry of Home Affairs. Left wing extremism affected districts in India. New Delhi: Government of India; 2023.
- Mukherjee A. Mapping insurgency in India: Spatial analysis of left-wing extremism. Asian Surv. 2017;57(3):482-504.
- National Research Council. Geospatial intelligence and national security. Washington (DC): National Academies Press; 2010.
- Navlakha G. Days and nights in the heartland of rebellion. New Delhi: Penguin Books; 2012. 35. Office of the Registrar General & Census Commissioner. District census handbook: Bastar. New Delhi: Ministry of Home Affairs, Government of India; 2011.
- Parker DC, Evans TP, Meretsky V. Infrastructure development and rural accessibility: A GIS-based approach. Environ Plan B. 2013;40(4):707-723.
- Schaefer FK. Exceptionalism in geography: A methodological examination. Ann Assoc Am Geogr. 1953;43(3):226-249.
- Scott JC. The art of not being governed: An anarchist history of upland Southeast Asia. New Haven (CT): Yale University Press; 2009.
- Sharma P. Spatial patterns of left-wing extremism in India. Econ Polit Wkly. 2015;50(21):39-45.
- Soja EW. Seeking spatial justice. Minneapolis (MN): University of Minnesota Press; 2010.
- Sundar N. Subalterns and sovereigns: An anthropological history of Bastar, 1854-2006. New Delhi: Oxford University Press; 2007.
- Thakur P, Kumar P, Srivastava V. Geomorphological mapping and analysis using remote sensing and GIS. Geomorphology. 2012;150-151:153-162.