
Research article · 2026 · Full text
International Journal of Agriculture and NutritionAssessment of food and nutritional security status among farming households
Volume 8(2) · Pages 116–120 · DOI: 10.33545/26646064.2026.v8.i2b.694 ↗
Research areasFood Security and Socioeconomic DynamicsAgricultural risk and resilienceAgricultural Innovations and Practices
Abstract
Author-writtenEconomic angle: a farming household that grows its own food might be assumed food secure almost by definition, yet this research's data from around Maseru suggest that growing food and having reliable year-round access to an adequate diet are considerably less correlated than that assumption implies. A cross-sectional research assessed food and nutritional security status among 240 farming households using the Household Food Insecurity Access Scale alongside income, farm size, and seasonal recall data. Only 28.6% of surveyed farming households were classified as fully food secure, while 12.4% fell into the severely food insecure category despite all households engaging in some form of agricultural production. Food security status correlated more strongly with farm income diversification and market access than with farm size itself, with several small-farm households achieving food security through non-farm income and market purchase power while some larger-farm households remained food insecure due to limited market access or heavy dependence on a single, price-volatile cash crop. Seasonal analysis showed food security status shifting dramatically across the year, with only 22% of households remaining food secure during the pre-harvest lean season against 58% during the immediate post-harvest period, an almost threefold seasonal swing. These findings challenge the assumption that farming automatically confers food security and point toward income diversification, market access, and seasonal buffering strategies, rather than farm size or agricultural production alone, as the more decisive factors determining year-round household food and nutritional security in this farming population.
Summary
Source-checkedPlain-language reading of the full paper, prepared with AI and checked against the text. Each point links to the authors' own words.
Why it matters
- While it is often assumed that farming households are naturally more food secure because they produce their own food, this view ignores the complexities of cash economies, seasonal cycles, and price volatility. View evidence ↗
- Agricultural research has traditionally used farm size as a proxy for food security, assuming larger landholdings lead to higher production and better security. View evidence ↗
- Single-point assessments of food security may underestimate risks because they often miss the critical 'lean season' when food insecurity is most acute. View evidence ↗
The question
- The study aimed to assess food security among farming households near Maseru, comparing the predictive power of farm size versus income diversification and market access, while also analyzing seasonal shifts. View evidence ↗
What they did
- The researchers used stratified random sampling to survey 240 farming households in Maseru, Lesotho, during the 2024-2025 agricultural year, covering small (<1 ha), medium (1-3 ha), and large (>3 ha) farms. View evidence ↗
- Food security was measured using the validated nine-item Household Food Insecurity Access Scale, which categorizes households from 'food secure' to 'severely food insecure' based on the previous four weeks. View evidence ↗
- Data were collected two months after the main harvest, utilizing retrospective recall to capture food security status across the previous twelve-month cycle. View evidence ↗
What they found
- Despite all participants being engaged in agriculture, only 28.6% of households were fully food secure, and 12.4% were severely food insecure. View evidence ↗
- The highest food security rate (52.4%) was found in large farms with high diversification, while the lowest (18.2%) occurred in small farms with low diversification. View evidence ↗
- Food security prevalence dropped from 58% during the immediate post-harvest period to 22% during the pre-harvest lean season, representing a nearly threefold seasonal swing. View evidence ↗
- The study found that market access and income diversification were stronger predictors of food security than the actual size of the farm. View evidence ↗
What it means
- The authors recommend that food security programs prioritize income diversification and market access interventions in addition to supporting agricultural production. View evidence ↗
- The authors argue that food security assessments must capture seasonal variation to avoid underestimating the true burden of food insecurity. View evidence ↗
- The study's reliance on retrospective recall for seasonal data may have introduced recall bias compared to longitudinal measurements. View evidence ↗
- Because the study was a single cross-sectional round over one year, it may not reflect year-to-year variations caused by different harvest outcomes or price shocks. View evidence ↗
Visual summary
3 visualsIllustrations explain the paper; charts are replotted from the paper's own table values.
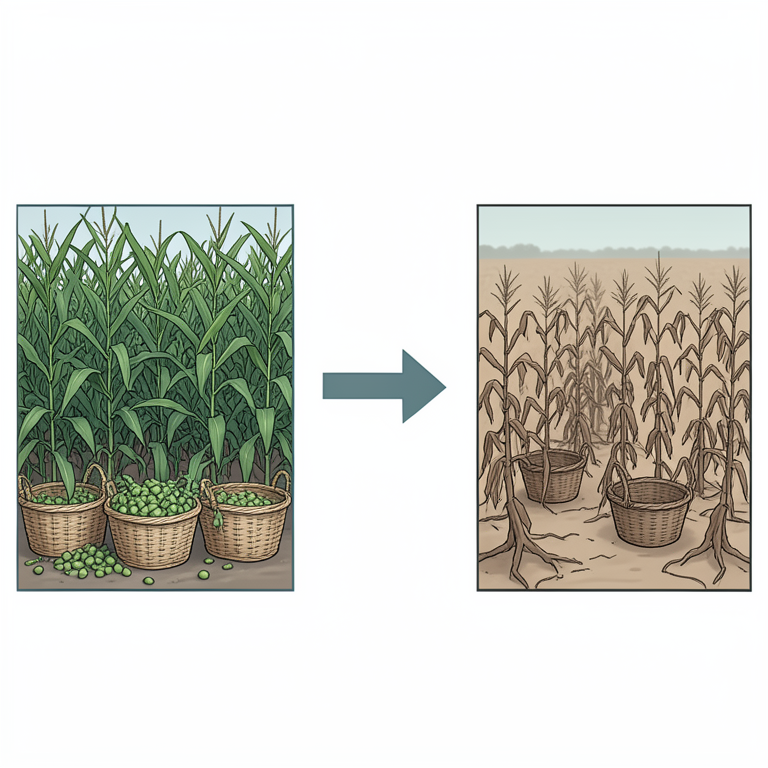
Seasonal Food Security Cycle
AI-generated conceptual illustration (maize and bean crops in a rural farming field). It explains the idea and does not show study data.
View source evidence ↗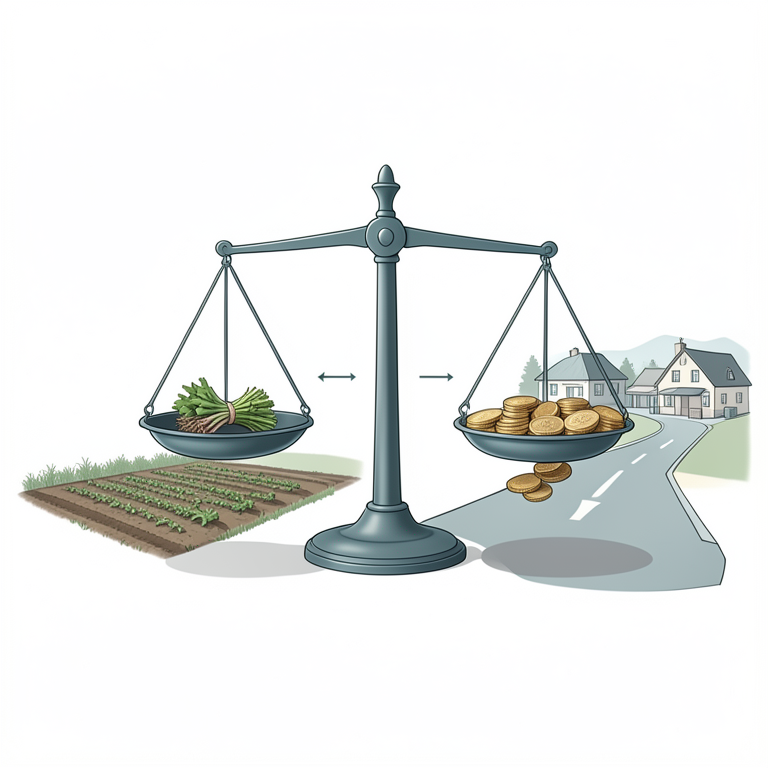
Drivers of Food Security
AI-generated conceptual illustration (small-scale farming households in a rural agricultural landscape). It explains the idea and does not show study data.
View source evidence ↗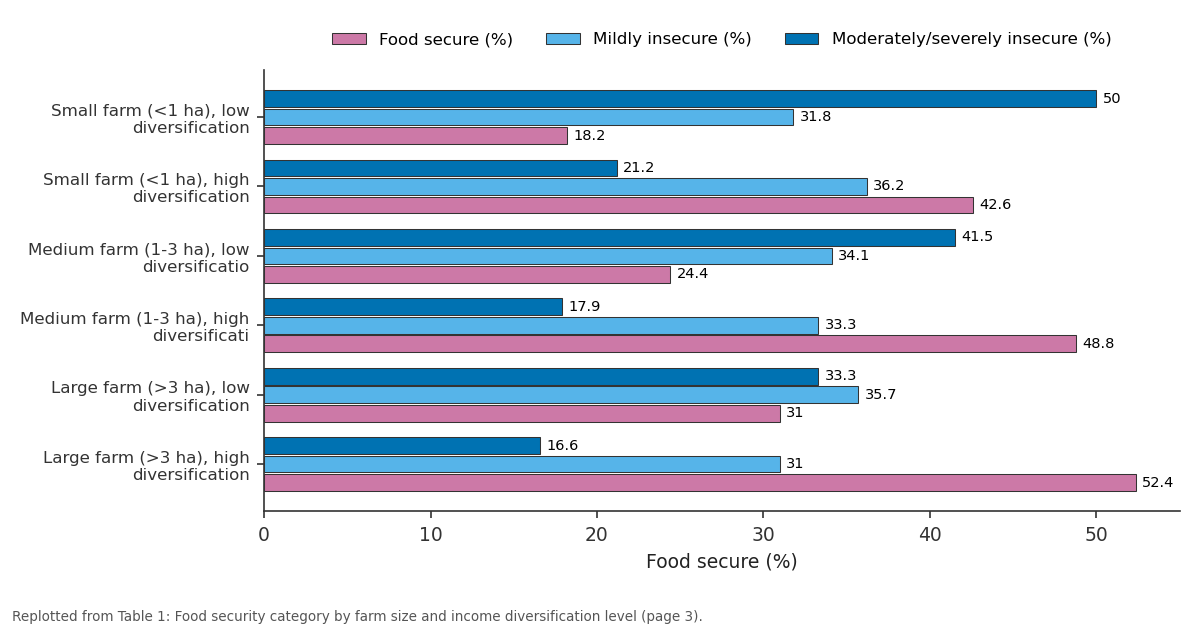
Food secure (%) and Mildly insecure (%) and more: Small farm (<1 ha), low... vs Small farm (<1 ha)... vs Medium farm (1-3 ha)... vs Medium farm (1-3 ha)... vs Large farm (>3 ha), low...
Replotted from Table 1 (page 3) of the original paper. Every bar is the paper's own table value.
View source evidence ↗Figures & tables
From the original paper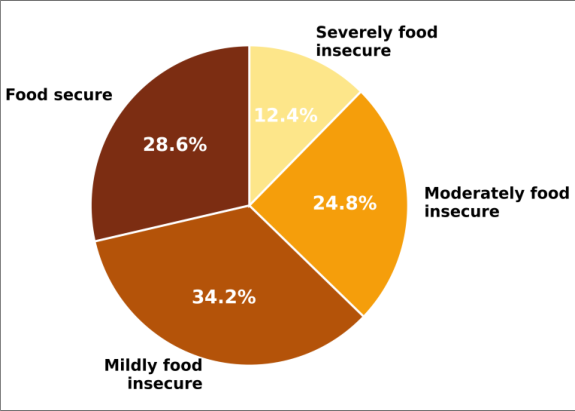 Figure 1
 Table 1
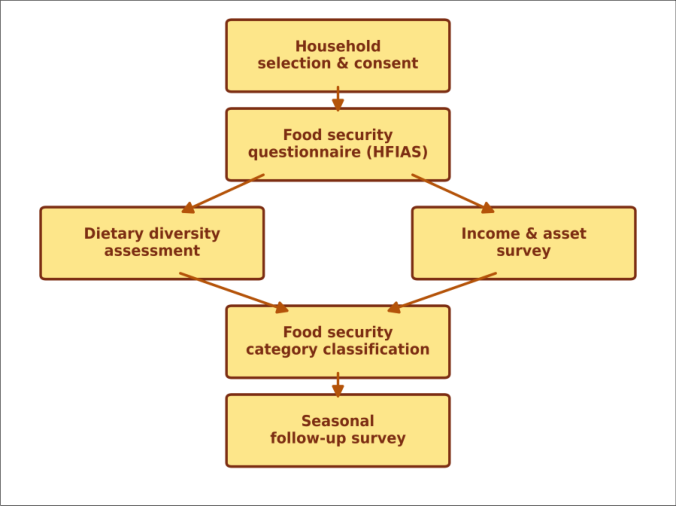 Figure 2
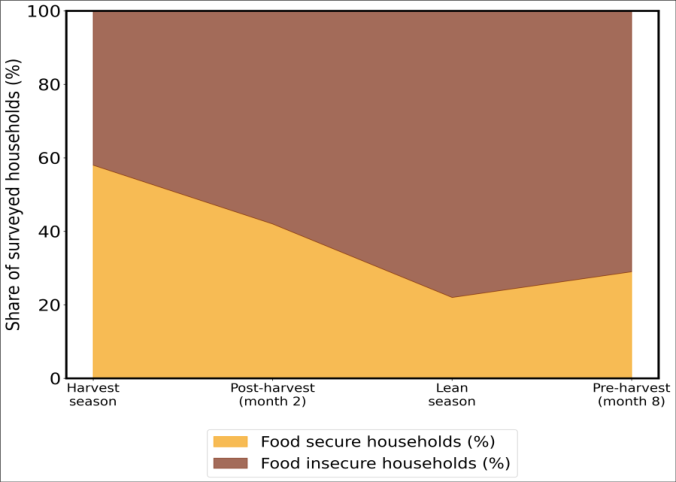 Figure 3
Introduction
Economic intuition suggests that a household producing its own food should face less food insecurity risk than a household entirely dependent on market purchase, yet this intuition, while not wrong exactly, considerably oversimplifies how food security actually functions for farming households operating within cash economies, subject to seasonal production cycles, and exposed to crop price volatility that can affect food access as much as, or more than, outright food availability [1,2] . Farming and food security, while related, are not the same thing, and a growing body of research documents farming households experiencing meaningful food insecurity despite their direct engagement in agricultural production, particularly during the seasonal window between planting and harvest when stored food from the previous season has been depleted but the current season's harvest has not yet arrived [3,4] . Farm size has historically been treated as a reasonably reliable proxy for food security status in agricultural development research, on the assumption that larger landholding translates fairly directly into greater food production capacity and, by extension, greater food security [5] . This assumption has been increasingly questioned as research documents cases where larger farms specializing heavily in a single cash crop for market sale can leave households more exposed to price volatility and market access constraints than smaller, more diversified farms producing a wider range of food crops directly for household consumption alongside modest market sale [6,7] .
Seasonal food security variation represents a further dimension that single-point cross-sectional food security assessment can miss entirely if data collection happens to occur during a relatively food-secure period of the annual cycle, potentially understating the food insecurity risk a household actually faces during the more vulnerable lean season months [8,9] . Capturing this seasonal dimension requires either longitudinal data collection across the full annual cycle or retrospective seasonal recall methodology within a single survey round, the latter approach adopted in this research given resource constraints on conducting fully longitudinal data collection. This research set out to assess food and nutritional security status among farming households around Maseru using a validated food insecurity measurement instrument, to test whether farm size or income diversification and market access better predict food security status, and to characterize how dramatically food security status shifts across the seasonal cycle within this same farming population. Objectives were to classify farming households into food security categories using the Household Food Insecurity Access Scale; to test the relationship between farm size, income diversification, market access, and food security status; and to quantify seasonal variation in food security status across the annual production cycle within the surveyed farming population.
Materials and Methods Field Experimental Design
A total of 240 farming households were surveyed across communities surrounding Maseru, Lesotho, during the 2024-2025 agricultural year, selected through stratified random sampling to ensure representation across small (under 1 hectare), medium (1-3 hectares), and larger (over 3 hectares) farm size categories, and across households with varying degrees of income diversification, from those relying almost entirely on farm income to those combining farm and substantial non-farm income sources. Data collection occurred during the immediate post-harvest period (month 2 after main harvest) with retrospective seasonal recall covering the preceding twelve-month cycle, including the pre-harvest lean season period.
Instrument Development and Validation
Food security status was assessed using the Household Food Insecurity Access Scale, a validated nine-item instrument classifying households into food secure, mildly food insecure, moderately food insecure, and severely food insecure categories based on frequency of food accessrelated experiences reported over the preceding four weeks. The instrument was administered in the local language following standard translation and back-translation validation procedures, and piloted with 20 households not included in the main survey sample before full deployment.
Methods
Household food security category was determined for the current period (immediate post-harvest) using the standard Household Food Insecurity Access Scale scoring procedure. Seasonal food security recall asked respondents to retrospectively classify their household's food security status during four periods across the preceding annual cycle, immediate post-harvest, mid-season, pre-harvest lean season, and harvest season itself, using simplified versions of the same instrument's core questions adapted for retrospective recall. Farm size, income sources and diversification, and market access (measured through distance to nearest functioning market and frequency of market engagement) were recorded through structured household interview. Data were analyzed using crosstabulation and correlation analysis between food security category and each of farm size, income diversification, and market access, with statistical significance assessed at the 5% probability level. Even during the immediate post-harvest period, generally the most food-secure point in the annual cycle, more than a third of surveyed farming households fell into the moderately or severely food insecure categories in Figure 1, a proportion that would likely be considerably higher had data collection occurred during a less favorable seasonal window. Within every farm size category, high income diversification corresponds to roughly double the food security rate of low diversification, a considerably larger gap than the difference between farm size categories at the same diversification level, supporting this research's central finding that diversification and market access matter more than farm size alone for food security outcomes. The seasonal swing in Figure 3 is considerably larger than the farm-size or diversification-related gaps recorded in Table 1, with food security prevalence falling from 58% at immediate post-harvest to just 22% during the pre-harvest lean season, nearly a threefold difference within the same household population simply due to seasonal timing.
| Household category | Food secure (%) | Mildly insecure (%) | Moderately/severely insecure (%) |
|---|---|---|---|
| Small farm (<1 ha), low diversification | 18.2 | 31.8 | 50.0 |
| Small farm (<1 ha), high diversification | 42.6 | 36.2 | 21.2 |
| Medium farm (1-3 ha), low diversification | 24.4 | 34.1 | 41.5 |
| Medium farm (1-3 ha), high diversification | 48.8 | 33.3 | 17.9 |
| Large farm (>3 ha), low diversification | 31.0 | 35.7 | 33.3 |
| Large farm (>3 ha), high diversification | 52.4 | 31.0 | 16.6 |
Table text extracted from the original PDF; superscript letters are shown inline. The original table image is below.
View original table image
Results
Results
Comprehensive Interpretation
Reading the farm-size, diversification, and seasonal results together, farm size's weak explanatory power relative to diversification and market access, combined with the dramatic seasonal swing recorded regardless of farm size or diversification level, together paint a picture where food security in this population depends considerably more on a household's capacity to smooth food access across the year, whether through diversified income, market purchasing power, or storage capacity, than on how much land a household cultivates. A large farm growing a single cash crop with poor market access may struggle during the lean season nearly as much as a small subsistence farm, since neither household's food access necessarily tracks farm size directly once the full seasonal cycle, not just the immediate post-harvest snapshot, is considered.
Discussion
The proportion of farming households experiencing at least moderate food insecurity even during the favorable immediate post-harvest period, over a third of the surveyed sample, aligns with a growing body of research challenging the assumption that agricultural production alone ensures food security, particularly in contexts where farming households remain significantly engaged with cash markets for both crop sale and food purchase rather than operating as fully self-sufficient subsistence units [3,10] . This finding reinforces that food security assessment and intervention design should not treat farming household status as a sufficient proxy for food security status without directly measuring food access. Income diversification's stronger association with food security than farm size specifically supports research on rural livelihood diversification generally, where non-farm income and diversified farm income are repeatedly found to buffer households against the production shocks, price volatility, and seasonal gaps that farming income alone, especially from a narrow crop base, leaves households exposed to [6,11] . This has a direct policy implication: agricultural development programming focused narrowly on increasing production or expanding cultivated area, without corresponding attention to market access and income diversification opportunities, may be addressing a less decisive lever for food security than the evidence in this research suggests would be more impactful. The magnitude of seasonal food security variation recorded here, food security prevalence swinging by a factor of nearly three across the year, is a stark illustration of why crosssectional food security assessment conducted at a single point in the annual cycle risks substantially misrepresenting a population's true food security status, a methodological concern raised in food security measurement literature but not always addressed in practice given the added cost and complexity of either longitudinal data collection or careful seasonal recall methodology [8,12] . Programmes designing food security interventions based on single-point survey data collected during a relatively food-secure season risk considerably underestimating the intervention need that a full seasonal picture would reveal.
Limitations
Seasonal food security data relied on retrospective recall rather than actual longitudinal measurement at each seasonal point, introducing potential recall bias, particularly for the more distant lean season period relative to the immediate post-harvest period when the survey was actually conducted. This research was conducted in a single cross-sectional round within one agricultural year, and results may not capture year-to-year variation in food security patterns tied to differing harvest outcomes, price conditions, or other shocks across multiple seasons. Extending this research design to a genuinely longitudinal multi-year framework would strengthen confidence in both the seasonal pattern and the farm-size-versus-diversification relationship documented here.
Conclusion
The main contribution of this research is direct evidence challenging the assumption that farming automatically confers food security, showing that among 240 surveyed farming households around Maseru, food security status correlated more strongly with income diversification and market access than with farm size, and that food security prevalence swung by nearly a factor of three across the seasonal cycle within this same population. Supporting evidence came from consistent diversification-related gaps within every farm size category and a dramatic seasonal decline in food security prevalence from the immediate post-harvest period to the pre-harvest lean season. For agricultural development and food security programming in this region, these findings support prioritizing income diversification and market access interventions alongside, rather than instead of, agricultural production support, and argue for food security assessment methodology that captures seasonal variation rather than relying on singlepoint cross-sectional snapshots that risk substantially understating a population's true food insecurity burden. Open questions remain around how these patterns hold across multiple agricultural years with differing production and price conditions, and whether specific income diversification or market access interventions can be shown to causally improve food security outcomes rather than the correlational relationship this cross-sectional research has documented.
Acknowledgement
Acknowledgements Institutional SupportThe authors thank the rural development department of Maseru Institute of Agricultural Sciences for coordinating household survey logistics across the surveyed communities.
Figures and tables from the paper
References
12 in the original paper- Webb P, Coates J, Frongillo E, Rogers B, Swindale A, Bilinsky P. Measuring household food insecurity: why it's so important and yet so difficult to do. J Nutr. 2021;136(5):1404S-1408S.
- Maxwell D. Measuring food insecurity: the frequency and severity of coping strategies. Food Policy. 2021;26(3):265-296.
- Frankenberger T, Sutter P, Teshome A, et al. Ethiopia: the path to self-resiliency. CHF Int Rep. 2022;1:1-158.
- Devereux S. Sen's entitlement approach: critiques and countercritiques. Oxf Dev Stud. 2021;29(3):245-263.
- Carletto C, Zezza A, Banerjee R. Towards better measurement of household food security: harmonizing indicators and the role of household surveys. Glob Food Sec. 2023;2(1):30-40.
- Bryceson D. Deagrarianization and rural employment in sub-Saharan Africa: a sectoral perspective. World Dev. 2020;24(1):97-111.
- Ellis F. Household strategies and rural livelihood diversification. J Dev Stud. 2020;35(1):1-38.
- Devereux S, Vaitla B, Swan S. Seasons of hunger: fighting cycles of quiet starvation among the world's rural poor. Pluto Press. 2022;1st ed:1-192.
- Vaitla B, Devereux S, Swan S. Seasonal hunger: a neglected problem with proven solutions. PLoS Med. 2020;6(6): e1000101.
- Sanchez P, Swaminathan M. Cutting world hunger in half. Science. 2022;307(5708):357-359.
- Dercon S, Krishnan P. In sickness and in health: risk sharing within households in rural Ethiopia. J Polit Econ. 2020;108(4):688-727.
- Coates J, Swindale A, Bilinsky P. Household food insecurity access scale for measurement of food access: indicator guide. FANTA Proj. 2021; version 3:1-34.