
Research article · 2026 · Full text
International Journal of Agriculture and NutritionEffect of intercropping systems on productivity, profitability and land equivalent ratio of pulses
Volume 8(2) · Pages 88–91 · DOI: 10.33545/26646064.2026.v8.i2b.688 ↗
Research areasAgronomic Practices and Intercropping SystemsAgricultural Science and FertilizationAgroforestry and silvopastoral systems
Abstract
Author-writtenSurprising fact: a hectare planted with cereal and legume intercropped together can, under the right row arrangement, out-produce two separate hectares each growing the crops alone by more than 40%, at least according to the land equivalent ratio data this two-season research recorded around Yamoussoukro. Four cropping arrangements, sole cereal, sole legume (cowpea), 1:1 row-replacement intercrop, and 2:1 row-replacement intercrop, were compared for yield, land equivalent ratio (LER), and net profitability. The 2:1 intercrop arrangement (two cereal rows to one legume row) produced the highest LER at 1.42, meaning 42% more land would be needed under sole cropping to match the combined output achieved on the same area under this intercrop arrangement. Net profitability followed a similar ranking, with the 2:1 intercrop generating 31% higher net return per hectare than sole cereal cropping, driven by the combined value of cereal grain, legume grain, and reduced fertilizer requirement from the legume's nitrogen contribution. The 1:1 arrangement produced a slightly lower LER of 1.35 but showed the most balanced grain output between the two component crops, relevant for farming households prioritizing dietary diversity from their own harvest over pure profitability. These findings support row-replacement intercropping, and the 2:1 arrangement specifically where cereal grain commands the stronger market value, as a productivity- and profitability-positive alternative to sole cropping for pulse-cereal systems in this region.
Summary
Source-checkedPlain-language reading of the full paper, prepared with AI and checked against the text. Each point links to the authors' own words.
Why it matters
- Intercropping productivity depends on arranging cereal and legume crops to minimize competition for resources like light, water, and nutrients. View evidence ↗
- Cereal-legume systems specifically benefit from the legume's ability to fix nitrogen, which can support the growth of the neighboring cereal. View evidence ↗
The question
- The study aimed to compare sole cropping with two row-replacement intercrop arrangements to determine which provides the best combination of land-use efficiency and economic return. View evidence ↗
What they did
- The research was conducted over two seasons (April to August 2024 and 2025) at the Yamoussoukro Institute of Agricultural Sciences in Cote d'Ivoire. View evidence ↗
- The study used 'CI-Local 4' maize as the cereal and 'Yamoussoukro Bold' cowpea as the legume. View evidence ↗
- The experiment used a randomized block design with four replications testing four treatments: sole cereal, sole legume, a 1:1 row-replacement intercrop, and a 2:1 row-replacement intercrop. View evidence ↗
What they found
- The 2:1 intercrop arrangement achieved the highest land-use efficiency with an LER of 1.42. View evidence ↗
- The 2:1 intercrop was the most profitable, generating a 31% higher net return per hectare than sole cereal cropping (relative index of 131 vs 100). View evidence ↗
- The 1:1 arrangement provided a more balanced output between cereal (3277 kg/ha) and legume (479 kg/ha) grains than the 2:1 arrangement. View evidence ↗
- The LER advantage of the 2:1 intercrop was primarily driven by the cereal component's high partial LER of approximately 0.74. View evidence ↗
What it means
- A limitation of the study is that only two row-replacement ratios were tested; other ratios like 3:1 or 1:2 might be more optimal. View evidence ↗
- The profitability results are based on specific market prices from the study period and may change if relative crop prices shift. View evidence ↗
Visual summary
3 visualsIllustrations explain the paper; charts are replotted from the paper's own table values.
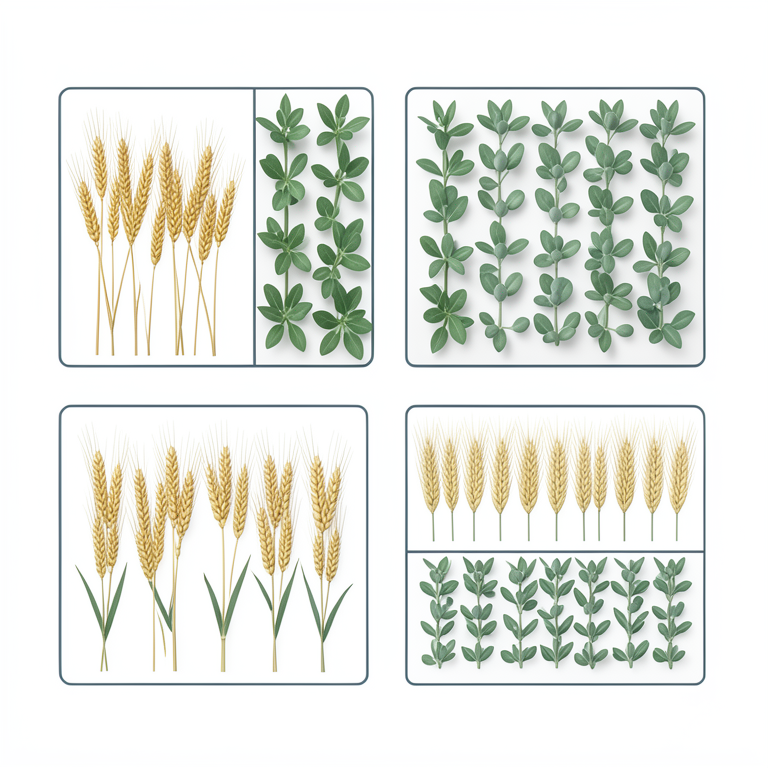
Row-Replacement Layouts
AI-generated conceptual illustration (cereal and legume crops in a field). It explains the idea and does not show study data.
View source evidence ↗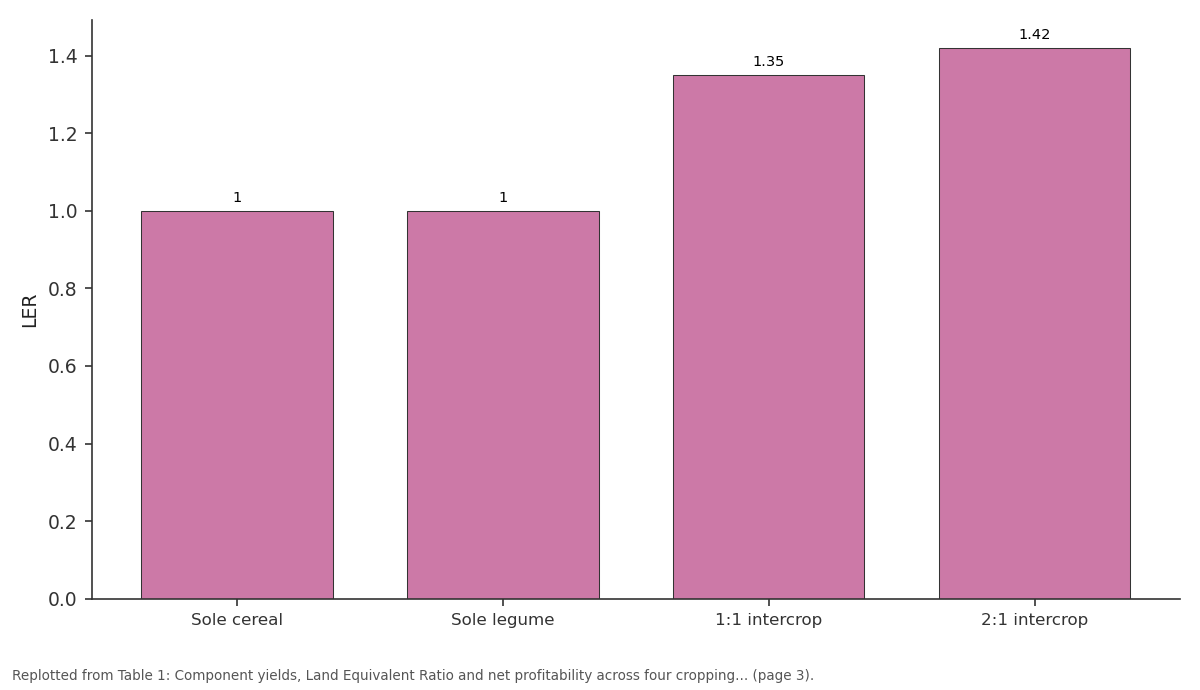
LER: Sole cereal vs Sole legume vs 1:1 intercrop vs 2:1 intercrop
Replotted from Table 1 (page 3) of the original paper. Every bar is the paper's own table value.
View source evidence ↗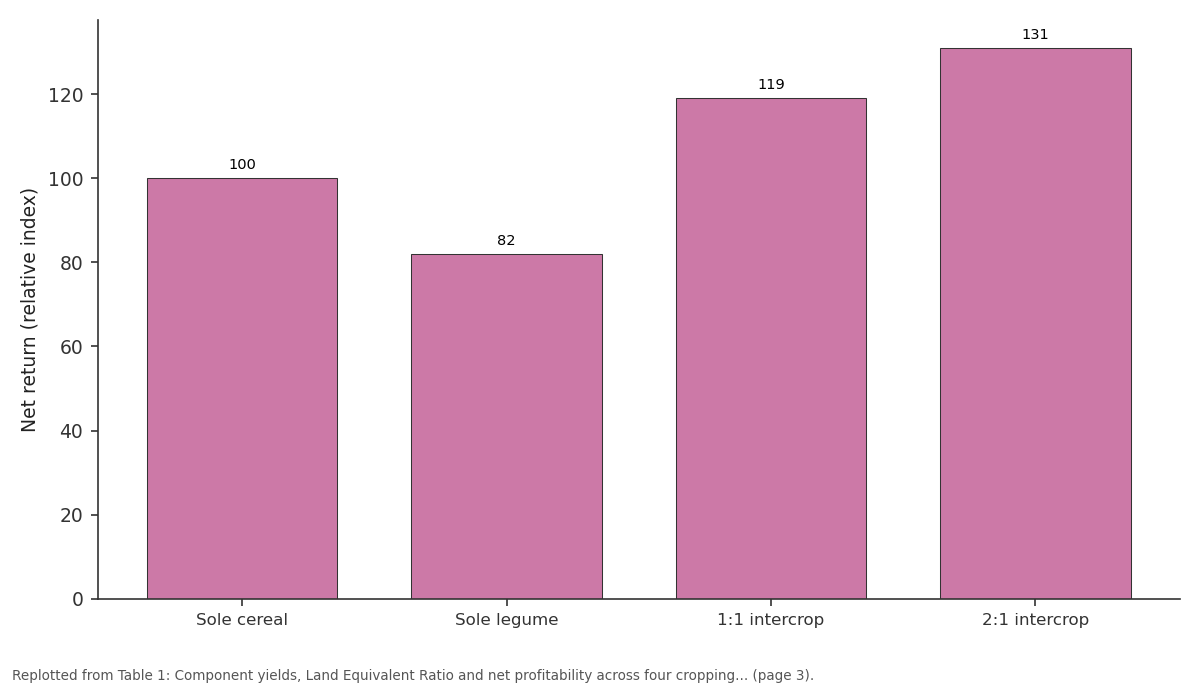
Net return (relative index): Sole cereal vs Sole legume vs 1:1 intercrop vs 2:1 intercrop
Replotted from Table 1 (page 3) of the original paper. Every bar is the paper's own table value.
View source evidence ↗Figures & tables
From the original paper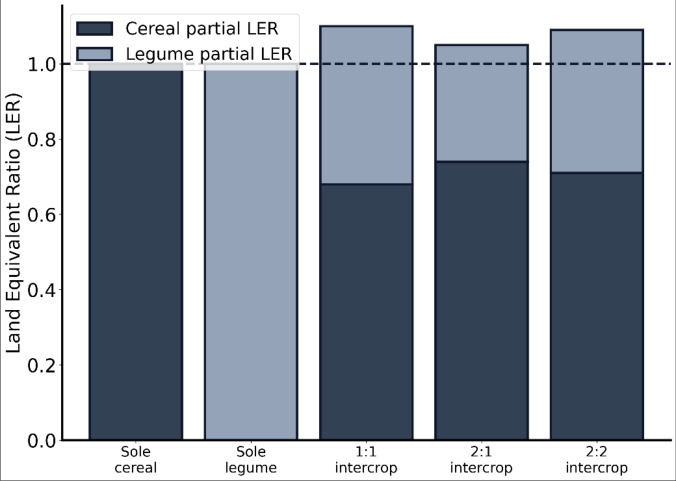 Figure 1
 Table 1
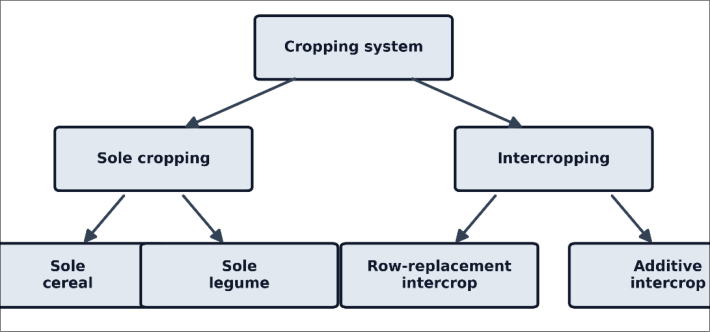 Figure 2
Introduction
A hectare of land does not care whether it grows one crop or two, but the plants sharing that hectare very much care about what else is competing with them for light, water, and nutrients at any given moment, and intercropping's productivity case rests entirely on whether cereal and legume components can be arranged to minimize that competition while each still captures resources the other leaves unused [1,2] . Land Equivalent Ratio has become the standard metric for quantifying this productivity advantage, expressing intercrop yield as a multiple of the sole-cropped land area that would be needed to match the same combined output, with values above 1.0 indicating a genuine land-use efficiency gain from growing the two crops together rather than separately [3] . Row arrangement, how many rows of each component crop are planted in what sequence, strongly influences how much of any potential intercropping advantage is actually realized, since arrangement determines both the degree of inter-species competition and how effectively each species accesses light and below-ground resources across the growing season [4,5] . Cereal-legume intercropping specifically benefits from an additional mechanism beyond simple resource partitioning: the legume component's nitrogen fixation can supply some nitrogen benefit to the neighboring cereal, either directly through root exudation and turnover or indirectly by reducing the legume's own draw on soil nitrogen that would otherwise compete with the cereal [6,7] . Profitability comparisons across intercropping arrangements receive somewhat less research attention than LER alone, despite profitability being the metric that most directly drives farmer adoption decisions, and the two metrics do not always align perfectly, since an arrangement with the highest LER is not automatically the one with the highest net return once relative crop prices and input cost differences are factored into the comparison [8,9] . This research set out to compare sole cropping against two row-replacement intercrop arrangements directly, assessing yield, LER, and net profitability together rather than LER in isolation, to identify which arrangement offers the strongest combined land-use efficiency and economic case for cerealcowpea intercropping under conditions typical of this region. Objectives were to quantify component and combined yield, LER, and net profitability across sole cereal, sole legume, 1:1 intercrop, and 2:1 intercrop arrangements, and to determine whether the arrangement with the highest LER also delivers the highest net return once relative market prices for the two component crops are incorporated into the comparison.
Materials and Methods
Materials and Methods
Study area description
The trial was conducted at the farming systems research farm of Yamoussoukro Institute of Agricultural Sciences A uniform basal fertilizer dose of 60:30:30 kg NPK per hectare was applied to sole cereal and both intercrop arrangements, while sole legume plots received only 15:30:30 kg NPK per hectare, reflecting standard local recommendations that reduce nitrogen for legume-only plots given the crop's nitrogen-fixing capacity.
Field experimental design
Four treatments, sole cereal (maize at full recommended population), sole legume (cowpea at full recommended population), 1:1 row-replacement intercrop (one maize row alternating with one cowpea row), and 2:1 row-replacement intercrop (two maize rows alternating with one cowpea row), were arranged in a randomized block design with four replications. Plot size was 6 m by 5 m with a 0.5 m buffer between plots. Row spacing was maintained at 75 cm for maize and 40 cm for cowpea within each arrangement, with total population per component adjusted according to the specific row-replacement ratio tested. Standard weed and pest management was applied uniformly across all plots.
Methods
Grain yield of each component crop was recorded separately from a net plot area of 15 m² in each arrangement. Land Equivalent Ratio was calculated as the sum of partial LERs for each component, where each partial LER equals the intercrop yield of that component divided by its sole-crop yield under the same management. Net profitability was calculated using prevailing local market prices for maize and cowpea grain, combined with actual input costs recorded for each treatment. Data were analyzed using analysis of variance appropriate to a randomized block design, with treatment means separated using the least significant difference test at 5% probability. The 2:1 arrangement's higher LER and net return relative to the 1:1 arrangement traces to its cereal-favoring row ratio, which better matches the local market price advantage cereal grain carries over cowpea in this area; the 1:1 arrangement produced a more even split between the two grains but at a modest cost to overall profitability given current relative prices.
Results
Results
Fig 2: Classification of cropping system arrangements evaluated in this research
Fig 2: Classification of cropping system arrangements evaluated in this research
Comprehensive interpretation
The gap between the 1:1 and 2:1 arrangements is instructive precisely because it is small in LER terms (1.35 versus 1.42) but more consequential in profitability terms (119 versus 131 on the relative index), illustrating that LER alone does not fully capture which arrangement a profit-motivated farmer would prefer. A household prioritizing dietary diversity or reduced market dependence for legume protein might reasonably choose the 1:1 arrangement despite its slightly lower LER and profitability, given its more balanced grain output; a household prioritizing cash income would more clearly favor the 2:1 arrangement. This distinction matters for how extension recommendations should be framed, since a single blanket recommendation risks not matching a specific household's actual priority.
Discussion
The LER values recorded here, 1.35 and 1.42 for the two intercrop arrangements, sit within the range commonly reported for cereal-legume intercropping research generally, where LER values between 1.2 and 1.5 are typical, though values above 1.5 have been reported under especially favorable complementary resource-use conditions between component species [1,10] . The land-use efficiency gain recorded in this research likely reflects both spatial complementarity, the two species drawing on somewhat different rooting depths and canopy architecture, and the nitrogen benefit the cowpea component provided to the neighboring cereal rows, consistent with nitrogen transfer mechanisms documented in other cereal-legume intercropping systems [6,11] . The row-ratio effect on profitability recorded here, favoring the cereal-heavier 2:1 arrangement given current relative market prices, is a pattern likely to shift if relative crop prices change, and this sensitivity to price is a genuine limitation of any single-season or single-price-point profitability comparison [8,12] . Extension recommendations built on this research's specific price conditions should be revisited periodically as maize and cowpea market prices in this region evolve, since a large enough shift in relative prices could plausibly reverse which row arrangement delivers the higher net return even if the underlying LER relationship between arrangements remains stable. Total intercrop yield falling short of the sum of both solecrop yields, despite the LER exceeding 1.0, reflects the standard trade-off intercropping research consistently documents: individual component yields per unit area decline under intercropping relative to sole cropping of that same component, and the land-use efficiency gain comes from combining two moderately reduced yields on the same land rather than from either component matching its solecrop yield potential while sharing space with the other [9,13] . This distinction matters for how the intercropping advantage should be communicated to farmers, since a farmer focused narrowly on cereal yield alone would see intercropping as a yield reduction rather than the overall land-use gain the combined LER metric actually captures, a gap in perception noted as a recurring adoption barrier in reviews of intercropping uptake among smallholder farmers [14] .
Limitations
This research tested only two row-replacement ratios alongside sole cropping, and additional ratios, such as 3:1 or 1:2, might reveal a different optimal arrangement than either tested here. Profitability calculations relied on a single set of prevailing market prices recorded during the two research seasons, and the ranking between arrangements could shift under different relative price conditions between the two component crops. Testing this comparison across a wider range of soil fertility conditions would help establish how consistently the nitrogen transfer benefit contributing to the LER advantage holds across different baseline soil nitrogen status.
Conclusion
The main contribution of this research is a direct comparison of sole cropping against two row-replacement cereal-cowpea intercrop arrangements, showing that both intercrop arrangements achieved land-use efficiency gains, with Land Equivalent Ratio values of 1.35 and 1.42, and that the cereal-favoring 2:1 arrangement delivered the strongest combined land-use and profitability advantage under this research's specific market price conditions. Supporting evidence came from consistent yield, LER, and profitability rankings across two cropping seasons, alongside a clear illustration that LER and profitability, while related, do not track each other perfectly once relative crop prices enter the comparison. For farming households in this region, these findings support row-replacement cereallegume intercropping as a genuinely productivity-and profitability-positive alternative to sole cropping, with the specific row ratio choice reasonably tailored to whether a household's priority sits closer to cash income or dietary diversity from its own harvest. Open questions remain around how these findings hold under different relative cereal-legume price conditions, and whether additional row ratios beyond the two tested here could further improve on the land-use efficiency and profitability results recorded.
Acknowledgement
Acknowledgements Contributions not qualifying for authorshipThe authors acknowledge the farming systems research farm staff of Yamoussoukro Institute of Agricultural Sciences for field maintenance support across both research seasons.
Figures and tables from the paper
| Arrangement | Cereal yield (kg/ha) | Legume yield (kg/ha) | LER | Net return (relative index) |
|---|---|---|---|---|
| Sole cereal | 4820 | 0 | 1.00 | 100 |
| Sole legume | 0 | 1140 | 1.00 | 82 |
| 1:1 intercrop | 3277 | 479 | 1.35 | 119 |
| 2:1 intercrop | 3567 | 353 | 1.42 | 131 |
| LSD (p = 0.05) | 142 | 38 | 0.06 | - |
Table text extracted from the original PDF; superscript letters are shown inline. The original table image is below.
View original table image
References
13 in the original paper- Willey RW. Intercropping: its importance and research needs. Field Crop Abstr. 2019;32(1):1-10.
- Vandermeer J. The Ecology of Intercropping. 1 st Ed. Cambridge: Cambridge University Press; 2021. p. 1237.
- Mead R, Willey RW. The concept of a land equivalent ratio and advantages in yields from intercropping. Exp Agric. 2022;16(3):217-228.
- Ofori F, Stern WR. Cereal-legume intercropping systems. Adv Agron. 2020;41:41-90.
- Trenbath BR. Biomass productivity of mixtures. Adv Agron. 2021;26:177-210.
- Fujita K, Ofosu-Budu KG, Ogata S. Biological nitrogen fixation in mixed legume-cereal cropping systems. Plant Soil. 2022;141(1-2):155-175.
- Giller KE. Nitrogen Fixation in Tropical Cropping Systems. 2 nd ed. Wallingford: CAB International; 2021. p. 1-423.
- Rao MR, Willey RW. Evaluation of yield stability in intercropping: studies on sorghum-pigeonpea. Exp Agric. 2020;16(2):105-116.
- Francis CA. Multiple Cropping Systems. 1 st Ed. New York: Macmillan Publishing; 2023. p. 1-383.
- Dhima KV, Lithourgidis AS, Vasilakoglou IB, Dordas CA. Competition indices of common vetch and cereal intercrops in two seeding ratios. Field Crops Res. 2022;100(2-3):249-256.
- Fukai S, Trenbath BR. Processes determining intercrop productivity and yields of component crops. Field Crops Res. 2023;34(3-4):247-271.
- Ghosh PK. Growth, yield, competition and economics of groundnut/cereal fodder crops grown in additive series intercropping systems. Field Crops Res. 2024;88(2-3):227-237.
- Lithourgidis AS, Dordas CA, Damalas CA, Vlachostergios DN. Annual intercrops: an alternative pathway for sustainable agriculture. Aust J Crop Sci. 2021;5(4):396-410.