
Research article · 2026 · Full text
International Journal of Biology SciencesEstimation of revenue potential from fish scale waste-derived biofertilizer in major fish markets of Nanded city, Maharashtra, India
Volume 8(6) · Pages 96–99 · DOI: 10.33545/26649926.2026.v8.i6b.864 ↗
Research areasWaste Management and RecyclingComposting and Vermicomposting TechniquesAgriculture, Plant Science, Crop Management
Abstract
Author-writtenFish scale waste is one of the most neglected by-products generated in fish markets and is commonly discarded without economic utilization. This study estimated the potential revenue that could be generated through the conversion of fish scale waste into biofertilizer in three major fish markets in Nanded City, Maharashtra, namely, Taroda Fish Market, Itwara Fish Market, and Friday Fish Market. Data on fish scale wastage were obtained from a year-long survey conducted from January 2024 to December 2024. The annual fish scale waste generated was estimated to be 4,734 kg in Taroda Market, 3,954 kg in Itwara Market, and 1,530 kg in Friday Fish Market, resulting in a total annual generation of 10,218 kg. Assuming a conversion efficiency of 90%, the total biofertilizer production potential was estimated to be 9,197 kg. Considering a conservative market value of ₹20 per kilogram of biofertilizer, the projected annual revenue was ₹183,940. This study highlights the economic and environmental benefits of fish scale waste valorization and demonstrates its potential as a sustainable waste management strategy for fish markets.
Summary
Source-checkedPlain-language reading of the full paper, prepared with AI and checked against the text. Each point links to the authors' own words.
Why it matters
- Improperly disposing of fish scales leads to environmental pollution, bad odors, and microbial contamination, while increasing the costs of waste management. View evidence ↗
- Fish scales are suitable for making fertilizer because they contain valuable components such as collagen, hydroxyapatite, calcium phosphate, nitrogenous compounds, and trace minerals. View evidence ↗
- Biofertilizers derived from fish waste are noted for their ability to improve soil fertility and nutrient availability, supporting sustainable agriculture. View evidence ↗
The question
- The study aimed to estimate the potential revenue from converting fish scale waste into biofertilizer using data from major fish markets in Nanded City. View evidence ↗
What they did
- Data collection was carried out through a survey spanning from January 2024 to December 2024. View evidence ↗
- Waste generation data were gathered using direct market observations, interviews with vendors, and measurements of waste during fish cleaning. View evidence ↗
- To estimate biofertilizer yield, the authors assumed a 90% conversion efficiency to account for losses during stabilization, drying, and composting. View evidence ↗
- Revenue projections were based on a conservative market price of ₹20 per kilogram of biofertilizer. View evidence ↗
What they found
- Annual fish scale waste generation was highest at Taroda Fish Market (4,734 kg), followed by Itwara (3,954 kg) and Friday Fish Market (1,530 kg). View evidence ↗
- The total annual generation of fish scale waste across the three markets was estimated at 10,218 kg. View evidence ↗
- The combined annual production potential for biofertilizer from all three markets was estimated at 9,197 kg. View evidence ↗
- Based on a price of ₹20/kg, the projected annual revenue from the produced biofertilizer was ₹183,940. View evidence ↗
- Revenue projections increased with market price, ranging from ₹183,940 at ₹20/kg to ₹459,850 at ₹50/kg. View evidence ↗
What it means
- A limitation of the study is that it relied on projected estimates instead of actual biofertilizer production. View evidence ↗
- The authors suggest that future work should include nutrient characterization, product quality assessment, and pilot-scale processing to validate commercial feasibility. View evidence ↗
Visual summary
3 visualsIllustrations explain the paper; charts are replotted from the paper's own table values.
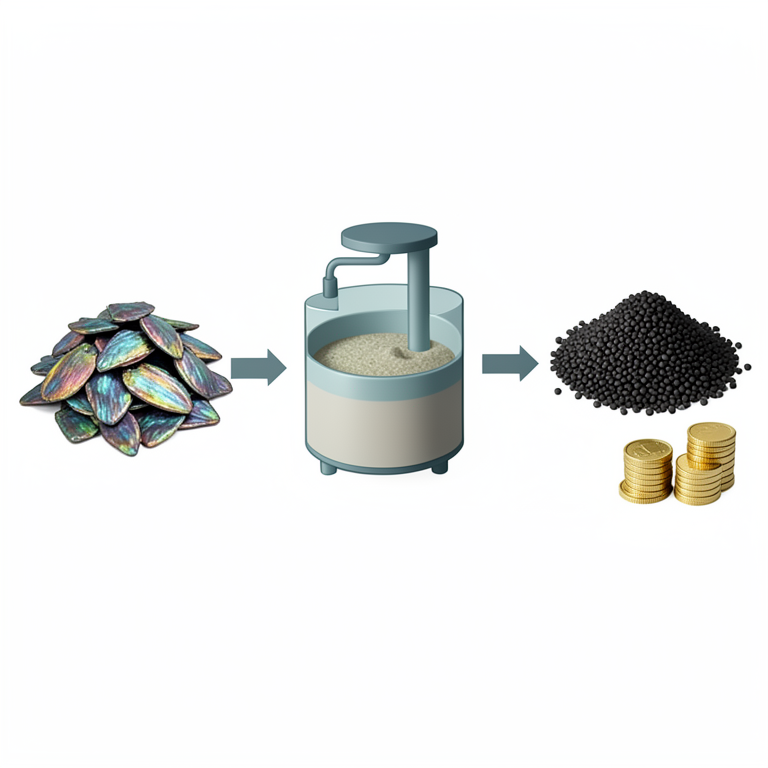
Waste-to-Revenue Flowchart
AI-generated conceptual illustration (fish scales and organic biofertilizer). It explains the idea and does not show study data.
View source evidence ↗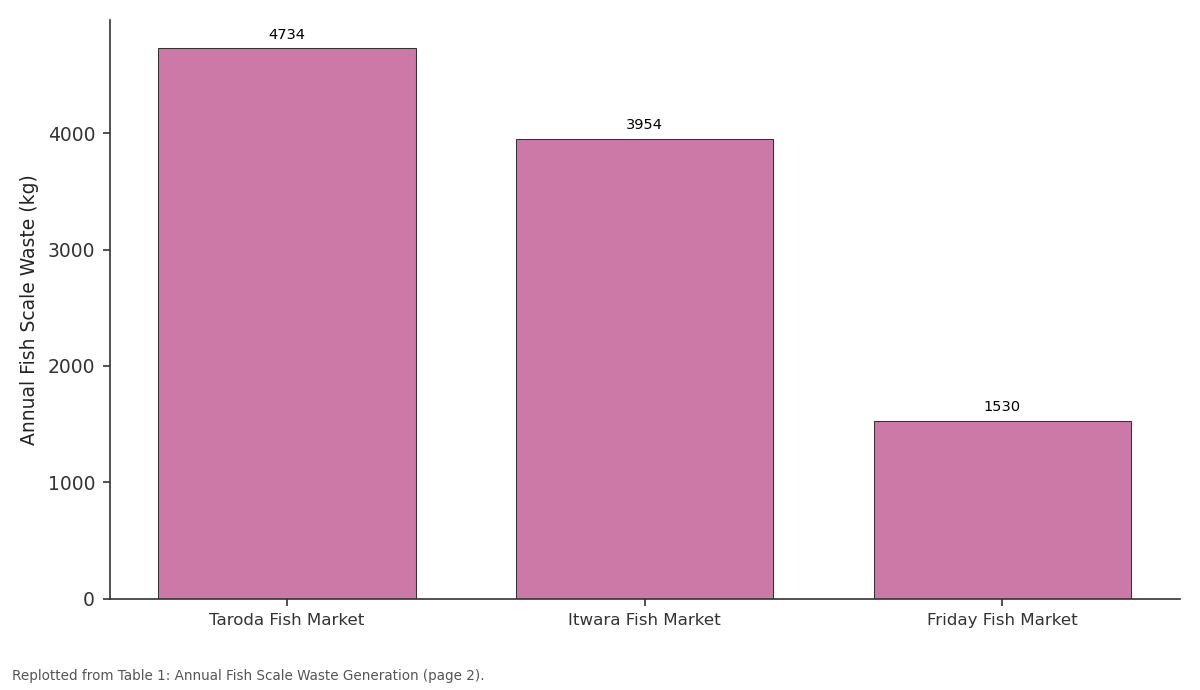
Annual Fish Scale Waste (kg): Taroda Fish Market vs Itwara Fish Market vs Friday Fish Market
Replotted from Table 1 (page 2) of the original paper. Every bar is the paper's own table value.
View source evidence ↗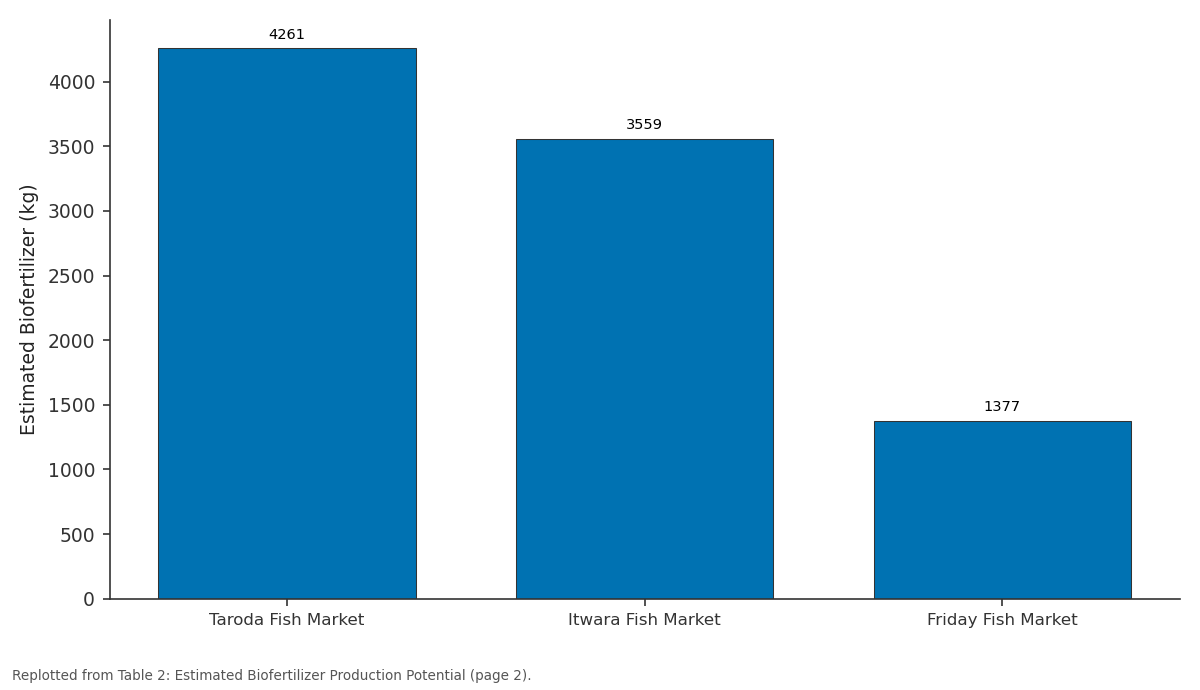
Estimated Biofertilizer (kg): Taroda Fish Market vs Itwara Fish Market vs Friday Fish Market
Replotted from Table 2 (page 2) of the original paper. Every bar is the paper's own table value.
View source evidence ↗Figures & tables
From the original paper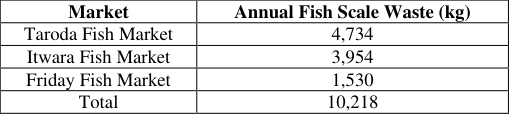 Table 1
 Table 2
 Table 3
 Table 4
Introduction
The fisheries sector plays a crucial role in food security, nutrition, and livelihood generation in India (Singh et al., 2024; Beraki et al, 2022) [23,8] . With the rise in fish consumption and commercialization, substantial quantities of waste are generated during fish handling, processing, and marketing activities (De Ungria et al., 2023) [6] . Fish waste generally consists of scales, skin, bones, fins, heads, viscera, and other discarded materials that are not consumed (Padma et al., 2024) [15] . These wastes often constitute 30-60% of the total fish biomass, depending on the species and processing methods (Ling Wen Xia et al., 2024) [12] . these markets (Mangal et al., 2023) [14] . Despite their potential value, these scales are currently discarded without any organized utilization process (Bahariniya et al., 2021) [4] . Estimating the economic potential of fish scale waste can provide scientific evidence for establishing community-level waste processing units and encourage sustainable resourcerecovery initiatives (Padma et al., 2024) [15] . The present study aimed to estimate the potential revenue that could be generated by converting fish scale waste into biofertilizer, using annual fish scale wastage data collected from major fish markets in Nanded City (Balkhande & Issak, 2024) [24] .
Objectives
The objectives of this study were as follows:
Study Area
The study was conducted in three major fish markets in Nanded City, Maharashtra:
Taroda Fish Market
The Taroda Fish Market serves a large urban and peri-urban population and handles substantial quantities of freshwater fish, including Rohu, Catla, Mrigal, Tilapia, etc.
Itwara Fish Market
The Itwara Fish Market is one of the oldest fish markets in Nanded and acts as a central fish distribution hub.
Friday Fish Market
The Friday Fish Market operates weekly and attracts vendors from surrounding villages and nearby districts.
Study Duration
The survey was conducted from January 2024 to December 2024.
Data Collection
Data on fish scale waste generation were obtained through direct market observations, vendor interviews, and measurements of fish waste produced during fish-cleaning and processing activities (Asiamah et al., 2022) [2] . Monthly observations were compiled to estimate the annual generation of fish scale waste (Silvert & Sowles, 1996) [21] .
Estimation of Biofertilizer Production
This study did not involve the actual production of biofertilizers. Instead, the revenue potential was estimated based on the theoretical conversion of fish scale waste into biofertilizer (Alvarado-Ramírez et al., 2023) [1] . A conversion efficiency of 90% was assumed to account for processing losses during composting, drying, and stabilization (Sayara et al., 2020) [20] .
Formula
Biofertilizer Yield (kg) = Fish Scale Waste (kg) × 0.90 Biofertilizer Yield (kg) = Fish Scale Waste (kg) × 0.90 3.5 Revenue Estimation The projected revenue was calculated using a conservative market price of 20 per kilogram ₹ of biofertilizer. Formula Estimated Revenue () = Biofertilizer Yield (kg) × Selling Price (kg ¹) ₹ ₹ ⁻
Revenue Estimation
The projected revenue was calculated using a conservative market price of 20 per kilogram ₹ of biofertilizer. The survey revealed that the Taroda Fish Market produced the highest quantity of fish scale waste (4,734 kg/year), followed by the Itwara Fish Market (3,954 kg/year) and the Friday Fish Market (1,530 kg/year). The projected biofertilizer production from all markets combined was estimated to be 9,197 kg annually. The Taroda Fish Market contributed the highest projected annual revenue, followed by Itwara Fish Market and Friday Fish Market. The projected revenue increased proportionally with the increasing market value of the biofertilizer product.
Results
Results
Discussion
The findings of the present study indicate that fish scale waste generated in Nanded fish markets represents a valuable bioresource with significant economic potential (Balkhande & Issak, 2024) [23] . Although fish scales are generally treated as waste, their nutrient-rich composition makes them suitable for conversion into organic fertilizers (Junianto et al., 2022) [11] . The estimated annual production of 9,197 kg of biofertilizer demonstrates that even moderate quantities of fish scale waste can be transformed into marketable products (Alvarado-Ramírez et al., 2023) [1] . The estimated annual revenue of 183,940, obtained under conservative assumptions, ₹ underscores the feasibility of waste valorization initiatives (Dhar et al., 2021) [9] . Similar studies have reported the successful use of fish processing waste in the production of compost, organic fertilizers, and agricultural amendments (Devi et al., 2024) [8] . The conversion of fish waste into biofertilizers not only reduces environmental pollution but also contributes to resource recovery and the principles of a circular economy (Mahari, 2024) [13] .
The Taroda Fish Market demonstrated the highest revenue generation potential due to its larger volume of fish trade and waste production. If organized collection systems and decentralized processing units are established, fish vendors and local entrepreneurs can benefit from additional income sources (H. Singh et al., 2024). Additionally, biofertilizer production could reduce dependence on chemical fertilizers and promote sustainable agricultural practices in the region (Dutta et al. 2024) [5] . This study relied on projected estimates rather than actual biofertilizer production. Future studies should focus on pilot-scale processing, nutrient characterization, product quality assessment, market acceptance, and cost-benefit analyses to validate the commercial feasibility of fish scalebased biofertilizers.
Environmental Implications
The utilization of fish scale waste offers several environmental advantages:
Conclusion
The present study demonstrates that fish scale waste generated in major fish markets in Nanded City possesses substantial economic and environmental value. The total annual fish scale waste generation of 10,218 kg was estimated from the Taroda Fish Market, Itwara Fish Market, and Friday Fish Market. Assuming a conversion efficiency of 90%, approximately 9,197 kg of biofertilizer could potentially be produced annually. At a conservative selling price of 20 per ₹ kilogram, the projected annual revenue was estimated at 183,940. ₹ The findings indicate that valorizing fish scale waste can serve as a sustainable waste management strategy while ultaneously creating economic opportunities for fish vendors, waste collectors, and local entrepreneurs. Establishing small-scale biofertilizer production units in Nanded could contribute to environmental sustainability, resource recovery, and the enhancement of rural livelihoods.
Figures and tables from the paper
| Market | Annual Fish Scale Waste (kg) |
|---|---|
| Taroda Fish Market | 4,734 |
| Itwara Fish Market | 3,954 |
| Friday Fish Market | 1,530 |
| Total | 10,218 |
Table text extracted from the original PDF; superscript letters are shown inline. The original table image is below.
View original table image
| Market | Fish Scale Waste (kg) | Conversion Efficiency (%) | Estimated Biofertilizer (kg) |
|---|---|---|---|
| Taroda Fish Market | 4,734 | 90 | 4,261 |
| Itwara Fish Market | 3,954 | 90 | 3,559 |
| Friday Fish Market | 1,530 | 90 | 1,377 |
| Total | 10,218 | 90 | 9,197 |
Table text extracted from the original PDF; superscript letters are shown inline. The original table image is below.
View original table image
| Market | Biofertilizer Yield (kg) | Price (₹ kg⁻¹) | Estimated Revenue ($₹$) |
|---|---|---|---|
| Taroda Fish Market | 4,261 | 20 | 85,220 |
| Itwara Fish Market | 3,559 | 20 | 71,180 |
| Friday Fish Market | 1,377 | 20 | 27,540 |
| Total | 9,197 | 20 | 183,940 |
Table text extracted from the original PDF; superscript letters are shown inline. The original table image is below.
View original table image
| Selling Price (₹ kg-1) | Estimated Annual Revenue (₹) |
|---|---|
| 20 | 183,940 |
| 30 | 275,910 |
| 40 | 367,880 |
| 50 | 459,850 |
Table text extracted from the original PDF; superscript letters are shown inline. The original table image is below.
View original table image
References
24 in the original paper- Alvarado-Ramírez L, Santiesteban-Romero B, Poss G, Sosa-Hernández JE, Iqbal HMN, Parra-Saldívar R, Bonaccorso AD, Melchor-Martínez EM. Sustainable production of biofuels and bioderivatives from aquaculture and marine waste. Frontiers in Chemical Engineering. 2023;4. https://doi.org/10.3389/fceng.2022.1072761
- Asiamah A, Oduro-Yeboah C, Mboom F, Atter A, Idun-Acquah N, Nkansah J. Assessment of the volume of seafood waste generation, utilization and management system from selected seafood processing companies in Ghana: A case study. African Journal of Food, Agriculture, Nutrition and Development. 2022;22(112):20924-20941. https://doi.org/10.18697/ajfand.112.21745
- Babcock-Jackson L, Konovalova T, Krogman JP, Bird R, Díaz LL. Sustainable Fertilizers: Publication Landscape on Wastes as Nutrient Sources, Wastewater Treatment Processes for Nutrient Recovery, Biorefineries, and Green Ammonia Synthesis. Journal of Agricultural and Food Chemistry. 2023;71(22):82658296. https://doi.org/10.1021/acs.jafc.3c00454
- Bahariniya S, Ezatiasar M, Madadizadeh F. A Brief Review of the Types of Validity and Reliability of scales in Medical Research. Journal of Community Health Research. 2021;10(2). https://doi.org/10.18502/jchr.v10i2.6582
- Dutta S, Hazra A, Paul I, Mitra N. Exploring the current consumer market status of chemical fertilizer vs. biofertilizer industries in West Bengal, India: an on-site investigation. South Asian J Agric Sci. 2024;4(1):147153. doi:10.22271/27889289.2024.v4.i1b.124.
- De Ungria ST, Fernandez LTT, Sabado SEF, Santos JPE, Sararaña ARB, Vincecruz-Abeledo CC. How is fish market waste managed in the Philippines? Environmental Science and Pollution Research. 2023;30(17):49512-49522. https://doi.org/10.1007/s11356-023-25882-0
- Devi NL, Singh AH, Nongthombam J, Kumar S, Chaudhary KP. Fish Waste Compost -A Fertilizer for Organic Agriculture. Journal of Experimental Agriculture International. 2024;46(11):778-785. https://doi.org/10.9734/jeai/2024/v46i113098
- Beraki T, Zerom H, Arefe T, Goitom M, Yemane A. Report of mass fish mortality along the Eritrean coast and islands. Acta Entomol Zool. 2022;3(2):36-39. DOI:10.33545/27080013.2022.v3.i2a.74.
- Dhar S, Singh R, Shrivastava M, Sangwan S. Waste to Wealth: Innovative Ideas and Technological Initiatives. International Journal of Biology Sciences https://www.biologyjournal.net CRC Press; 2021. p. 581-593. https://doi.org/10.1201/9781003245384-33
- Gedam A, Amrawkar R, Dongare V. Fish Marketing System in Aurangabad District (Maharashtra). International Journal of Advanced Research in Science, Communication and Technology. 2023;204-206. https://doi.org/10.48175/ijarsct-8141
- Junianto J, Shabastiano HM, Aulia LN, Hadiana F, Rahmaniar A. Utilization of Fish Scales for Non-Food Products: A Review. Asian Journal of Fisheries and Aquatic Research. 2022;20(5):45-50. https://doi.org/10.9734/ajfar/2022/v20i5508
- Ling Wen Xia F, Supri S, Djamaludin H, Nurdiani R, Leong Seng L, Wee Yin K, Rovina K. Turning waste into value: Extraction and effective valorization strategies of seafood by-products. Waste Management Bulletin. 2024;2(3):84-100. https://doi.org/10.1016/j.wmb.2024.06.008
- Mahari W. AQUACULTURE WASTES AS A RESOURCE: AN OVERVIEW. Planetary Sustainability. 2024;2(2). https://doi.org/10.46754/ps.2024.07.004
- Mangal S, Ranjan G, Gupta SD, Ray M. Fish scales: Waste processing as a potential source of bioactive compounds. FLORA AND FAUNA. 2023;29(2):313320. https://doi.org/10.33451/florafauna.v29i2pp313320
- Padma KR, Anjum MR, Sankari M, Don KR, Nakka S, Harathi K, Sirisha T. Transforming Fish Waste into High-value Resources: A Sustainable Approach to Circular Bioeconomy. UTTAR PRADESH JOURNAL OF ZOOLOGY. 2024;45(23):48-59. https://doi.org/10.56557/upjoz/2024/v45i234685
- Rigueto CVT, De Oliveira R, Gomes KS, Alessandretti I, Nazari MT, Rosseto M, Krein DDC, Loss RA, Dettmer A. From waste to value-added products: A review of opportunities for fish waste valorization. Environmental Quality Management. 2023;33(1):203221. https://doi.org/10.1002/tqem.22040
- Safronova T, Vorobyov V, Kildeeva N, Shatalova T, Toshev O, Filippov Y, Dmitrienko A, Gavlina O, Chernega O, Nizhnikova E, Akhmedov M, Kukueva E, Lyssenko K. Inorganic Powders Prepared from Fish Scales. Ceramics. 2022;5(3):484-498. https://doi.org/10.3390/ceramics5030037
- Sameer MS. From Waste To Wealth: The Potential Of Fish-Based Fertilizers In Crop Production. Journal of Survey in Fisheries Sciences. 2023;10(3):705-709. https://doi.org/10.53555/sfs.v10i3.3116
- Sayara T, Basheer-Salimia R, Hawamde F, Sánchez A. Recycling of Organic Wastes through Composting: Process Performance and Compost Application in Agriculture. Agronomy. 2020;10(11):1838. https://doi.org/10.3390/agronomy10111838
- Silvert W, Sowles JW. Modelling environmental impacts of marine finfish aquaculture. Journal of Applied Ichthyology. 1996;12(2):75-81. https://doi.org/10.1111/j.1439-0426.1996.tb00066.x
- Singh A, Surasani VKR. Fish processing: An entrepreneurial opportunity for livelihood and income generation. Journal of Krishi Vigyan. 2020;9(1):144149. https://doi.org/10.5958/2349-4433.2020.00151.8
- Singh H, Ranjan D, Verma P, Upadhyay AK, Kumar P, Singh A. Current Issues with Fish and Fisheries Sector: Challenges and Solutions. Biotica Research Today. 2024;6(1):39-45. https://doi.org/10.54083/biorestoday/6.1.2024/39-45
- Abioye OM, Olasehinde DA, Abadunmi T. The Role of Biofertilizers in Sustainable Agriculture: An EcoFriendly Alternative to Conventional Chemical Fertilizers. Applied Science and Engineering Progress. 2023. https://doi.org/10.14416/j.asep.2023.07.001
- Balkhande JV, Issak SA. Fish waste to priceless asset a survey of fish waste from fish markets of Nanded city, Nanded (MS) India. FLORA AND FAUNA. 2024;30(2):375-379.