
Research article · 2026 · Full text
International Journal of Agriculture and NutritionEffect of deficit irrigation on water productivity and yield attributes of maize
Volume 8(1) · Pages 102–106 · DOI: 10.33545/26646064.2026.v8.i1b.675 ↗
Research areasIrrigation Practices and Water ManagementCrop Yield and Soil FertilityRice Cultivation and Yield Improvement
Abstract
Author-writtenWater productivity, not simply water availability, is the metric increasingly setting the ceiling on irrigated maize expansion across water-scarce farming regions. A field research over two consecutive dry seasons at Lusaka tested four irrigation levels, 100%, 80%, 60%, and 40% of crop evapotranspiration (ETc), to determine their combined effect on grain yield, yield components, and water productivity of maize. Full irrigation (100% ETc) produced the highest grain yield at 7860 kg per hectare, but water productivity peaked instead at 80% ETc, reaching 1.42 kg per cubic meter of water applied against 1.21 kg per cubic meter under full irrigation. Yield fell by 24% under 60% ETc and by 45% under 40% ETc relative to full irrigation, with the steepest yield losses concentrated in kernel number per cob rather than kernel weight, pointing to the silking and pollination window as the growth stage most sensitive to water deficit. Harvest index declined progressively as irrigation level decreased, falling from 42.6% under full irrigation to 31.8% under the most severe deficit treatment. These results identify 80% ETc as a water productivity optimum that sacrifices only a modest yield margin for a meaningful gain in water use efficiency, a trade-off directly relevant for irrigation scheme managers allocating water across competing demands during dry seasons when full irrigation supply cannot be guaranteed for every scheme member.
Summary
Source-checkedPlain-language reading of the full paper, prepared with AI and checked against the text. Each point links to the authors' own words.
Why it matters
- In water-scarce regions, the expansion of irrigated maize is increasingly limited by water productivity rather than just the availability of water. View evidence ↗
- Maize is widely grown under irrigation in southern Africa because it is more reliable than rainfed production, although it requires significant amounts of water. View evidence ↗
- Previous research suggests that maize is most sensitive to water stress during the silking and pollination stages compared to other growth phases. View evidence ↗
The question
- The study aimed to determine which of four irrigation levels maximizes water productivity and to identify whether kernel number or kernel weight is the primary driver of yield loss under water deficit. View evidence ↗
What they did
- The experiment was conducted in Lusaka, Zambia, over two consecutive dry seasons from May to September in 2023 and 2024. View evidence ↗
- The researchers used a randomized block design with four replications to test four irrigation levels: 100%, 80%, 60%, and 40% of crop evapotranspiration (ETc). View evidence ↗
- The study used the 'ZM-Lusaka 623' maize hybrid, which has a growing period of approximately 135 days. View evidence ↗
- At physiological maturity, the researchers measured grain yield, kernel number per cob, hundred-kernel weight, and the harvest index. View evidence ↗
What they found
- The highest grain yield of 7860 kg per hectare was achieved under full irrigation (100% ETc). View evidence ↗
- Water productivity was higher at 80% ETc (1.42 kg/m³) than under full irrigation (1.21 kg/m³). View evidence ↗
- Compared to full irrigation, grain yield decreased by 24% at 60% ETc and by 45% at 40% ETc. View evidence ↗
- The decline in yield was primarily driven by a 41.8% reduction in kernel number per cob, while hundred-kernel weight only decreased by 10% when comparing full irrigation to 40% ETc. View evidence ↗
- At 80% ETc, water productivity increased by 17.4% and water use decreased by 22.9%, with only a modest yield loss of 9.4% compared to full irrigation. View evidence ↗
- The 80% ETc treatment provided the highest net economic return per hectare because the water cost savings outweighed the small loss in yield. View evidence ↗
What it means
- The authors recommend 80% ETc as the optimal irrigation level for water-constrained schemes, as it balances water productivity and economic return with minimal yield loss. View evidence ↗
- The study applied water deficits uniformly across the season; the authors note that future research should test stage-specific deficits to see if avoiding stress during the silking window improves results. View evidence ↗
- The findings are limited by the use of a single site, two seasons, and one maize hybrid, meaning results may vary with different soils, climates, or hybrids. View evidence ↗
Visual summary
3 visualsIllustrations explain the paper; charts are replotted from the paper's own table values.
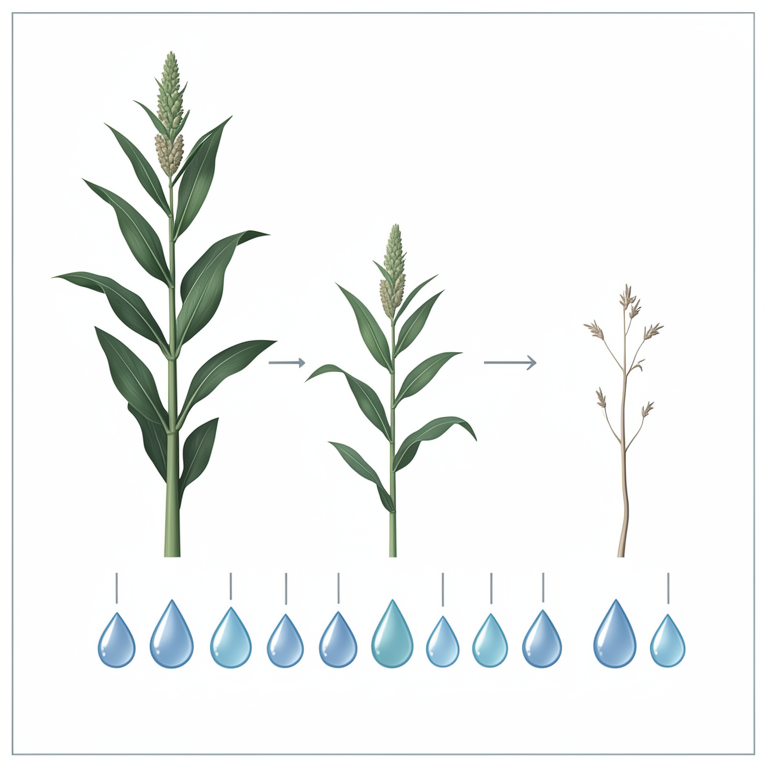
Trade-off between Yield and Water Productivity
AI-generated conceptual illustration (maize plants). It explains the idea and does not show study data.
View source evidence ↗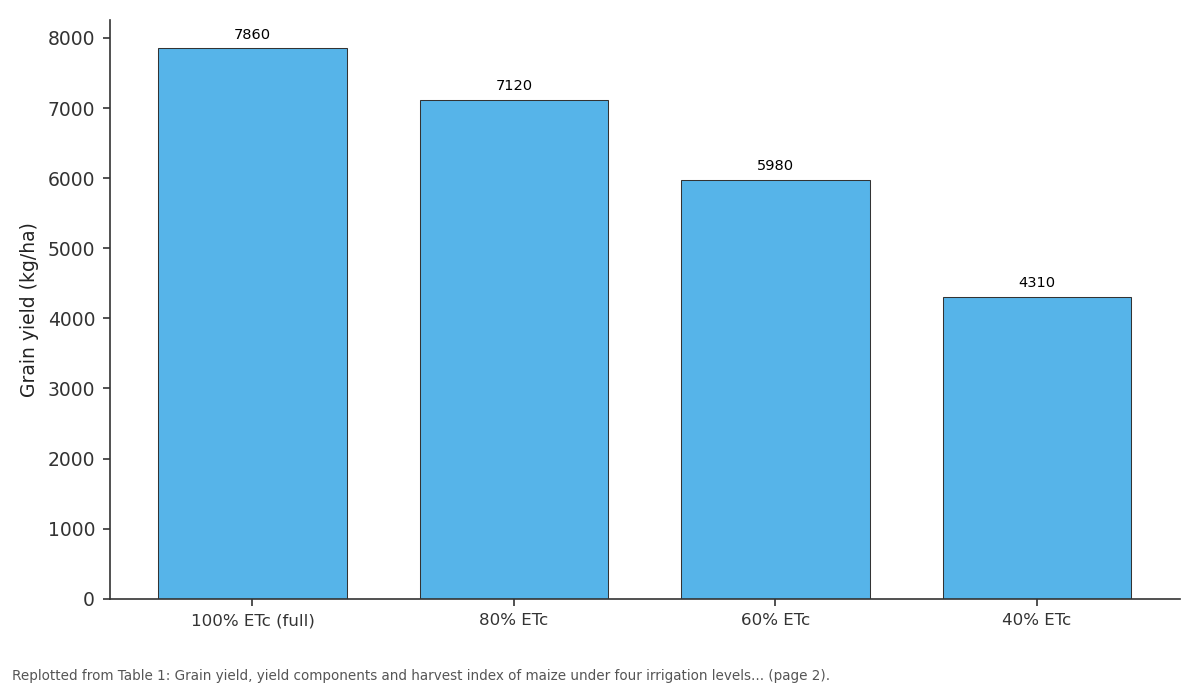
Grain yield (kg/ha): 100% ETc (full) vs 80% ETc vs 60% ETc vs 40% ETc
Replotted from Table 1 (page 2) of the original paper. Every bar is the paper's own table value.
View source evidence ↗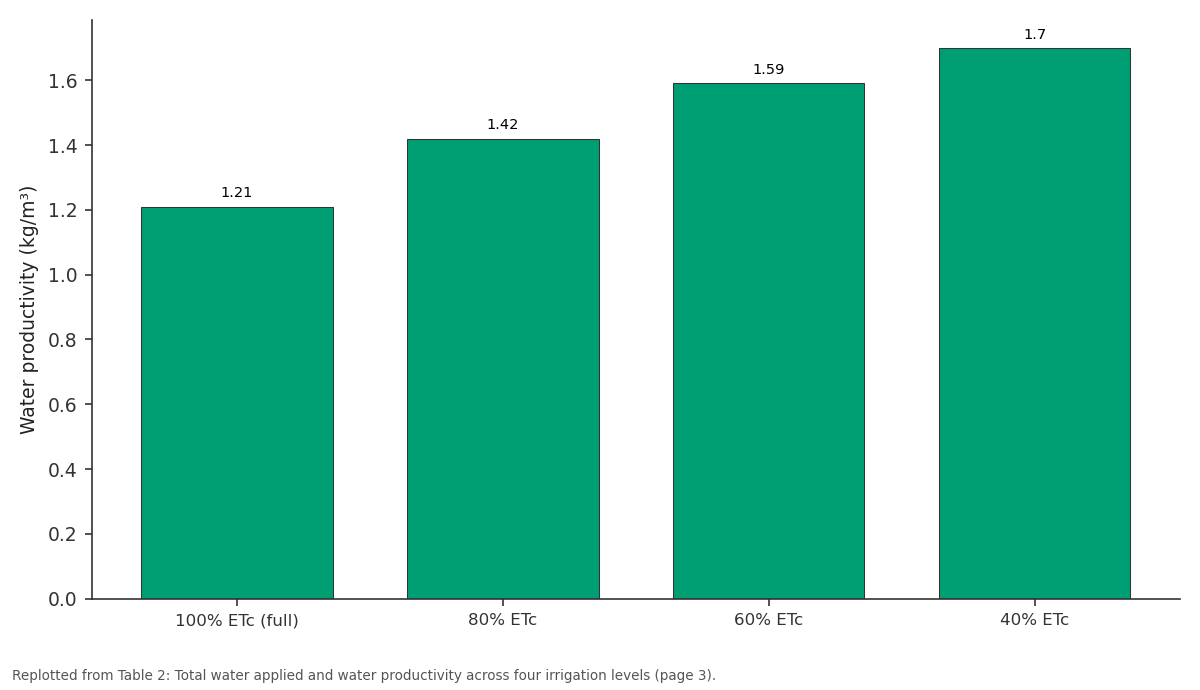
Water productivity (kg/m³): 100% ETc (full) vs 80% ETc vs 60% ETc vs 40% ETc
Replotted from Table 2 (page 3) of the original paper. Every bar is the paper's own table value.
View source evidence ↗Figures & tables
From the original paper Table 1
 Table 2
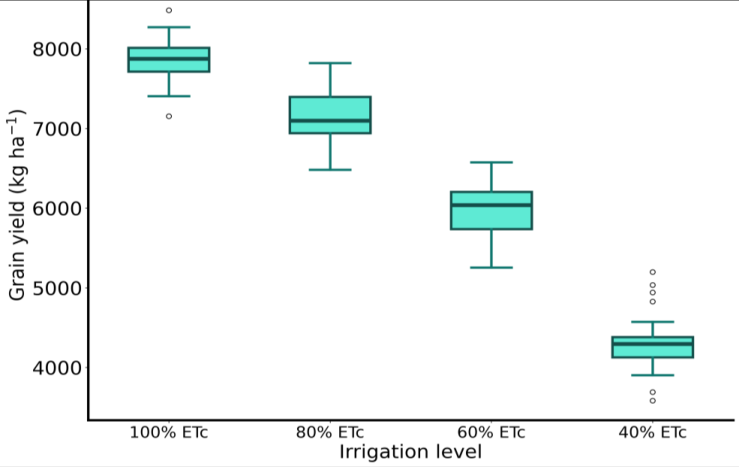 Figure 1
 Figure 2
Introduction
Water for irrigation is not a fixed input the way fertilizer or seed is; it fluctuates season to season, and in many irrigation schemes across southern Africa, the volume actually available at any given point in the season depends on reservoir levels and competing demands well outside any individual farmer's control. Maize, grown widely under irrigation across this region for its yield reliability relative to rainfed production, is also comparatively waterdemanding, and irrigation scheme managers routinely face the question of how to allocate a limited water supply across scheme members without simply rationing every farmer down to a fraction of what full irrigation would deliver [1,2] . Deficit irrigation, deliberately supplying less water than the crop's full evapotranspiration demand, offers one route through this problem, but its practical value depends entirely on how yield responds to the specific level of deficit applied. A modest deficit that costs little yield while saving meaningful water represents a genuinely useful management option; a deficit that costs proportionally more yield than water saved offers no advantage over simply reducing irrigated area and applying full water to a smaller footprint [3,4] . Maize yield response to water deficit is not uniform across the growing season, and several trials report the period around silking and pollination as disproportionately sensitive to moisture stress relative to vegetative or grain-filling stages, since water stress at this stage can directly reduce the number of kernels that set on the cob rather than simply limiting the size of kernels that do set [5,6] . Whether this sensitivity pattern translates into a specific irrigation level threshold below which water productivity itself starts declining, rather than only yield, is a question with direct practical relevance for setting deficit irrigation recommendations, yet the answer likely varies with local climate, soil water-holding capacity, and irrigation scheduling method [7,8] . This research set out to identify, among four irrigation levels spanning full supply to severe deficit, which level maximizes water productivity rather than yield alone, and to characterize which yield component, kernel number or kernel weight, drives the yield decline observed under increasing water deficit. Understanding this componentlevel response has practical value for irrigation scheduling, since a yield loss concentrated in kernel number points toward protecting water supply specifically around the silking window, whereas a loss concentrated in kernel weight would argue for more even water distribution across the whole grain-filling period. Specific objectives were to quantify grain yield, yield components, and water productivity across the four irrigation levels, and to determine whether an irrigation level exists at which water productivity peaks even though yield itself does not, since such a point would represent the practically optimal irrigation target for water-constrained scheme management.
Materials and Methods
Materials and Methods
Study Area Description
The trial was conducted at the irrigation research block of Lusaka Institute of Agricultural Sciences (15.39°S, 28.32°E, altitude 1279 m), Lusaka, Zambia, across two consecutive dry seasons, May to September 2023 and May to September 2024, when irrigation supplies the crop's entire water requirement with negligible rainfall contribution. Mean temperature across the growing period ranged from 14 °C to 27 °C, and reference evapotranspiration averaged 4.8 mm per day. Soils at the site are sandy clay loam with pH 6.5, moderate water-holding capacity, and adequate baseline nitrogen, phosphorus, and potassium status per local fertility ratings.
Materials
Maize hybrid 'ZM-Lusaka 623', a medium-maturity hybrid with a growing period of about 135 days widely grown under irrigation in the region, was used across both seasons. A uniform fertilizer dose of 150:60:60 kg NPK per hectare was applied to all plots, split across basal, knee-height, and tasseling stages, so that yield differences reflect irrigation treatment rather than nutrient supply differences.
Water Balance and Irrigation Scheduling
Reference evapotranspiration was calculated daily using the Penman-Monteith method from automated weather station data recorded at the trial site, and crop evapotranspiration (ETc) was derived using published crop coefficients appropriate to each growth stage. Irrigation was applied through a drip system allowing precise control of water volume per treatment, scheduled at three-day intervals with the applied depth calculated to replace 100%, 80%, 60%, or 40% of accumulated ETc since the previous irrigation event, depending on treatment. Soil moisture was monitored gravimetrically at 0-30 cm and 30-60 cm depth twice weekly to confirm that actual soil water status tracked the intended deficit level for each treatment throughout the season.
Field Experimental Design
Four irrigation treatments, 100% ETc, 80% ETc, 60% ETc, and 40% ETc, were arranged in a randomized block design with four replications. Plot size was 6 m by 5 m with a 1 m buffer strip between plots to minimize lateral water movement between adjacent treatments. Sowing was done at a row spacing of 75 cm and a plant-to-plant spacing of 25 cm, thinned to a uniform population of about 53, 000 plants per hectare by 15 days after emergence. All plots received identical nutrient management, weed control, and pest management, isolating irrigation level as the sole treatment variable.
Methods
Grain yield, kernel number per cob, hundred-kernel weight, and harvest index were recorded from a net plot area of 18 m² at physiological maturity. Total water applied per treatment was recorded from drip system flow meters throughout the season, and water productivity was calculated as grain yield divided by total water applied (kg grain per m³ water). Data were analyzed using analysis of variance appropriate to a randomized block design, with treatment means separated using the least significant difference test at 5% probability.
Results
Irrigation level affected grain yield, yield components, and water productivity in a pattern that did not move in lockstep: yield declined steadily as irrigation level decreased, while water productivity followed a different trajectory entirely, peaking at an intermediate irrigation level rather than at full irrigation. The spread visible in Figure 1 widens noticeably at the two lowest irrigation levels, indicating that yield became less predictable, not just lower, as water deficit increased, likely reflecting greater plot-to-plot variability in how precisely the intended deficit level was achieved under more severe water restriction. Kernel number fell by 41.8% between full irrigation and 40% ETc, while hundred-kernel weight fell by only 10%, showing the yield loss under deficit irrigation traced overwhelmingly to fewer kernels setting on the cob rather than smaller kernels forming among those that did set. Water productivity rose steadily as irrigation level decreased, reaching its highest value under the most severe deficit tested, a pattern that on its own might suggest even lower irrigation levels are worth exploring; but that reading has to be weighed against the absolute yield loss, since maximizing water productivity in isolation is not the same goal as maximizing total farm income or total food production from the same land area.
Comprehensive Interpretation
Bringing yield, yield component, and water productivity data together points toward 80% ETc as the more practically useful deficit level rather than the 40% ETc treatment that showed the single highest water productivity figure. At 80% ETc, yield loss relative to full irrigation was a modest 9.4%, while water use fell by 22.9%, a trade that raises water productivity by 17.4% at comparatively low yield cost. At 40% ETc, water productivity climbed further, but yield loss reached 45%, a cost most irrigation scheme members and food security planners would judge too steep relative to the water saved. This distinction between the irrigation level that maximizes water productivity in the abstract and the level that offers the best practical trade-off matters for how these results should be applied in scheme-level water allocation decisions.
Discussion
The finding that kernel number, rather than kernel weight, drove most of the yield decline under deficit irrigation matches a substantial body of maize physiology research identifying the period around silking and pollination as unusually sensitive to water stress, since moisture deficit at this stage directly interferes with silk emergence timing relative to pollen shed, reducing the fraction of ovules that get fertilized regardless of how well the crop performs afterward during grain filling [5,9] . This has a direct scheduling implication: if irrigation water must be rationed at some point in the season, protecting supply specifically around the two-week window bracketing silking would likely preserve more yield than an equivalent water saving taken evenly across the whole season.
Water productivity peaking at an intermediate rather than the lowest irrigation level tested is a pattern reported with some consistency across deficit irrigation research on maize and other cereals, generally attributed to the fact that severe deficit begins reducing yield disproportionately faster than it reduces water applied once stress crosses some threshold, flattening or reversing the water productivity gain that held at more moderate deficit levels [7,10] . The 40% ETc treatment in this trial still showed rising water productivity rather than a reversal, which suggests the threshold where water productivity itself would start falling sits below 40% ETc for this variety and site, a boundary this trial's fourlevel design cannot pin down more precisely. For irrigation scheme managers, these results offer a fairly direct policy lever: where water supply cannot cover full irrigation demand across every scheme member, a uniform 80% ETc allocation across all farmers would likely preserve more total grain production, and more water productivity, than a smaller number of farmers receiving full irrigation while others receive severely rationed or no irrigation at all, assuming scheme infrastructure allows for this kind of coordinated deficit application rather than an all-or-nothing allocation [11,12] .
Economic and Sustainability Assessment
A simple economic comparison combining yield value and water cost, using prevailing local maize price and irrigation water charges, shows the 80% ETc treatment delivering the highest net return per hectare among the four levels tested, narrowly ahead of full irrigation, since the modest yield sacrifice was more than offset by the water cost saving.
The 60% and 40% ETc treatments, despite their higher raw water productivity figures, generated lower net return overall because the yield loss outweighed the water cost saving at prevailing local prices. This suggests that from a pure farm profitability standpoint, and not only a water conservation standpoint, 80% ETc represents a genuinely sound choice rather than a compromise made only for water-scarcity reasons.
Limitations
This research applied deficit irrigation as a uniform seasonal reduction rather than testing whether concentrating the deficit away from the silking window, while maintaining full irrigation specifically during that period, could achieve better yield outcomes at the same total water volume.
Testing was conducted at a single site over two seasons with one maize hybrid, and water productivity thresholds identified here may shift under different soil water-holding capacity, evaporative demand, or hybrid maturity duration.
Stage-specific deficit irrigation trials, rather than uniform seasonal deficit, would help refine these recommendations further.
Conclusion
Water availability, more than land or seed, increasingly sets the ceiling on irrigated maize production across waterconstrained farming regions, and this research set out to identify how deficit irrigation affects yield and water productivity of maize under such conditions. Grain yield declined steadily as irrigation level fell from 100% to 40% of crop evapotranspiration, driven mainly by fewer kernels setting per cob rather than smaller kernel weight, while water productivity followed a different pattern, rising as irrigation level decreased and reaching its highest raw value under the most severe deficit tested. Weighing yield loss against water saved points to 80% ETc as the more practically sound recommendation for water-constrained irrigation schemes, offering a meaningful water productivity gain and the highest net economic return among the levels tested, at a comparatively modest yield cost. Looking ahead, testing stage-specific deficit irrigation, concentrating any water restriction away from the silking window rather than applying it uniformly across the season, could reveal whether even better water productivity and yield outcomes are achievable at the same total water volume.
Acknowledgement
Acknowledgements Institutional SupportThe authors thank the irrigation research block staff of Lusaka Institute of Agricultural Sciences for maintaining the
Figures and tables from the paper
| Irrigation level | Grain yield (kg/ha) | Kernels/cob | 100-kernel wt (g) | Harvest index (%) |
|---|---|---|---|---|
| 100% ETc (full) | 7860 | 512 | 34.2 | 42.6 |
| 80% ETc | 7120 | 461 | 33.6 | 39.8 |
| 60% ETc | 5980 | 386 | 32.1 | 36.4 |
| 40% ETc | 4310 | 298 | 30.8 | 31.8 |
| LSD (p = 0.05) | 218 | 16 | 0.9 | 1.4 |
Table text extracted from the original PDF; superscript letters are shown inline. The original table image is below.
View original table image
| Irrigation level | Total water applied (m³/ha) | Water productivity (kg/m³) | % water saved vs. full |
|---|---|---|---|
| 100% ETc (full) | 6495 | 1.21 | - |
| 80% ETc | 5010 | 1.42 | 22.9 |
| 60% ETc | 3768 | 1.59 | 42.0 |
| 40% ETc | 2542 | 1.70 | 60.9 |
Table text extracted from the original PDF; superscript letters are shown inline. The original table image is below.
View original table image
References
15 in the original paper- Fereres E, Soriano M. Deficit irrigation for reducing agricultural water use. J Exp Bot. 2020;58(2):147-159.
- Payero J, Tarkalson D, Irmak S, Davison D, Petersen J. Effect of timing of a deficit-irrigation allocation on corn evapotranspiration, yield, water use efficiency and dry mass. Agric Water Manag. 2021;96(10):1387-1397.
- English M, Solomon K, Hoffman G. A paradigm shift in irrigation management. J Irrig Drain Eng. 2022;128(5):267-277.
- Geerts S, Raes D. Deficit irrigation as an on-farm strategy to maximize crop water productivity in dry areas. Agric Water Manag. 2019;96(9):1275-1284.
- NeSmith D, Ritchie J. Short-and long-term responses of corn to a pre-anthesis soil water deficit. Agron J. 2021;84(1):107-113.
- Cakir R. Effect of water stress at different development stages on vegetative and reproductive growth of corn. Field Crops Res. 2020;89(1):1-16.
- Kirda C. Deficit irrigation scheduling based on plant growth stages showing water stress tolerance. FAO Water Rep. 2022;22:3-10.
- Zwart S, Bastiaanssen W. Review of measured crop water productivity values for irrigated wheat, rice, cotton and maize. Agric Water Manag. 2023;69(2):115133.
- Grant R, Jackson B, Kiniry J, Arkin G. Water deficit timing effects on yield components in maize. Agron J. 2019;81(1):61-65.
- Kang S, Shi W, Zhang J. An improved water-use efficiency for maize grown under regulated deficit irrigation. Field Crops Res. 2020;67(3):207-214.
- Playan E, Mateos L. Modernization and optimization of irrigation systems to increase water productivity. Agric Water Manag. 2021;80(1-3):100-116.
- Molden D, Oweis T, Steduto P, Bindraban P, Hanjra M, Kijne J. Improving agricultural water productivity: between optimism and caution. Agric Water Manag. 2022;97(4):528-535.
- Farre I, Faci J. Deficit irrigation in maize for reducing agricultural water use in a Mediterranean environment. Agric Water Manag. 2019;96(3):383-394.
- Traore S, Wang Y, Kerh T. Neural network approach for estimating reference evapotranspiration from limited climatic data in Burkina Faso. Appl Math Model. 2020;34(11):3044-3058.
- Igbadun H, Mahoo H, Tarimo A, Salim B. Crop water productivity of an irrigated maize crop in Mkoji subcatchment of the Great Ruaha River Basin, Tanzania. Agric Water Manag. 2021;85(1-2):141-150.