
Research article · 2026 · Full text
International Journal of Agriculture and NutritionAssessment of soil fertility status and nutrient index in major cropping systems of semi-arid regions
Volume 8(1) · Pages 87–91 · DOI: 10.33545/26646064.2026.v8.i1b.672 ↗
Research areasAgricultural Science and FertilizationPlant Growth and Agriculture TechniquesSoil Science and Environmental Management
Abstract
Author-writtenFertility maps built decades ago still guide fertilizer recommendations across much of the semi-arid Sahel, even as cropping patterns have shifted considerably since those maps were drawn. Would a fresh soil fertility assessment across the region's four dominant cropping systems reveal the same nutrient status those older maps assume, or has the picture changed? Soil samples were collected from 84 georeferenced sites spanning cereal-cereal rotation, cereal-legume rotation, cereal-fallow, and mixed cropping systems around Bamako, Mali, and analyzed for pH, electrical conductivity, organic carbon, available nitrogen, phosphorus, potassium, and available zinc, iron, manganese, and copper. Nutrient Index Values (NIV) were computed for each parameter and cropping system following standard fertility rating procedures. Cereal-cereal rotation sites showed the poorest overall fertility profile, with 62% of samples falling in the low organic carbon category, while cereal-legume sites showed significantly higher organic carbon and available nitrogen, consistent with residual nitrogen fixation benefits carried over from the legume phase. Available zinc deficiency was widespread across all four systems, affecting 71% of sampled sites regardless of cropping history, suggesting a region-wide micronutrient gap that current fertilizer recommendations, built mainly around nitrogen, phosphorus, and potassium, do not address. A strong positive correlation between organic carbon and Nutrient Index Value for nitrogen (r = 0.74) points to organic matter management as a practical entry point for improving overall soil fertility across cropping systems. These findings support updating regional fertilizer recommendations to reflect current cropping-system-specific fertility status and to incorporate zinc management as a standard component.
Summary
Source-checkedPlain-language reading of the full paper, prepared with AI and checked against the text. Each point links to the authors' own words.
Why it matters
- Fertilizer recommendations in the semi-arid Sahel are often based on outdated soil fertility maps that do not reflect current cropping patterns. View evidence ↗
- Routine soil testing often overlooks micronutrients like zinc, iron, and manganese, which are known to be deficient in many semi-arid soils. View evidence ↗
The question
- The study aimed to create a current fertility profile for four dominant cropping systems near Bamako to see if cropping history affects nutrient status. View evidence ↗
- The researchers also investigated if organic carbon could serve as a low-cost proxy indicator for overall nutrient status. View evidence ↗
What they did
- Soil sampling took place between December 2024 and February 2025 within a 40 km radius of Bamako, Mali. View evidence ↗
- The study used 84 sites, with 21 sites each for cereal-cereal, cereal-legume, cereal-fallow, and mixed cropping systems. View evidence ↗
- Composite samples were collected from five points within a 20 m radius at depths of 0-15 cm and 15-30 cm. View evidence ↗
- Nutrient Index Values (NIV) were calculated and categorized as low (<1.67), medium (1.67-2.33), or high (>2.33). View evidence ↗
What they found
- Cereal-cereal rotation had the poorest overall fertility rating ('Low'), primarily due to low organic carbon (NIV 1.31) and available nitrogen (NIV 1.42). View evidence ↗
- Cereal-legume rotation showed higher organic carbon (NIV 2.18) and available nitrogen (NIV 2.24), likely due to nitrogen fixation from legumes. View evidence ↗
- Zinc deficiency was widespread across all systems, affecting 70.2% of all sampled sites. View evidence ↗
- There is a strong positive correlation (r = 0.74) between soil organic carbon and the Nutrient Index Value for nitrogen. View evidence ↗
- Cropping systems had a statistically significant effect (p < 0.01) on both organic carbon (mean 0.58%) and available nitrogen (mean 178.4 kg/ha). View evidence ↗
What it means
- The authors recommend that regional fertilizer programs include zinc management and promote cereal-legume rotations to improve soil fertility. View evidence ↗
- The authors suggest that organic carbon could potentially serve as a simplified, low-cost lead indicator for fertility screening if validated on a larger scale. View evidence ↗
- The study was limited by its small geographic scope (40 km radius) and a single sampling period during the dry season. View evidence ↗
- Cropping system data relied on farmer reports rather than verified records, which may have introduced misclassification. View evidence ↗
Visual summary
3 visualsIllustrations explain the paper; charts are replotted from the paper's own table values.
Comparison of Cropping Systems
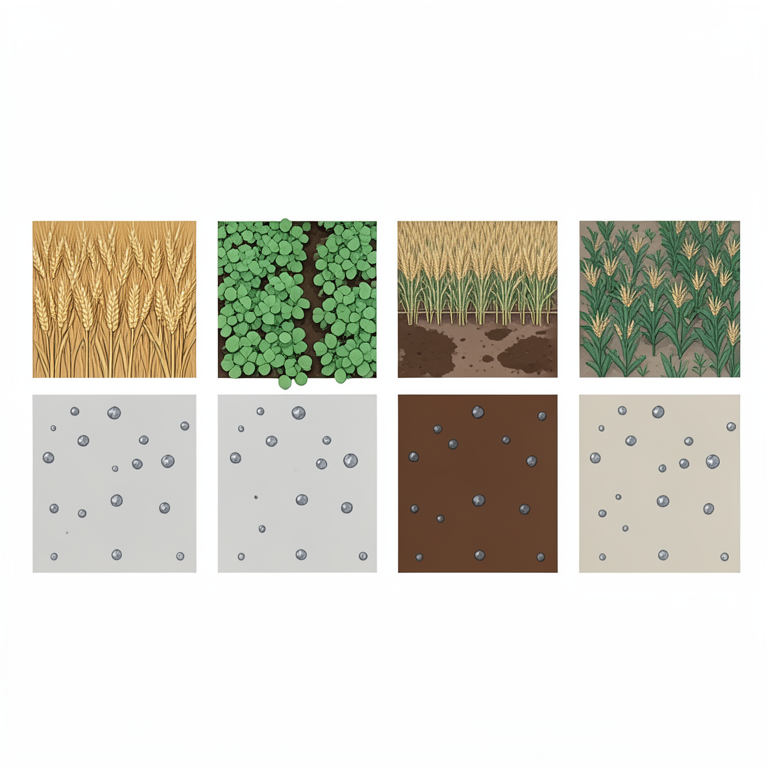
AI-generated conceptual illustration (Semi-arid agricultural soil plots with cereal and legume crops). It explains the idea and does not show study data.
View source evidence ↗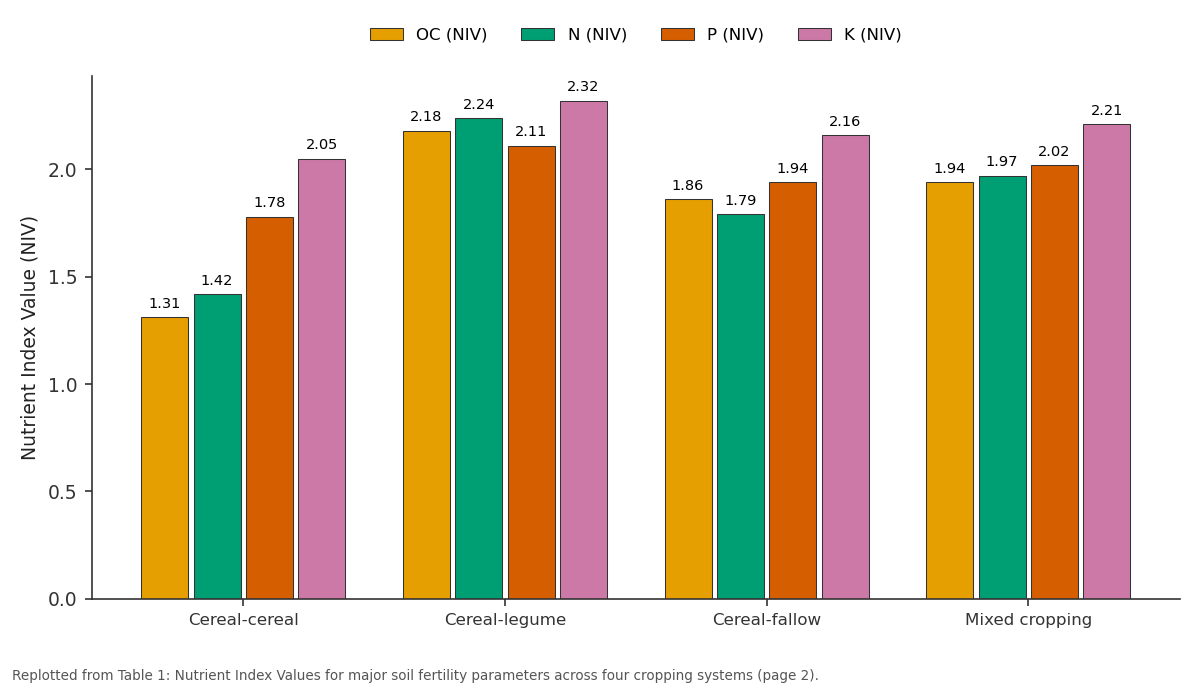
OC (NIV) and N (NIV) and more: Cereal-cereal vs Cereal-legume vs Cereal-fallow vs Mixed cropping
Replotted from Table 1 (page 2) of the original paper. Every bar is the paper's own table value.
View source evidence ↗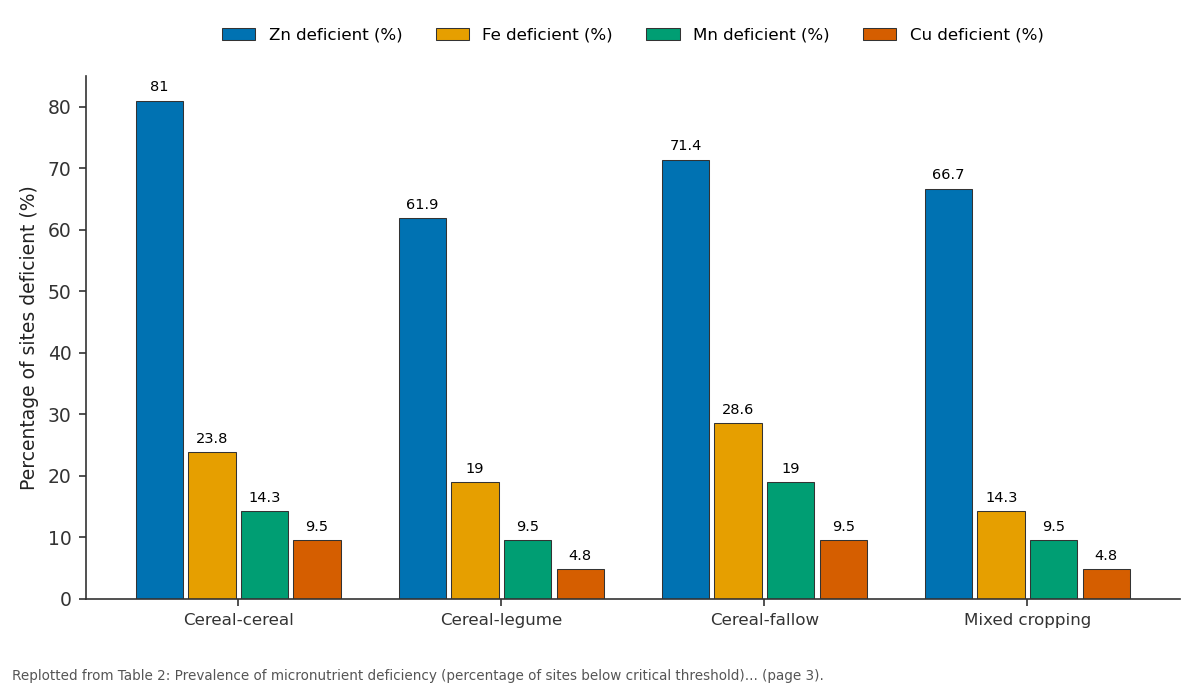
Zn deficient (%) and Fe deficient (%) and more: Cereal-cereal vs Cereal-legume vs Cereal-fallow vs Mixed cropping
Replotted from Table 2 (page 3) of the original paper. Every bar is the paper's own table value.
View source evidence ↗Figures & tables
From the original paper Table 1
 Table 2
 Table 3
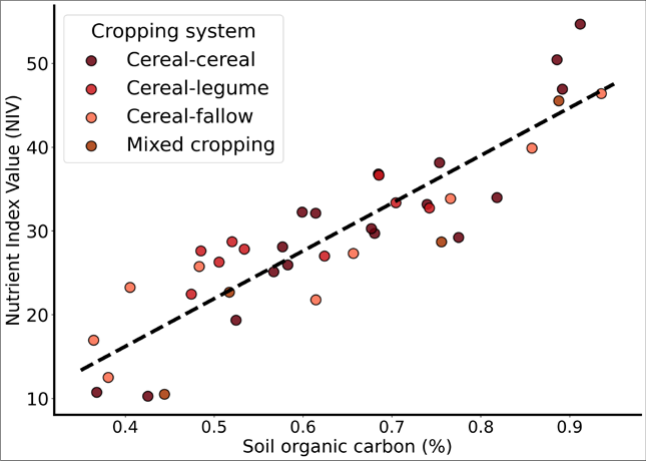 Figure 1
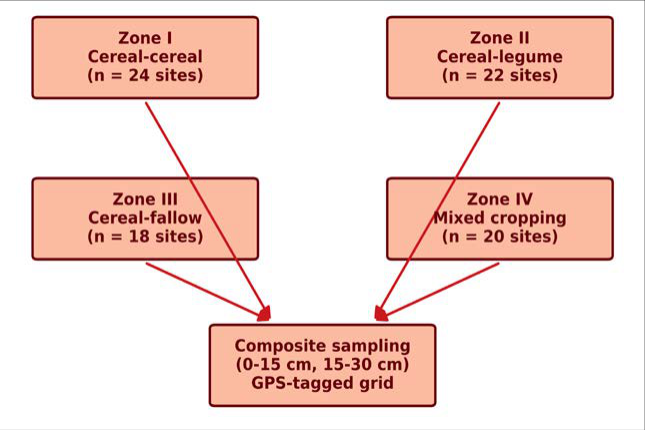 Figure 2
Introduction
Bold as it may sound, a great deal of fertilizer recommendation in semi-arid West Africa still rests on soil surveys conducted well before the current mix of cropping systems took hold across the landscape. Cereal-cereal rotation, once uncommon in this region, has expanded considerably as population pressure shortened fallow periods, while cereal-legume rotation and deliberate mixed cropping have grown as farmers' hedge against rainfall variability [1,2] . Nutrient status under these different systems is unlikely to be uniform. Legume phases fix atmospheric nitrogen and typically leave behind measurably higher soil nitrogen for the following cereal crop, an effect documented across multiple Dryland rotation research programmes [3,4] . Continuous cereal cropping, by contrast, tends to draw down soil organic carbon and nitrogen steadily where residue is removed or burned rather than incorporated, a pattern reported consistently across semi-arid cropping systems in the wider Sahel and East African Dryland [5,6] . Micronutrient status receives far less attention in routine soil testing than the primary macronutrients, despite growing evidence that zinc and, to a lesser extent, iron and manganese deficiencies are widespread across calcareous and sandy semi-arid soils [7,8] . Where soil testing programmes do not routinely screen for these micronutrients, deficiencies can persist undetected for years, limiting crop response to otherwise well-managed nitrogen and phosphorus fertilization [9] . This research set out to build a current fertility profile across the four cropping systems now dominant around Bamako, computing Nutrient Index Values for macro-and micronutrients alike, and to test whether cropping system history explains meaningful variation in fertility status. A second aim was to examine whether organic carbon, a parameter farmers and extension officers can influence directly through residue and manure management, correlates strongly enough with broader nutrient status to serve as a practical proxy indicator where full laboratory nutrient panels are not routinely affordable. Objectives were therefore to classify soil fertility status across the four cropping systems using standard Nutrient Index Value procedures, to quantify the prevalence of micronutrient deficiency alongside macronutrient status, and to test the strength of association between organic carbon and nitrogen fertility rating as a candidate simplified fertility indicator for extension use.
Materials and Methods
Materials and Methods
Study Area Description
Sampling was conducted across farming communities within a 40 km radius of Bamako, Mali (12.65°N, 8.00°W, altitude 350 m), during the dry season of December 2024 to February 2025, following harvest of the preceding cropping season across all sites. The area lies within the Sudano-Sahelian agro-ecological zone, with mean annual rainfall of about 900 mm concentrated in a single wet season from June to September, and mean annual temperature of 27 °C. Soils across the sampled area are predominantly ferruginous tropical soils and lixisols, sandy to sandy-loam in texture, generally low in inherent fertility and prone to rapid organic matter mineralization under the region's high temperatures.
Field Experimental Design
A total of 84 sampling sites were selected using a stratified random approach, with 21 sites drawn from each of four cropping system categories: cereal-cereal rotation (continuous sorghum or millet), cereal-legume rotation (cereal alternated with cowpea or groundnut), cereal-fallow (cereal followed by at least one full season of natural fallow), and mixed cropping (intercropped cereal-legumevegetable systems on the same plot within a season). Each site was geo-referenced using handheld GPS, and composite soil samples were collected from five sub-sample points within a 20 m radius at two depths, 0-15 cm and 15-30 cm, then bulked by depth to form a single composite sample per depth per site.
Materials
Soil samples were air-dried, crushed, and passed through a 2 mm sieve before laboratory analysis. Reference standards used for calibration included certified soil reference material sourced from a regional agricultural research laboratory to verify analytical accuracy across the full sample batch, with duplicate analysis run on every tenth sample to check reproducibility.
Methods
Soil pH and electrical conductivity were measured in a 1:2.5 soil-water suspension using a calibrated pH and EC meter. Organic carbon was determined by the Walkley-Black wet oxidation method. Available nitrogen was estimated by the alkaline permanganate method, available phosphorus by the Olsen method (appropriate for the near-neutral to slightly alkaline pH range recorded across most sites), and available potassium by ammonium acetate extraction followed by flame photometry. Available zinc, iron, manganese, and copper were extracted using DTPA extractant and measured by atomic absorption spectrophotometry. Nutrient Index Values were computed for each parameter within each cropping system following the standard formula summing the product of low, medium, and high category site counts weighted by category value, divided by total sites sampled, with resulting NIV classified as low (below 1.67), medium (1.67 to 2.33), or high (above 2.33). Pearson correlation coefficients were computed between organic carbon and other fertility parameters to test the strength of association. Cereal-cereal rotation sites recorded the only 'Low' overall rating among the four systems, driven mainly by organic carbon and available nitrogen NIVs sitting well below the medium threshold; every other system cleared the medium rating on at least three of the five parameters. The scatter distribution in Figure 1 shows a fairly tight positive relationship between organic carbon and nitrogen NIV (r = 0.74), with cereal-cereal sites clustering toward the lower left of the plot and cereal-legume sites clustering toward the upper right, visually reinforcing the pattern already evident in Table 1.
| Cropping system | OC (NIV) | N (NIV) | P (NIV) | K (NIV) | Zn (NIV) | Overall rating |
|---|---|---|---|---|---|---|
| Cereal-cereal | 1.31 | 1.42 | 1.78 | 2.05 | 1.24 | Low |
| Cereal-legume | 2.18 | 2.24 | 2.11 | 2.32 | 1.51 | Medium |
| Cereal-fallow | 1.86 | 1.79 | 1.94 | 2.16 | 1.38 | Medium |
| Mixed cropping | 1.94 | 1.97 | 2.02 | 2.21 | 1.63 | Medium |
| Overall mean | 1.82 | 1.86 | 1.96 | 2.18 | 1.44 | Medium-Low |
Table text extracted from the original PDF; superscript letters are shown inline. The original table image is below.
View original table image
Results
Comprehensive Interpretation: Reading the three tables together, the cropping system with the least fertility resilience turns out to be the one now expanding fastest across the study area. Cereal-cereal rotation combines the lowest organic carbon and nitrogen status with among the highest zinc deficiency prevalence, meaning that as this system displaces cereal-legume and fallow-based rotations, the aggregate fertility trend for the wider landscape is likely moving in an unfavorable direction even where individual farmers report stable yields in the short term. Zinc deficiency crossing 70% prevalence regardless of cropping system tells a different, region-wide story that has nothing to do with rotation choice and everything to do with a nutrient category current fertilizer recommendations simply do not address.
Discussion
The organic carbon advantage recorded under cereal-legume rotation fits comfortably with a wide body of Dryland cropping systems research documenting residual soil nitrogen and organic matter benefits following legume phases, generally attributed to nitrogen fixation, deeper root biomass turnover, and reduced residue removal relative to continuous cereal systems [3,10,11] . What stands out in this dataset is how much of a gap separates cereal-cereal from every other system rather than a smooth gradient across all four; this suggests a threshold effect, where continuous cereal cropping without any legume or fallow break crosses some tipping point in organic matter depletion that intermittent rotation, even infrequent, manages to avoid. Zinc deficiency at the prevalence recorded here, above 70% region-wide, sits toward the higher end of what other semiarid Sahelian and Sudano-Sahelian soil surveys have reported, though direct comparison is complicated by differences in extraction method and critical threshold definitions across research programmes [7,12] . What is harder to dispute is the practical implication: a fertility management strategy built solely around nitrogen, phosphorus, and potassium is leaving a widespread, measurable nutrient constraint completely unaddressed, one that foliar or soil zinc correction could likely resolve at modest cost relative to the yield response documented in related agronomic trials on zinc-responsive cereals [13,14] . The strength of the organic carbon to nitrogen NIV correlation (r = 0.74) offers a genuinely useful shortcut for extension programmes operating with limited laboratory capacity. Organic carbon testing is comparatively cheap and fast relative to a full nutrient panel, and if this correlation holds across a wider sampling effort beyond the Bamako area, it could justify a simplified fertility screening protocol built around organic carbon as a lead indicator, flagging sites likely to need broader nutrient intervention without requiring full-panel testing at every location [15,16] .
Limitations: Sampling was restricted to a single dry-season round and a 40 km radius around Bamako, so seasonal variation in nutrient availability and any longer-distance spatial trends across Mali's wider Sudano-Sahelian zone were not captured. The cropping system classification relied on farmer-reported rotation history rather than multi-year verified records, introducing some risk of misclassification at the margins between categories. Extending this sampling design across a full wet-to-dry seasonal cycle and a wider geographic footprint would strengthen confidence in how representative these fertility patterns are of the broader region.
Conclusion
Soil fertility recommendations across much of the semi-arid Sahel still rely on survey data that predates the cropping system shifts now underway across the landscape, and this research set out to build a current, cropping-system-specific fertility picture around Bamako to test whether that older picture still holds. It largely does not: cereal-cereal rotation, now the fastest-expanding system in the study area, showed the weakest overall fertility rating of the four systems assessed, while zinc deficiency affecting over 70% of sites regardless of rotation history points to a region-wide micronutrient gap that current fertilizer recommendations do not address at all. Extension services and fertilizer recommendation programmes serving this region would benefit from incorporating zinc management as a standard component and from weighting cereal-legume rotation more heavily in farmer advisory messaging given its measurable organic carbon and nitrogen advantage. Looking ahead, expanding this sampling design across a full seasonal cycle and a wider geographic area, and validating the organiccarbon-to-nitrogen-NIV correlation at that broader scale, would help determine whether a simplified, lower-cost fertility screening protocol could support more responsive and current fertilizer recommendations across the wider Sahelian region.
Acknowledgement
Acknowledgements Funding SourcesThis research was supported through the internal research programme of Bamako Institute of Agricultural Sciences. No external or commercial funding was received.
Figures and tables from the paper
| Cropping system | Zn deficient (%) | Fe deficient (%) | Mn deficient (%) | Cu deficient (%) |
|---|---|---|---|---|
| Cereal-cereal | 81.0 | 23.8 | 14.3 | 9.5 |
| Cereal-legume | 61.9 | 19.0 | 9.5 | 4.8 |
| Cereal-fallow | 71.4 | 28.6 | 19.0 | 9.5 |
| Mixed cropping | 66.7 | 14.3 | 9.5 | 4.8 |
| Overall (n = 84) | 70.2 | 21.4 | 13.1 | 7.1 |
Table text extracted from the original PDF; superscript letters are shown inline. The original table image is below.
View original table image
| Parameter | Mean | SD | Range | p-value (system effect) |
|---|---|---|---|---|
| pH (1:2.5) | 6.42 | 0.48 | 5.6-7.4 | 0.18 (ns) |
| EC (dS/m) | 0.21 | 0.09 | 0.08-0.51 | 0.32 (ns) |
| Organic carbon (%) | 0.58 | 0.24 | 0.21-1.12 | <0.01 |
| Available N (kg/ha) | 178.4 | 42.6 | 98-289 | <0.01 |
| Available Zn (mg/kg) | 0.61 | 0.28 | 0.18-1.34 | <0.05 |
Table text extracted from the original PDF; superscript letters are shown inline. The original table image is below.
View original table image
References
15 in the original paper- Bationo A, Hartemink A, Lungu O, Naimi M, Okoth P. African soil fertility management in a changing agricultural landscape. Outlook Agric. 2020;41(1):1524.
- Sanginga N, Woomer P. Integrated soil fertility management in Africa: principles, practices and developmental process. Trop Soil Biol Fertil Inst. 2021;1st ed:1-263.
- Bado B, Bationo A, Cescas M. Assessment of cowpea and groundnut contributions to soil fertility and succeeding sorghum yields in the Guinean savannah zone of Burkina Faso. Biol Fertil Soils. 2022;43(2):171176.
- Franke A, van den Brand G, Vanlauwe B, Giller K. Sustainable intensification through rotations with grain legumes in Sub-Saharan Africa: a review. Agric Ecosyst Environ. 2023;261:172-185.
- Tittonell P, Giller K. When yield gaps are poverty traps: the paradigm of ecological intensification in African smallholder agriculture. Field Crops Res. 2019;143:7690.
- Bationo A, Buerkert A. Soil organic carbon management for sustainable land use in SudanoSahelian West Africa. Nutr Cycl Agroecosyst. 2021;61(1-2):131-142.
- Ali M, Ahmed M, Mustafa A. Zinc status and its management for improving crop production in calcareous and sandy soils. Commun Soil Sci Plant Anal. 2022;53(4):411-425.
- Marschner H, Cakmak I. High light intensity enhances chlorosis and necrosis in leaves of zinc, potassium, and magnesium deficient bean, cotton and sunflower plants. J Plant Physiol. 2020;134(3):308-315.
- Rengel Z. Availability of Mn, Zn and Fe in the rhizosphere. J Soil Sci Plant Nutr. 2019;15(2):397-409.
- Snapp S, Blackie M, Gilbert R, Bezner-Kerr R, Kanyama-Phiri G. Biodiversity can support a greener revolution in Africa. Proc Natl Acad Sci. 2021;107(48):20840-20845.
- Giller K, Cadisch G. Future benefits from biological nitrogen fixation: an ecological approach to agriculture. Plant Soil. 2019;174(1-2):255-277.
- Wortmann C, Sones K. Fertiliser use optimisation in sub-Saharan Africa. CAB Int Publ. 2024;1st ed:38-52.
- Cakmak I. Enrichment of fertilizers with zinc: an excellent investment for humanity and crop production in India. J Trace Elem Med Biol. 2020;23(4):281-289.
- Alloway B. Soil factors associated with zinc deficiency in crops and humans. Environ Geochem Health. 2019;31(5):537-548.
- Doran J, Zeiss M. Soil health and sustainability: managing the biotic component of soil quality. Appl Soil Ecol. 2021;15(1):3-11.