
Research article · 2026 · Full text
International Journal of Agriculture and NutritionInsecticide cocktail mixing practices and farmer knowledge scores across two delta regions of Vietnam
Volume 8(3) · Pages 55–60 · DOI: 10.33545/26646064.2026.v8.i3a.669 ↗
Research areasAgricultural Innovations and PracticesPesticide Exposure and ToxicityInsect Pest Control Strategies
Abstract
Author-writtenThe practice of mixing multiple insecticide products into cocktail formulations is widespread among Vietnamese vegetable farmers, yet systematic comparison of this behavior across major production regions and its relationship to farmer knowledge levels remains limited. This research compared insecticide cocktail mixing patterns, knowledge scores, and economic outcomes between vegetable farmers in the Red River Delta (n = 150) and Mekong Delta (n = 150) of Vietnam during 2025-2026. Five cocktail combinations were identified, with organophosphate-pyrethroid (OP+PY) mixtures being most prevalent in the Red River Delta (28.5%) and organophosphate-carbamate (OP+CA) mixtures most common in the Mekong Delta (25.3%). Knowledge scores, assessed across a seven-point scale incorporating age group and education level variables, ranged from 1.8 (no education, age 56+) to 6.5 (tertiary, age 36-45). A significant positive linear relationship was established between over-application rate and seasonal economic loss (r = 0.72, p<0.001), with farmers applying insecticides at rates exceeding label recommendations incurring substantially higher costs without proportional pest reduction benefits. These findings underscore the need for region-specific extension strategies that address the distinct cocktail mixing cultures of each delta while improving farmer knowledge and economic efficiency.
Summary
Source-checkedPlain-language reading of the full paper, prepared with AI and checked against the text. Each point links to the authors' own words.
Why it matters
- The Red River and Mekong Deltas are the most intensive vegetable production areas in mainland Southeast Asia, supporting millions of farming households. View evidence ↗
- Farmer-created insecticide cocktails are generally formulated without using compatibility data or recommended mixing ratios. View evidence ↗
What they did
- The study surveyed 300 vegetable farmers, split equally with 150 from the Red River Delta and 150 from the Mekong Delta. View evidence ↗
- Farmer knowledge was measured using a 14-item assessment on a scale from 0 to 7.0, covering topics like safety, dosage, and environmental impact. View evidence ↗
- Over-application was defined as the percentage exceedance of the label-recommended dose, and economic loss was the difference between actual and optimal insecticide expenditure. View evidence ↗
What they found
- The most common cocktail in the Red River Delta was organophosphate-pyrethroid (28.5%), while organophosphate-carbamate was most common in the Mekong Delta (25.3%). View evidence ↗
- Over-application strongly correlated with economic loss (r = 0.72); those exceeding recommended rates by >50% spent an average of USD 185 more per hectare per season without better pest control. View evidence ↗
- Female farmers had significantly lower average knowledge scores (3.6) compared to male farmers (4.4). View evidence ↗
- About 34.2% of all cocktails used incompatible pairings, a figure that rose to 52.8% for triple-mix formulations. View evidence ↗
- Only 12.3% of farmers using incompatible insecticide combinations were aware of the potential negative interactions. View evidence ↗
What it means
- The authors suggest that framing insecticide optimization as a cost-saving measure is likely more effective for behavioral change than focusing on health risks. View evidence ↗
- The authors recommend region-specific extension strategies that combine economic arguments with an understanding of each delta's unique mixing culture. View evidence ↗
Visual summary
3 visualsIllustrations explain the paper; charts are replotted from the paper's own table values.
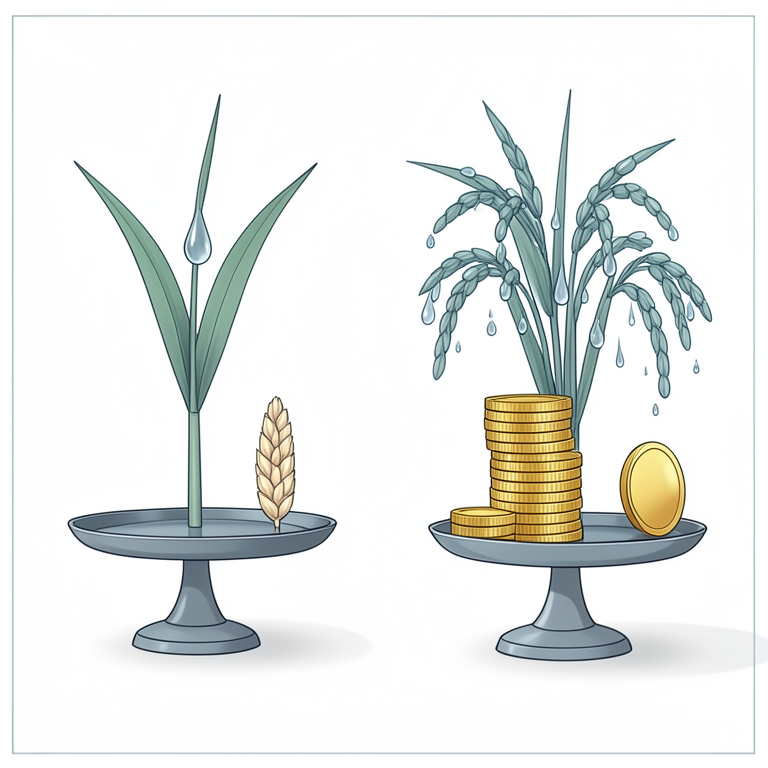
Economic Impact of Over-application
AI-generated conceptual illustration (Rice plants in a Vietnamese delta paddy field). It explains the idea and does not show study data.
View source evidence ↗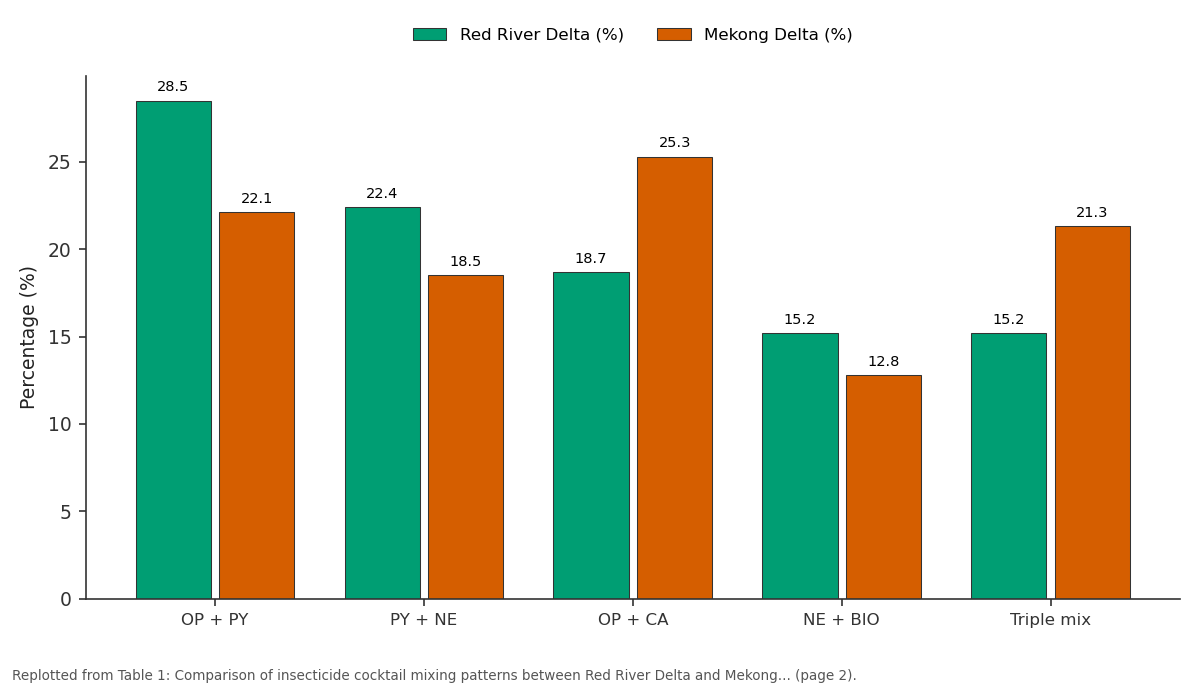
Red River Delta (%) and Mekong Delta (%): OP + PY vs PY + NE vs OP + CA vs NE + BIO vs Triple mix
Replotted from Table 1 (page 2) of the original paper. Every bar is the paper's own table value.
View source evidence ↗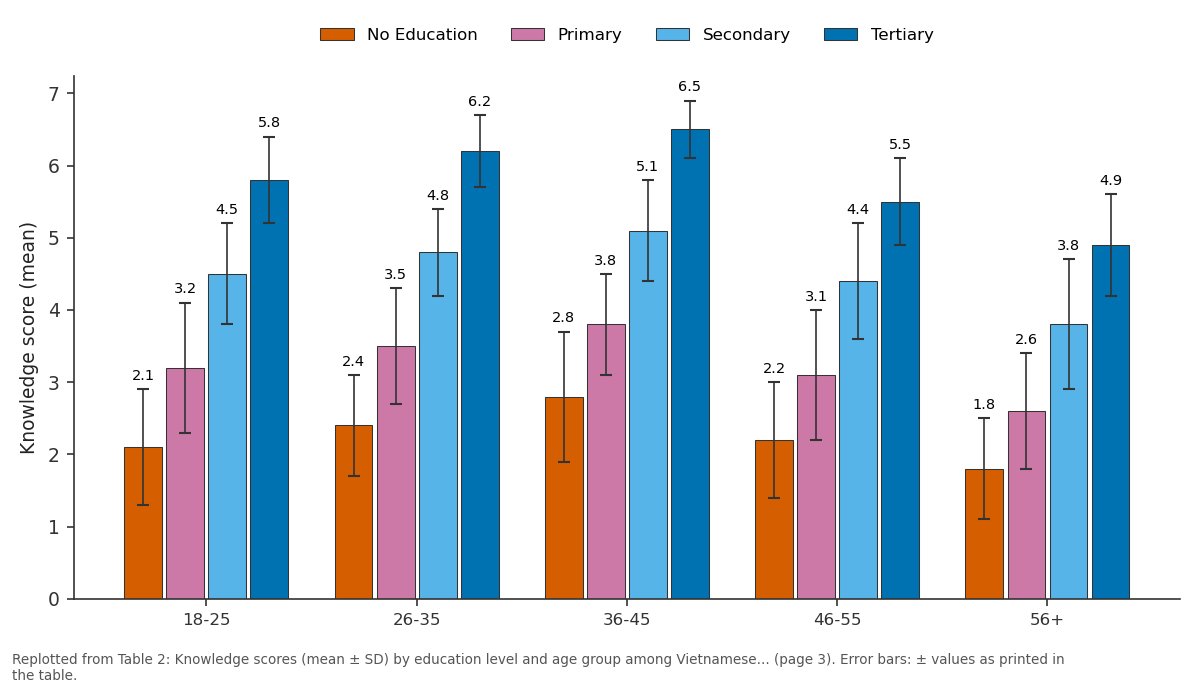
No Education and Primary and more: 18-25 vs 26-35 vs 36-45 vs 46-55 vs 56+
Replotted from Table 2 (page 3) of the original paper. Every bar is the paper's own table value.
View source evidence ↗Figures & tables
From the original paper Table 1
 Table 2
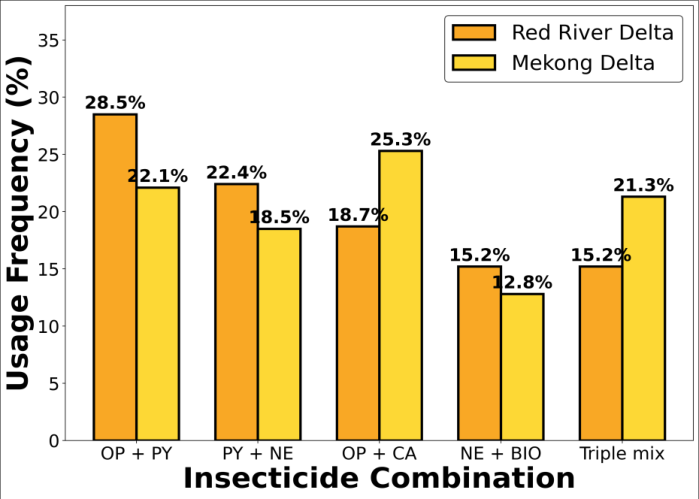 Figure 1
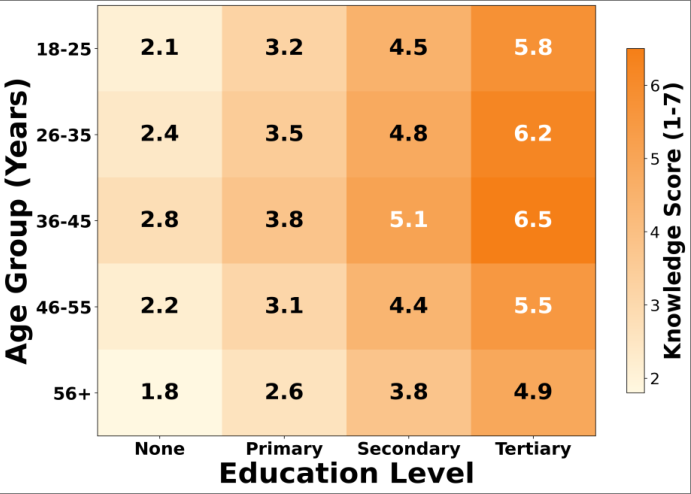 Figure 2
 Table 3
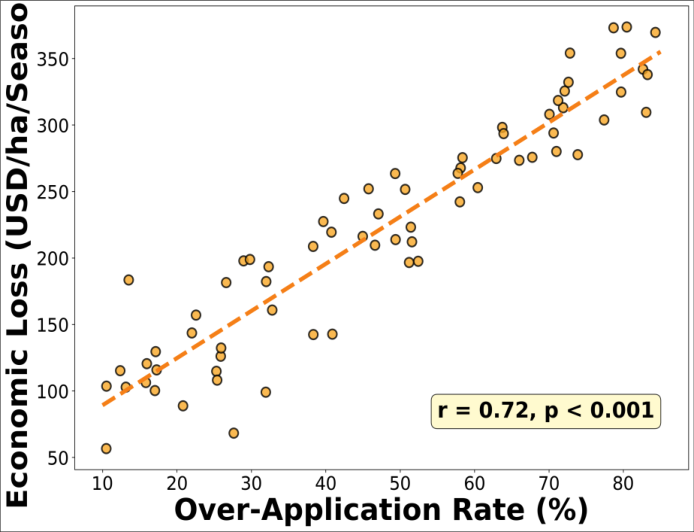 Figure 3
Introduction
Vietnam's two major river delta systems, the Red River Delta in the north and the Mekong Delta in the south, collectively constitute the most intensive vegetable production landscapes in mainland Southeast Asia. These regions supply the vast majority of fresh vegetables consumed in Hanoi, Ho Chi Minh City, and the surrounding urban agglomerations, supporting livelihoods for millions of farming households across both deltas. The intensive nature of vegetable production in these delta environments creates conditions conducive to persistent and diverse pest populations. The warm, humid climate, continuous cropping cycles, and high planting densities characteristic of delta vegetable systems promote the proliferation of multiple pest species simultaneously, including whiteflies, leaf miners, fruit borers, aphids, and diamondback moths. In response to this complex pest pressure, Vietnamese vegetable farmers have developed a practice of mixing two or more insecticide products into a single tank-mix application, colloquially referred to as "cocktail mixing." Cocktail mixing is driven by the farmer perception that combining products from different chemical classes or with different modes of action provides superior pest control compared to single-product applications. While this rationale has some scientific basis in the concept of synergistic or additive effects, the actual cocktail formulations used by farmers are typically created without reference to compatibility data, recommended mixing ratios, or potential antagonistic interactions. Furthermore, the use of cocktails complicates dose calculation and may result in total chemical loads that substantially exceed label-recommended rates for individual products. The knowledge base that informs farmer decision-making about insecticide use, including cocktail formulation, is shaped by education, training, experience, and information access, all of which may differ between the two delta regions due to their distinct social, economic, and Agricultural histories. Comparative analysis of insecticide cocktail practices and knowledge levels between these two critical production regions can inform the design of targeted extension strategies. This research was designed with three objectives: 1. To characterize and compare insecticide cocktail mixing patterns between Red River Delta and Mekong Delta vegetable farmers, 2. To assess farmer knowledge scores regarding insecticide use across age and education strata, and 3. To quantify the economic consequences of overapplication associated with cocktail mixing practices.
The economic consequences of insecticide cocktail mixing practices represent an understudied dimension of the broader pesticide use efficiency challenge in Vietnamese agriculture.
When farmers combine multiple products in a single tank mix, the total chemical load applied per unit area frequently exceeds the recommended rates for any individual product, resulting in higher input costs without proportional improvement in pest control outcomes. This over-application phenomenon is compounded by the tendency of cocktailmixing farmers to apply at shorter intervals than recommended, further amplifying both the economic cost and the environmental and health burden of their pest management activities.
The information pathways through which Vietnamese vegetable farmers acquire knowledge about insecticide use, cocktail formulation, and dosage calculation differ substantially between the two major delta regions. In the Red River Delta, the agricultural extension system maintains a more structured presence through commune-level extension workers and regular training activities, while in the Mekong Delta, farmers rely more heavily on informal networks, agrochemical dealers, and cross-border information exchange with neighboring countries. Understanding how these different information environments shape cocktail mixing behaviors and knowledge levels is essential for designing region-appropriate extension strategies that address the specific knowledge gaps and behavioral patterns prevalent in each delta system.
Materials and Methods
Materials and Methods
Material
The research was conducted across six provinces representing the two major delta regions of Vietnam. In the Red River Delta, the provinces of Ha Nam, Hung Yen, and Hai Duong were selected, while the Mekong Delta was represented by An Giang, Dong Thap, and Vinh Long Provinces. These provinces were chosen based on their significance in commercial vegetable production and the documented prevalence of intensive insecticide use practices.
Methods
A total of 300 vegetable farmers were surveyed, with 150 drawn from each delta region (50 per province). Farmers were selected using a two-stage random sampling procedure, first selecting communes (xa) within each province and then randomly selecting farmers from commune-level agricultural registers. Data were collected through structured interviews conducted in Vietnamese between September 2025 and August 2026.
The questionnaire captured detailed information on insecticide products used, cocktail mixing combinations and rationale, application rates (actual vs. recommended), knowledge assessment items, seasonal expenditure records, and demographic characteristics. The knowledge assessment component comprised 14 items covering insecticide mode of action, dosage interpretation, safety precautions, pre-harvest intervals, environmental impact awareness, pesticide resistance concepts, and beneficial insect recognition. Each item was scored on a scale of 0 (no knowledge) to 0.5 (correct answer), yielding a maximum composite score of 7.0. Scores were analyzed across age group and education level strata using two-way ANOVA.
Over-application rate was defined as the percentage by which the farmer's actual applied dose exceeded the labelrecommended dose for the primary insecticide product in the cocktail. Economic loss was calculated as the difference between the farmer's total insecticide expenditure and an estimated optimal expenditure based on recommended application rates and frequencies. Pearson correlation analysis assessed the relationship between over-application rate and economic loss. All analyses were performed using R version 4.4.1.
The cocktail mixing documentation procedure involved presenting farmers with a comprehensive list of insecticide trade names and active ingredients available in local markets, along with visual aids depicting common product containers. Farmers identified each product used in their tank-mix preparations and reported the quantities added per sprayer load. The research team subsequently classified each cocktail by its constituent chemical classes and calculated the total active ingredient load per hectare per application. Cocktails containing three or more different active ingredients from at least two chemical classes were classified as triple-mix formulations. Product compatibility was assessed retrospectively by cross-referencing identified cocktail combinations against manufacturer-published compatibility matrices and published chemical interaction databases. Incompatible combinations were defined as those known to produce physical separation, reduced efficacy, phytotoxicity, or enhanced mammalian toxicity.
Results
The combined sample of 300 farmers comprised 186 males (62.0%) and 114 females (38.0%), with a mean age of 44.2 years (SD = 11.8). Mean farming experience was 15.8 years (SD = 7.2). Education distribution showed 8.0% with no formal education, 24.0% primary, 48.0% secondary, and 20.0% tertiary. Five insecticide cocktail combinations were identified across both regions. In the Red River Delta, organophosphatepyrethroid (OP+PY) was the most common combination (28.5%), followed by pyrethroid-neonicotinoid (PY+NE) at 22.4% and organophosphate-carbamate (OP+CA) at 18.7%.
In the Mekong Delta, OP+CA dominated (25.3%), followed by triple-mix formulations containing three or more active ingredients (21.3%) and OP+PY (22.1%). The neonicotinoidbiological (NE+BIO) combination was used by 15.2% and 12.8% of farmers in the Red River and Mekong Deltas respectively.
Discussion
The distinct cocktail mixing preferences between the two delta regions reflect the different agricultural histories, market structures, and pest management cultures that have evolved independently in northern and southern Vietnam. The Red River Delta's preference for OP+PY combinations may be rooted in the longer tradition of organophosphate usage in northern Vietnamese agriculture, while the Mekong Delta's higher prevalence of OP+CA mixtures and triple-mix formulations may reflect the influence of cross-border trade with Cambodia and the greater diversity of insecticide products available in southern markets.
The knowledge score analysis provides a nuanced picture of the human capital dimensions underlying insecticide use decisions. The strong positive effect of education on knowledge scores was expected, but the significant ageeducation interaction reveals important complexity: among tertiary-educated farmers, knowledge scores remained relatively stable across age groups, while among less educated farmers, older individuals showed markedly lower scores than their younger counterparts. This pattern may reflect generational differences in exposure to agricultural education, with younger less-educated farmers having benefited from more recent informal learning opportunities through media and peer networks. The demonstration that over-application rates exceeding 50% are associated with substantial economic losses without commensurate pest control benefits provides a compelling economic argument for extension programs focused on dosage accuracy. This finding challenges the commonly held farmer belief that "more is better" by quantifying the financial penalty associated with excessive application. When communicated effectively, this economic evidence may prove more persuasive than health-based arguments in motivating behavioral change among cost-conscious vegetable farmers.
Clinical implications
The cocktail mixing practices documented in this research have implications for clinical toxicology in the Vietnamese context. When farmers present to healthcare facilities with acute insecticide exposure symptoms, the cocktail mixing practice means that they may have been simultaneously exposed to multiple chemical classes with different toxicological profiles and treatment requirements. Clinicians should be aware that organophosphate-carbamate cocktails present additive cholinesterase inhibition risks, while pyrethroid-neonicotinoid combinations may produce complex neurological symptom presentations that do not correspond to single-class exposure profiles. Medical history intake for suspected pesticide poisoning cases should specifically inquire about cocktail mixing practices.
Acknowledgement
AcknowledgementsThe authors express sincere gratitude to the Provincial Plant Protection Sub-Departments in all six participating provinces for their support in facilitating farmer contacts and providing technical documentation. The field research team from Can Tho Academy of Agricultural Research contributed essential data collection efforts across both delta regions. All 30060 ~ International Journal of Agriculture and Nutrition https://www.agriculturejournal.net participating vegetable farmers are thanked for their generous cooperation and time.
Figures and tables from the paper
| Cocktail Combination | Red River Delta (%) | Mekong Delta (%) | Overall (%) | Chi-sq p-value |
|---|---|---|---|---|
| OP + PY | 28.5 | 22.1 | 25.3 | 0.184 |
| PY + NE | 22.4 | 18.5 | 20.5 | 0.382 |
| OP + CA | 18.7 | 25.3 | 22.0 | 0.148 |
| NE + BIO | 15.2 | 12.8 | 14.0 | 0.528 |
| Triple mix | 15.2 | 21.3 | 18.2 | 0.152 |
Table text extracted from the original PDF; superscript letters are shown inline. The original table image is below.
View original table image
| Age Group | No Education | Primary | Secondary | Tertiary |
|---|---|---|---|---|
| 18-25 | 2.1 ± 0.8 | 3.2 ± 0.9 | 4.5 ± 0.7 | 5.8 ± 0.6 |
| 26-35 | 2.4 ± 0.7 | 3.5 ± 0.8 | 4.8 ± 0.6 | 6.2 ± 0.5 |
| 36-45 | 2.8 ± 0.9 | 3.8 ± 0.7 | 5.1 ± 0.7 | 6.5 ± 0.4 |
| 46-55 | 2.2 ± 0.8 | 3.1 ± 0.9 | 4.4 ± 0.8 | 5.5 ± 0.6 |
| 56+ | 1.8 ± 0.7 | 2.6 ± 0.8 | 3.8 ± 0.9 | 4.9 ± 0.7 |
Table text extracted from the original PDF; superscript letters are shown inline. The original table image is below.
View original table image
| Parameter | Within Label (n=82) | 1-50% Over (n=128) | >50% Over (n=90) |
|---|---|---|---|
| Mean dose (mL/L) | 2.1 ± 0.4 | 3.5 ± 0.6 | 5.2 ± 0.8 |
| Sprays/season | 5.2 ± 1.4 | 6.8 ± 1.8 | 8.5 ± 2.2 |
| Seasonal cost (USD/ha) | 125 ± 32 | 218 ± 48 | 345 ± 72 |
| Estimated loss (USD/ha) | 0 | 95 ± 28 | 220 ± 55 |
| Pest control rating (1-10) | 6.8 ± 1.2 | 7.0 ± 1.1 | 6.5 ± 1.4 |
Table text extracted from the original PDF; superscript letters are shown inline. The original table image is below.
View original table image
References
16 in the original paper- Berg H, Tam NT. Decreased use of pesticides for increased yields of rice and fish-options for the Mekong Delta, Vietnam. Sci Total Environ. 2012;437:370-377.
- Dasgupta S, Meisner C, Wheeler D, Xuyen K, Lam NT. Pesticide poisoning of farm workers-implications of blood test results from Vietnam. Int J Hyg Environ Health. 2007;210(2):121-132.
- Ha TM. A review on the development of integrated pest management and its integration in modern agriculture. Asian J Agric Food Sci. 2014;2(3):195-203.
- Hoi PV, Mol APJ, Oosterveer P, van den Brink PJ. Pesticide use in Vietnamese vegetable production: a 10year study. Int J Agric Sustain. 2016;14(3):325-338.
- Huan NH, Mai V, Escalada MM, Heong KL. Changes in rice farmers' pest management in the Mekong Delta, Vietnam. Crop Prot. 1999;18(9):557-563.
- Lamichhane JR, Dachbrodt-Saaydeh S, Kudsk P, Messean A. Toward a reduced reliance on conventional pesticides in European agriculture. Plant Dis. 2016;100(1):10-24.
- Le HT, Nguyen TV, Le VH, Dao QP. Organophosphorus and carbamate pesticide residues in Vietnamese vegetables. Southeast Asian J Trop Med Public Health. 2015;46(4):762-769.
- Nguyen TT, Mogensen L, Hermansen JE, Nguyen TH. Environmental costs of meat production: the case of typical EU, US and Australian production systems. Food Policy. 2019;82:10-17.
- Alam R, Khan MR, Jahan E, Uddin MS, Khatun J, Ahmmed S. Insecticide usage pattern among vegetable farmers: a case study in Chapainawabganj, Bangladesh. Zool Entomol Lett. 2022;2(1):50-55.
- Nguyen VH, Nguyen TT, Pham TH. Pesticide use and self-reported health problems among farmers in the Mekong Delta of Vietnam. Environ Res. 2021;196:110350.
- Pham HT, Thi Hong Hanh N, Brouwer R. Pesticide mixing and its health effects on farmers in the Mekong Delta. Sci Total Environ. 2023;858:159773.
- Schreinemachers P, Balasubramaniam S, Boopathi NM, Ha CV. Farmers' perceptions and management of plant viruses in vegetables and legumes in tropical and subtropical Asia. Crop Prot. 2015;75:115-123.
- Thanh ND, Hoi PV. Pesticide management and regulations in Vietnam. Environ Health Insights. 2020;14:1-8.
- Toan PV, Sebesvari Z, Blasing M, Rosendahl I, Renaud FG. Pesticide management and their residues in sediments and surface and drinking water in the Mekong Delta, Vietnam. Sci Total Environ. 2013;452-453:28-39.
- Tran VT, Le QN, Tran YT, Ngo TD, Pham HM. Assessment of pesticide exposure among vegetable farmers in the Red River Delta of Vietnam. Int J Environ Res Public Health. 2022;19(6):3456.
- Weinberger K, Genova CA, Acedo AL. Quantifying postharvest loss in vegetables along the supply chain in Vietnam, Cambodia and Laos. Int J Postharvest Technol Innov. 2008;1(3):288-297.