
Research article · 2026 · Full text
International Journal of Geography Geology and EnvironmentComparative assessment of hemipteran diversity across wet and dry seasons in a suburban-rural interface of Lagos, Nigeria
Volume 8(7) · Pages 141–147 · DOI: 10.22271/27067483.2026.v8.i7b.807 ↗
Research areasHemiptera Insect StudiesFreshwater macroinvertebrate diversity and ecologyInsect-Plant Interactions and Control
Abstract
Author-writtenHemiptera, comprising both herbivorous and predatory lineages, constitute an ecologically significant but frequently overlooked insect order in tropical peri-urban biodiversity assessments. This research conducted a comparative evaluation of hemipteran diversity across wet (April-October) and dry (November-March) seasons at five habitat types along the suburban-rural interface of the Epe-Ibeju-Lekki corridor in eastern Lagos State, Nigeria, from April 2025 through March 2026. Sampling employed sweep nets, beat sheets, and visual searches across 25 sampling stations (five habitats × five replicates). A total of 4,678 hemipteran specimens representing 112 species from 23 families were documented. Cicadellidae was the most species-rich family (28 species), while Pentatomidae dominated numerically (1,234 individuals, 26.4%). Wet season collections exceeded dry season catches by a factor of 1.9, with the peak occurring in July-August coinciding with maximum rainfall intensity. Shannon-Wiener diversity was highest in riparian buffer habitats (H' = 3.41) and lowest in residential garden plots (H' = 2.12). Species accumulation curves indicated that sampling achieved approximately 84% estimated completeness for the overall assemblage. Beta diversity analysis revealed that habitat type explained more compositional variation (42.8%) than season (31.2%). The findings demonstrate that hemipteran assemblages in the Lagos suburban-rural interface are structured primarily by habitat heterogeneity, with seasonal rainfall modulating abundance and activity patterns within each habitat context. Conservation of riparian corridors and agricultural margins is recommended as a priority for maintaining hemipteran diversity in this rapidly developing region.
Summary
Source-checkedPlain-language reading of the full paper, prepared with AI and checked against the text. Each point links to the authors' own words.
Why it matters
- Rapid suburban expansion in the Epe and Ibeju-Lekki areas of Lagos, Nigeria, is transforming coastal wetlands, secondary forests, and agricultural lands into urban developments. View evidence ↗
- Lagos experiences a West African monsoon climate characterized by a long wet season from April to October and a shorter dry season from November to March. View evidence ↗
The question
- The study aimed to quantify hemipteran species richness and abundance across five habitat types during wet and dry seasons to determine how habitat and timing influence community composition. View evidence ↗
What they did
- The researchers compared five distinct habitats: residential gardens, vacant lots, active agricultural smallholdings, riparian buffer strips, and mixed scrubland. View evidence ↗
- Sampling was conducted at 25 stations in total, with five replicates per habitat type spaced at least 600 meters apart. View evidence ↗
- Between April 2025 and March 2026, insects were collected biweekly using a combination of sweep nets, beat sheets, and 20-minute visual searches per station. View evidence ↗
What they found
- The study documented 112 species from 23 families, with a total of 4,678 specimens collected over one year. View evidence ↗
- Cicadellidae was the most species-rich family with 28 species, while Pentatomidae was the most numerous, accounting for 26.4% (1,234 individuals) of the total. View evidence ↗
- Insect abundance was significantly higher in the wet season (3,012 individuals) than in the dry season (1,666 individuals), resulting in a ratio of 1.9:1. View evidence ↗
- Riparian buffer habitats exhibited the highest Shannon-Wiener diversity (H' = 3.41), while residential gardens had the lowest (H' = 2.12). View evidence ↗
- Habitat type was the primary driver of community composition, explaining 42.8% of the variation, compared to 31.2% explained by the season. View evidence ↗
- Beta diversity analysis showed that different habitats support distinct species (turnover = 0.64) rather than just smaller versions of the same species pool (nestedness = 0.18). View evidence ↗
What it means
- The authors recommend prioritizing the conservation of riparian corridors and maintaining a mosaic of various habitat types to maximize regional hemipteran diversity. View evidence ↗
- The study may have missed canopy-dwelling species because beat sheet sampling was restricted to branches below 3 meters. View evidence ↗
- Species richness for Miridae and Tingidae may be underestimated because some specimens could not be identified to the species level. View evidence ↗
Visual summary
3 visualsIllustrations explain the paper; charts are replotted from the paper's own table values.
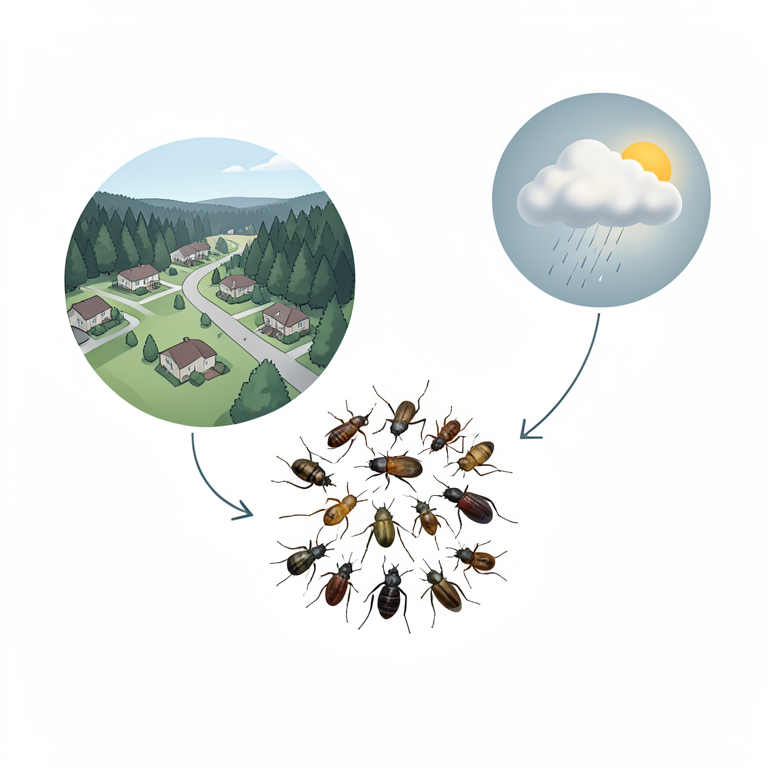
Drivers of Community Composition
AI-generated conceptual illustration (Hemipteran insects (true bugs) in a Nigerian suburban-rural landscape). It explains the idea and does not show study data.
View source evidence ↗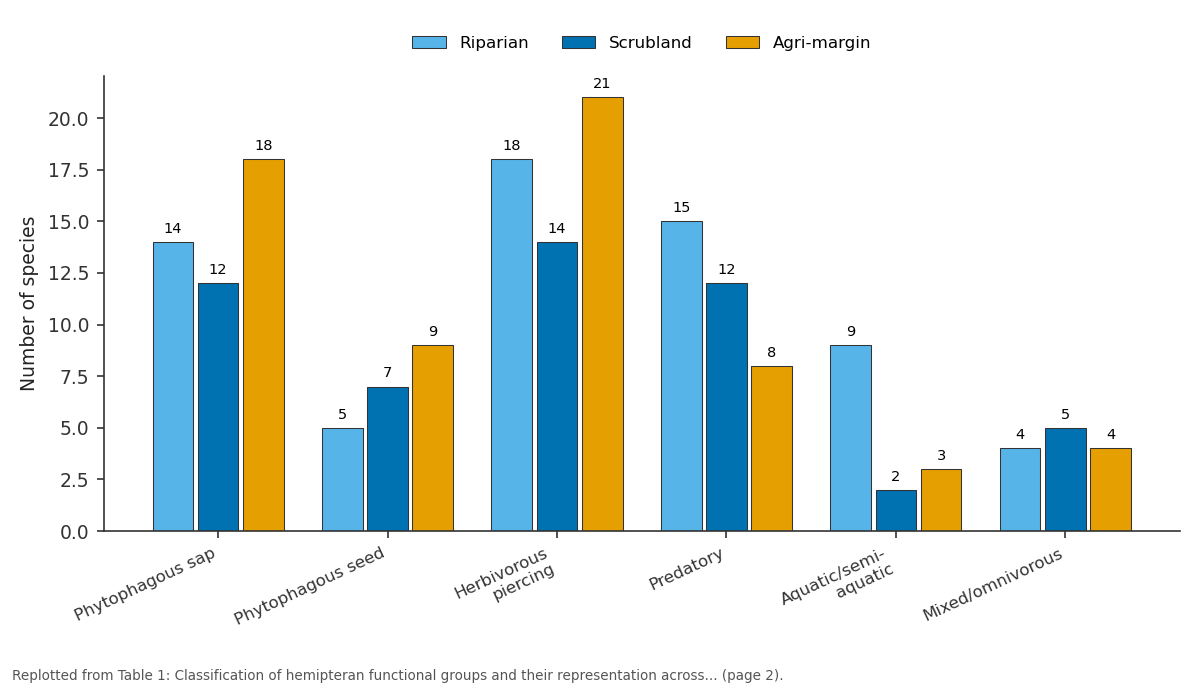
Riparian and Scrubland and more: Phytophagous sap vs Phytophagous seed vs Herbivorous piercing vs Predatory vs Aquatic/semi-aquatic
Replotted from Table 1 (page 2) of the original paper. Every bar is the paper's own table value.
View source evidence ↗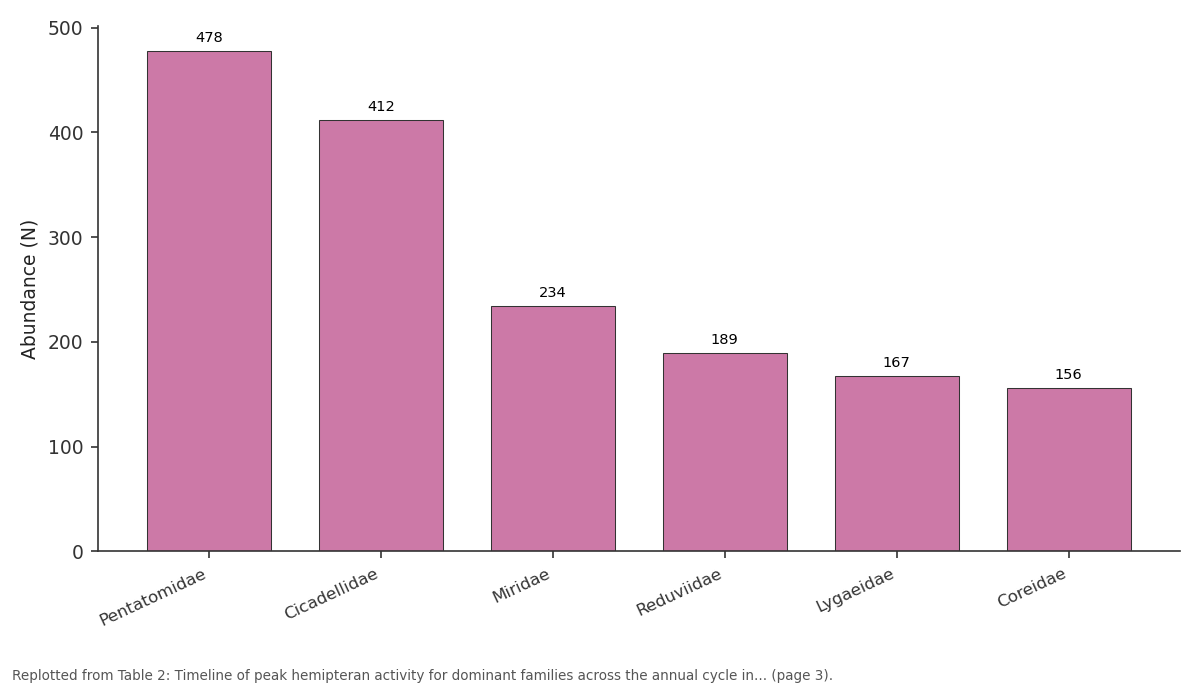
Abundance (N): Pentatomidae vs Cicadellidae vs Miridae vs Reduviidae vs Lygaeidae
Replotted from Table 2 (page 3) of the original paper. Every bar is the paper's own table value.
View source evidence ↗Figures & tables
From the original paper Table 1
 Table 2
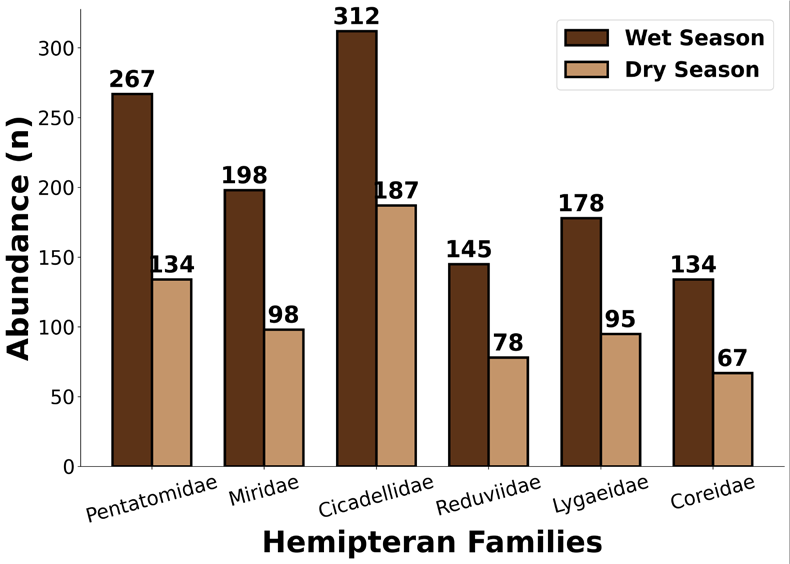 Figure 1
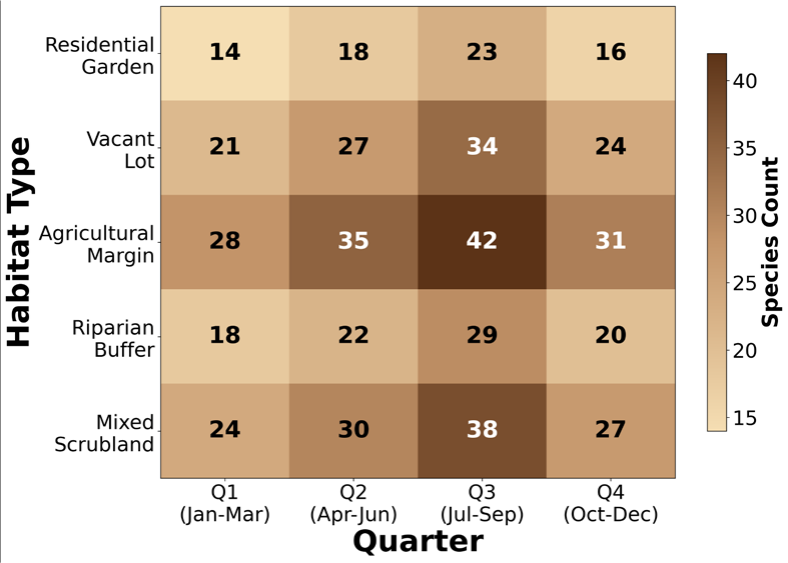 Figure 2
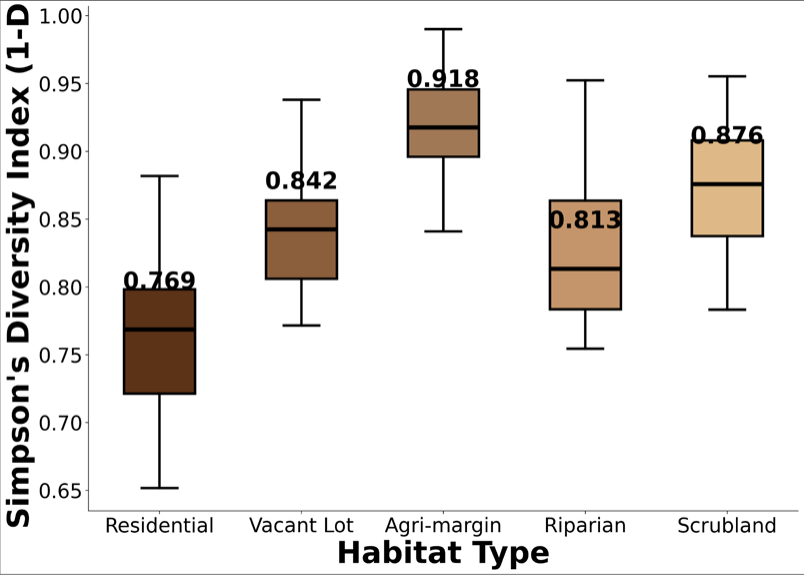 Figure 3
Introduction
The global surge in urban expansion has directed considerable research attention toward understanding how arthropod communities respond to habitat modification along urbanization gradients [1] . However, within this growing body of literature, certain insect orders have received disproportionate attention while others remain comparatively understudied. Hemiptera, the "true bugs" and their allies, represent one such relatively neglected group despite their ecological significance as herbivores, predators, disease vectors, and indicators of vegetation quality [2] . Lagos, Nigeria, stands as the most populous city in sub-Saharan Africa, with a metropolitan population exceeding 16 million and projected to reach 24 million by 2035 [3] . The eastern corridor of Lagos State, encompassing the Epe and Ibeju-Lekki Local Government Areas, has emerged as a primary zone of suburban expansion, driven by the Lekki Free Trade Zone development and associated infrastructure construction [4] . This expansion is converting substantial areas of coastal wetland, secondary forest, and agricultural land into residential and commercial developments, creating a dynamic suburban-rural interface along which habitat conditions change rapidly over short spatial distances. The seasonal climate of Lagos follows a West African monsoon pattern, with a prolonged wet season (April-October) and a shorter dry season (November-March), punctuated by a brief dry interlude (August break) within the wet season [5] . These seasonal oscillations drive pronounced changes in vegetation phenology, soil moisture, and microclimate conditions that are expected to influence hemipteran community dynamics through effects on host plant Availability, reproductive phenology, and predator-prey interactions. Despite the ecological importance and potential indicator value of Hemiptera, no previous research has systematically characterized hemipteran assemblages across the Lagos suburban-rural gradient. This research addressed this gap by comparing hemipteran diversity and community composition across five habitat types during wet and dry seasons, with the objectives of quantifying species richness and abundance patterns, assessing the relative contributions of habitat type and seasonal timing to assemblage variation, and identifying conservation-priority habitats for hemipteran diversity in this rapidly developing region.
Material and methods
Material and methods
Material
The research was conducted along the suburban-rural gradient of the Epe-Ibeju-Lekki corridor in eastern Lagos State, Nigeria (6°25'-6°35'N, 3°50'-4°05'E). The corridor extends approximately 40 km from the expanding Lekki suburban fringe through agricultural hinterland to the Epe Lagoon margins. The climate is equatorial monsoon (Am), with mean annual rainfall of 1,693 mm, mean temperature of 27.2°C, and relative humidity ranging from 65% (February) to 88% (July). Native vegetation comprises lowland rainforest (substantially modified), freshwater swamp forest, and mangrove formations along waterways. Five habitat types were delineated for comparative assessment: (1) residential gardens within planned housing estates (managed lawns, ornamental plantings, fruit trees), (2) vacant lots in development areas (cleared land with ruderal vegetation), (3) active agricultural smallholdings (cassava, maize, vegetable plots with associated margins), (4) riparian buffer strips along seasonal and perennial streams (3-30 m width, retaining gallery forest elements), and (5) mixed scrubland on laterite uplands (secondary regrowth 5-15 years post-disturbance). Five replicate sampling stations were established within each habitat type, totaling 25 stations, with minimum inter-station distance of 600 m.
Methods
Hemipteran sampling was conducted biweekly from April 2025 through March 2026, producing 26 sampling events per station. Three complementary sampling methods were employed: (1) Sweep net surveys along 100-m transects (100 standardized sweeps per transect per event) targeting vegetation-dwelling species; (2) Beat sheet sampling (1 m² white cloth beneath selected woody plants, 10 branches beaten per station per event) targeting arboreal and shrubassociated species; (3) Visual searching of microhabitats (ground litter, bark surfaces, wall surfaces, under stones) for 20 person-minutes per station per event. All hemipteran specimens were preserved in 70% ethanol and identified at the Entomology Research Laboratory of the University of Lagos. Identification utilized regional taxonomic keys including Schuh and Slater's True Bugs of the World, Linnavuori's keys to West African Heteroptera, and Hamilton's keys for Auchenorrhyncha. Difficult specimens were verified through comparison with reference material at the Nigerian Institute for Oceanography and Marine Research. Environmental measurements at each sampling event included ambient temperature and relative humidity (digital psychrometer), vegetation height (3 random measurements), herbaceous ground cover percentage, canopy cover (densiometer), and the number of flowering plant species within 10 m of each station. Monthly rainfall data were obtained from the Nigerian Meteorological Agency Ibeju-Lekki recording station. Alpha diversity was quantified using species richness (S), Shannon-Wiener (H'), and Simpson's (1-D) indices. Beta diversity was partitioned into turnover and nestedness components using the betapart R package. Species accumulation curves were generated using EstimateS v9.1 with Chao 2 estimator. PERMANOVA with 999 permutations tested effects of habitat type and season on community composition. Indicator species analysis identified taxon-habitat and taxon-season associations using the indicspecies package. Variance partitioning was used to decompose the contributions of spatial, temporal, and environmental factors to assemblage variation.
Results
Over the 12-month sampling period, 4,678 hemipteran specimens were collected, representing 112 species across 23 families. The order was partitioned into Heteroptera (78 species, 16 families) and Auchenorrhyncha (34 species, 7 families). Cicadellidae (leafhoppers) was the most speciesrich family overall (28 species), followed by Pentatomidae (15 species), Miridae (14 species), and Reduviidae (12 species). Numerically, Pentatomidae dominated (1,234 individuals, 26.4%), followed by Cicadellidae (978 individuals, 20.9%), Miridae (612 individuals, 13.1%), and Lygaeidae (445 individuals, 9.5%). S pecies accumulation curves for the overall assemblage indicated that the Chao 2 estimated total richness was 133 species, suggesting that sampling achieved approximately 84.2% completeness. Habitat-specific completeness ranged from 78.4% (residential) to 89.7% (riparian), indicating that more intensively vegetated habitats were more thoroughly sampled. Variance partitioning revealed that habitat type explained 42.8% of total compositional variation, season accounted for 31.2%, and their interaction contributed 8.7%. The remaining 17.3% was attributable to unexplained spatial and temporal variation. PERMANOVA confirmed significant effects of both habitat (pseudo-F = 7.23, p = 0.001) and season (pseudo-F = 5.18, p = 0.001). Beta diversity analysis showed that species turnover between habitat types (βturn = 0.64) exceeded nestedness (βnest = 0.18), indicating that habitats differ primarily in species identity rather than representing subsets of a common species pool. Seasonal beta diversity was lower (βturn = 0.41, βnest = 0.12), reflecting greater temporal continuity within habitats than spatial similarity between them. Indicator species analysis identified 14 species with significant habitat associations and 9 with significant seasonal associations (p<0.05). Notable indicators included the predatory reduviid Platymeris biguttatus, strongly associated with scrubland during the wet season (indicator value = 0.79), and the agricultural pest Nezara viridula, abundant in farmland during both seasons (indicator value = 0.84).
Discussion
The hemipteran assemblage documented across the Lagos suburban-rural interface demonstrates a community structured primarily by habitat heterogeneity, with seasonal rainfall serving as a secondary modulator of abundance and activity patterns. The finding that habitat type explains more compositional variation (42.8%) than season (31.2%) underscores the importance of spatial habitat management for conserving hemipteran diversity in this rapidly developing landscape [6] .
The exceptional diversity of riparian buffer habitats (H' = 3.41) reflects the combined effects of moisture availability, structural vegetation complexity, and the microhabitat heterogeneity provided by gallery forest elements along waterways [7] . Riparian zones in tropical landscapes serve as corridors facilitating insect movement between habitat patches and as refugia during unfavorable conditions, functions that are particularly important in fragmented suburban landscapes [8] . The high diversity documented in these narrow linear habitats argues strongly for their protection within urban planning frameworks. The dominance of Pentatomidae in overall abundance is consistent with the global pattern of stink bug numerical predominance in tropical hemipteran assemblages [9] . Several of the most abundant pentatomid species, including Nezara viridula and Acrosternum acutum, are recognized agricultural pests whose populations may be augmented by suburban gardening and farming activities that provide extended periods of host plant availability [2] . The beta diversity pattern, dominated by species turnover rather than nestedness, indicates that different habitats support distinct hemipteran communities rather than impoverished subsets of a regional species pool [10] . This finding has conservation implications: protecting only the most diverse habitat type (riparian buffers) would fail to capture the unique species associated with scrubland, agricultural margins, and other habitat types. A landscapelevel conservation strategy that maintains a mosaic of habitat types is therefore essential for maximizing regional hemipteran diversity. Kumari and Priya [11] reported comparable patterns of habitat-mediated insect diversity variation in transitioning suburban areas, with the finding that less intensively managed habitats consistently supported richer assemblages. The present research extends this understanding to Hemiptera specifically, demonstrating that this taxonomically diverse order responds to suburban habitat gradients in ways broadly consistent with patterns documented for other insect orders [12] . The seasonal wet:dry abundance ratio of 1.9:1 is somewhat lower than the ratios reported for Coleoptera and Lepidoptera in comparable West African settings, suggesting that certain hemipteran lineages (particularly sap-feeding Auchenorrhyncha associated with perennial woody plants) maintain more stable populations across seasonal transitions than herbivorous beetles or nectardependent butterflies [13] . This relative seasonal stability enhances the potential of hemipteran assemblages as yearround indicators of habitat quality, complementing the seasonally variable signals provided by other insect orders.
Conclusion
This research demonstrates that hemipteran diversity in the Lagos suburban-rural interface is governed primarily by habitat heterogeneity, with each of the five habitat types supporting distinct assemblage components that collectively contribute to landscape-level species richness. The 112 documented species, representing 84% of estimated total richness, provide a comprehensive baseline for monitoring future biodiversity responses to continued urban expansion. Conservation priorities should focus on maintaining riparian corridors and restricting development within buffer zones along waterways, while also preserving the mosaic of scrubland, agricultural, and vacant lot habitats that support complementary hemipteran communities. The integration of hemipteran monitoring into urban biodiversity assessment frameworks is recommended, given their ecological significance and relative ease of sampling.
Ethical considerations
All sampling was conducted under permit issued by the Federal Ministry of Environment, National Biodiversity Registry. No collections were made within the Lekki Conservation Centre or any designated protected area.
Sampling protocols avoided the use of chemical attractants or insecticides. The research was approved by the University of Lagos Research Ethics Committee.
Limitations
Beat sheet sampling was limited to accessible branches below 3 m height, potentially missing canopy-dwelling hemipteran species. The August break within the wet season created a brief interruption in the expected seasonal trend that may not be captured as a distinct seasonal phase in the biweekly sampling design. Some Miridae and Tingidae specimens could not be resolved to species level due to taxonomic uncertainty, resulting in potential underestimation of species richness within these families. The unequal area of riparian buffer habitats compared to other habitat types may have introduced confounding area effects.
Acknowledgement
AcknowledgementsThis research was supported by the Tertiary Education Trust Fund (TETFund) Institution-Based Research Grant (TETF/DR&D/CE/UNI/UNILAG/IBR/2024/VOL.1/038). The Nigerian Institute for Oceanography and Marine Research provided access to reference insect collections. The authors gratefully acknowledge Dr. Adewale Ogunwale for assistance with Cicadellidae taxonomy and Mr. Chukwuemeka Nwosu for tireless field assistance throughout the sampling period. Community development committees in Epe and Ibeju-Lekki facilitated access to private lands for sampling.
Figures and tables from the paper
| Functional Group | Families | Total spp. | Riparian | Scrubland | Agri-margin |
|---|---|---|---|---|---|
| Phytophagous sap | Cicadellidae, Cercopidae, Delphacidae | 38 | 14 | 12 | 18 |
| Phytophagous seed | Lygaeidae, Pyrrhocoridae | 12 | 5 | 7 | 9 |
| Herbivorous piercing | Pentatomidae, Miridae, Tingidae | 29 | 18 | 14 | 21 |
| Predatory | Reduviidae, Nabidae, Anthocoridae | 18 | 15 | 12 | 8 |
| Aquatic/semi-aquatic | Gerridae, Veliidae, Corixidae | 9 | 9 | 2 | 3 |
| Mixed/omnivorous | Coreidae, Alydidae | 6 | 4 | 5 | 4 |
Table text extracted from the original PDF; superscript letters are shown inline. The original table image is below.
View original table image
| Family | Peak Period | Peak Month | Abundance (N) | Trigger Factor |
|---|---|---|---|---|
| Pentatomidae | Early wet | May-Jun | 478 | Crop flush |
| Cicadellidae | Mid-wet | Jul-Aug | 412 | Grass growth |
| Miridae | Late wet | Sep-Oct | 234 | Flowering peak |
| Reduviidae | Wet-dry transition | Oct-Nov | 189 | Prey abundance |
| Lygaeidae | Early dry | Nov-Dec | 167 | Seed maturation |
| Coreidae | Mid-wet | Jun-Jul | 156 | Legume fruiting |
Table text extracted from the original PDF; superscript letters are shown inline. The original table image is below.
View original table image
References
23 in the original paper- Fenoglio MS, Rossetti MR, Videla M. Negative effects of urbanization on terrestrial arthropod communities: A meta-analysis. Glob Ecol Biogeogr. 2020;29(8):14121429.
- Schuh RT, Slater JA. True Bugs of the World (Hemiptera: Heteroptera): Classification and Natural History. 2nd ed. Ithaca: Cornell University Press; 2005. p. 89-145.
- Adelekan IO, Johnson C, Manda M, Matyas D, MusahSurugu IJ, Orimoloye IR, et al. governing the risks of urban flooding in African cities: A multi-level governance perspective. Environ Sci Policy. 2023; 142:141-152.
- Aliu IR, Adeyemi OE, Adebayo A. Municipal household solid waste collection strategies in an African megacity: Analysis of public private partnership performance in Lagos. Waste Manag Res. 2014; 32(9 Suppl):67-78.
- Oguntunde PG, Abiodun BJ, Lischeid G. Rainfall trends in Nigeria, 1901-2000. J Hydrol. 2011; 411(34):207-218.
- Tscharntke T, Tylianakis JM, Rand TA, Didham RK, Fahrig L, Batáry P, et al. Landscape moderation of biodiversity patterns and processes. Biol Rev. 2012; 87(3):661-685.
- Naiman RJ, Décamps H. The ecology of interfaces: Riparian zones. Annu Rev Ecol Syst. 1997; 28(1):621658.
- Sauberer N, Zulka KP, Abensperg-Traun M, Berg HM, Bieringer G, Milasowszky N, et al. Surrogate taxa for biodiversity in agricultural landscapes of eastern Austria. Biol Conserv. 2004;117(2):181-190.
- McPherson JE, McPherson RM. Stink Bugs of Economic Importance in America North of Mexico. Boca Raton: CRC Press; 2000. p. 34-56.
- Baselga A. Partitioning the turnover and nestedness components of beta diversity. Glob Ecol Biogeogr. 2010;19(1):134-143.
- Kumari B, Priya A. Seasonal variation in insect biodiversity in a transitioning sub-urban area. Zool Entomol Lett. 2022;2(1):42-49.
- Magagula CN, Nzimba M. Effect of habitat type on diversity of insects associated with urban green spaces in Manzini, Eswatini. Trop Conserv Sci. 2021; 14:19400829211015139.
- Menéndez R. How are insects responding to global warming? Tijdschr Entomol. 2007;150(2):355-365.
- Henry TJ. Biodiversity of Heteroptera. In: Foottit RG, Adler PH, editors. Insect Biodiversity: Science and Society. Oxford: Wiley-Blackwell; 2017. p. 279-335.
- Fattorini S. Insect extinction by urbanization: A long term study in Rome. Biol Conserv. 2011;144(1):370375.
- Stork NE, McBroom J, Gely C, Hamilton AJ. New approaches narrow global species estimates for beetles, insects, and terrestrial arthropods. Proc Natl Acad Sci USA. 2015;112(24):7519-7523.
- Leather SR. Insect sampling in forest ecosystems. In: Leather SR, editor. Methods in Ecology. Oxford: Blackwell Science; 2005. p. 78-102.
- Didham RK, Basset Y, Collins CM, Leather SR, Littlewood NA, Menz MHM, et al. Interpreting insect declines: Seven challenges and a way forward. Insect Conserv Divers. 2020;13(2):103-114.
- Gaston KJ, Smith RM, Thompson K, Warren PH. Urban domestic gardens (II): Experimental tests of methods for increasing biodiversity. Biodivers Conserv. 2005;14(2):395-413.
- Southwood TRE, Henderson PA. Ecological Methods. 3rd ed. Oxford: Blackwell Science; 2000. p. 234-267.
- Samways MJ, McGeoch MA, New TR. Insect Conservation: A Handbook of Approaches and Methods. Oxford: Oxford University Press; 2010. p. 178-203.
- Sekercioglu CH. Bird functional diversity and ecosystem services in tropical forests, agroforests and agricultural areas. J Ornithol. 2012;153(Suppl 1):153161.
- Landis DA, Wratten SD, Gurr GM. Habitat management to conserve natural enemies of arthropod pests in agriculture. Annu Rev Entomol. 2000; 45:175201.