
Research article · 2026 · Full text
International Journal of Geography Geology and EnvironmentRemote sensing and GIS-based assessment of spatio-temporal land use and land cover dynamics in Churachandpur district, Manipur, Northeast India
Volume 8(7) · Pages 53–63 · DOI: 10.22271/27067483.2026.v8.i7a.808 ↗
Research areasRemote Sensing and Land UseLand Use and Ecosystem ServicesRemote-Sensing Image Classification
Abstract
Author-writtenLand use and land cover (LULC) change is a key indicator of environmental transformation, particularly in ecologically fragile mountainous regions. This study examines the spatio-temporal dynamics of LULC in Churachandpur district, Manipur, Northeast India, over a 30-year period (1994-2024) using multi-temporal Landsat datasets and GIS techniques. Landsat 5 TM (1994, 2009) and Landsat 8 OLI (2024) imagery were classified into five categories—vegetation cover, fallow land, agricultural land, built-up area, and water bodies—using the Maximum Likelihood supervised classification algorithm. Classification accuracy assessment based on a confusion matrix yielded satisfactory overall accuracy and kappa statistics across all time periods. Results indicate that vegetation cover remained dominant throughout the study period, while fallow land showed strong temporal variability associated with shifting cultivation practices. Agricultural land exhibited a gradual decline, whereas built-up areas expanded significantly, particularly after 2009, reflecting increasing urbanization and infrastructure development. Water bodies showed a slight but consistent increase. Post-classification change detection revealed pronounced bi-directional transitions between vegetation cover and fallow land, highlighting dynamic land-use cycling. The study underscores significant landscape restructuring driven by socio-economic and environmental processes and provides a baseline for sustainable land management in Northeast India.
Summary
Source-checkedPlain-language reading of the full paper, prepared with AI and checked against the text. Each point links to the authors' own words.
Why it matters
- Land use and land cover (LULC) changes serve as critical indicators of environmental transformation, especially in fragile mountainous areas. View evidence ↗
- Global LULC changes are accelerated by factors such as population growth, urban expansion, infrastructure development, and shifting agricultural practices. View evidence ↗
- Churachandpur district in southern Manipur is defined by its rugged terrain, dense forests, and the prevalence of shifting cultivation. View evidence ↗
The question
- The study aims to analyze the spatial and temporal dynamics of land use and land cover in the Churachandpur district over a 30-year period from 1994 to 2024. View evidence ↗
What they did
- The researchers used Landsat 5 TM imagery for 1994 and 2009, and Landsat 8 OLI imagery for 2024. View evidence ↗
- The Maximum Likelihood supervised classification algorithm was used to categorize the land into five classes: vegetation cover, fallow land, agricultural land, built-up area, and water bodies. View evidence ↗
- Classification accuracy was validated using a confusion matrix, yielding overall accuracies of 89.25% (1994), 94.57% (2009), and 87.16% (2024). View evidence ↗
What they found
- Built-up areas grew consistently, increasing by 49.51 km² (2.05%) overall, with the most rapid expansion (39.19 km²) occurring between 2009 and 2024. View evidence ↗
- Water bodies expanded by 4.87 km² (0.20%) overall, with the majority of the increase occurring between 1994 and 2009 due to the Khuga Dam. View evidence ↗
What it means
- The authors conclude that sustainable land management strategies are necessary to balance development needs with the conservation of the environment. View evidence ↗
- The authors recommend continuous monitoring via geospatial technologies and policy interventions to ensure natural resources are used sustainably. View evidence ↗
Visual summary
3 visualsIllustrations explain the paper; charts are replotted from the paper's own table values.
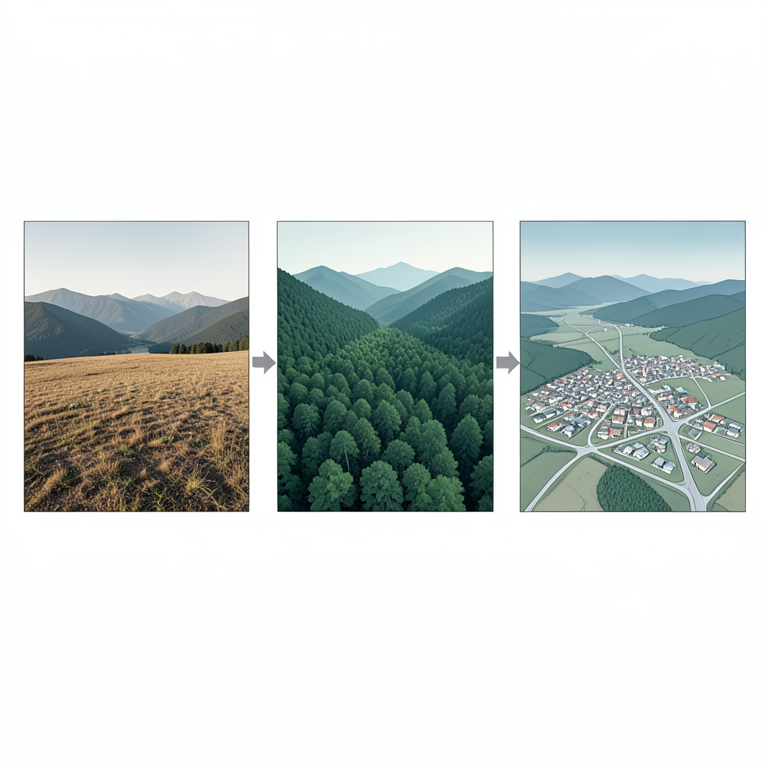
LULC Transition Concept
AI-generated conceptual illustration (mountainous landscape of Churachandpur district, Manipur). It explains the idea and does not show study data.
View source evidence ↗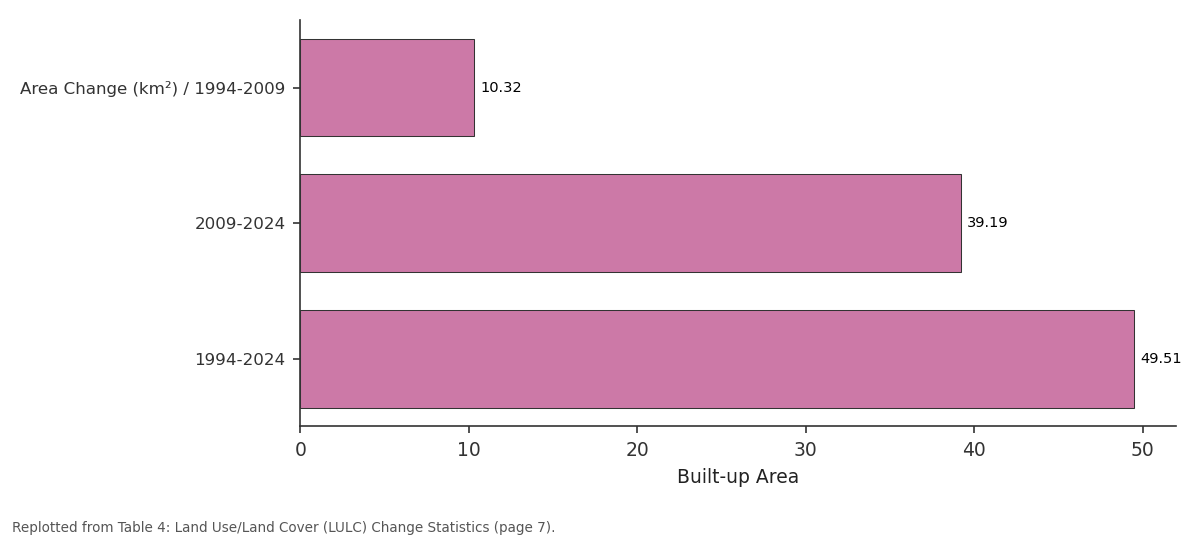
Built-up Area: Area Change (km²) /... vs 2009-2024 vs 1994-2024
Replotted from Table 4 (page 7) of the original paper. Every bar is the paper's own table value.
View source evidence ↗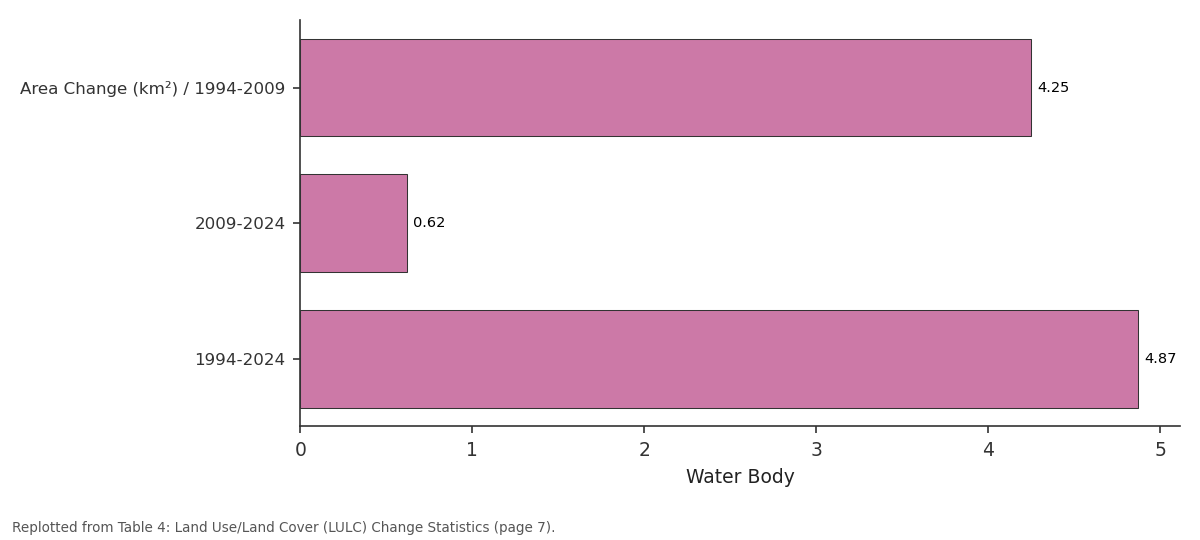
Water Body: Area Change (km²) /... vs 2009-2024 vs 1994-2024
Replotted from Table 4 (page 7) of the original paper. Every bar is the paper's own table value.
View source evidence ↗Figures & tables
From the original paper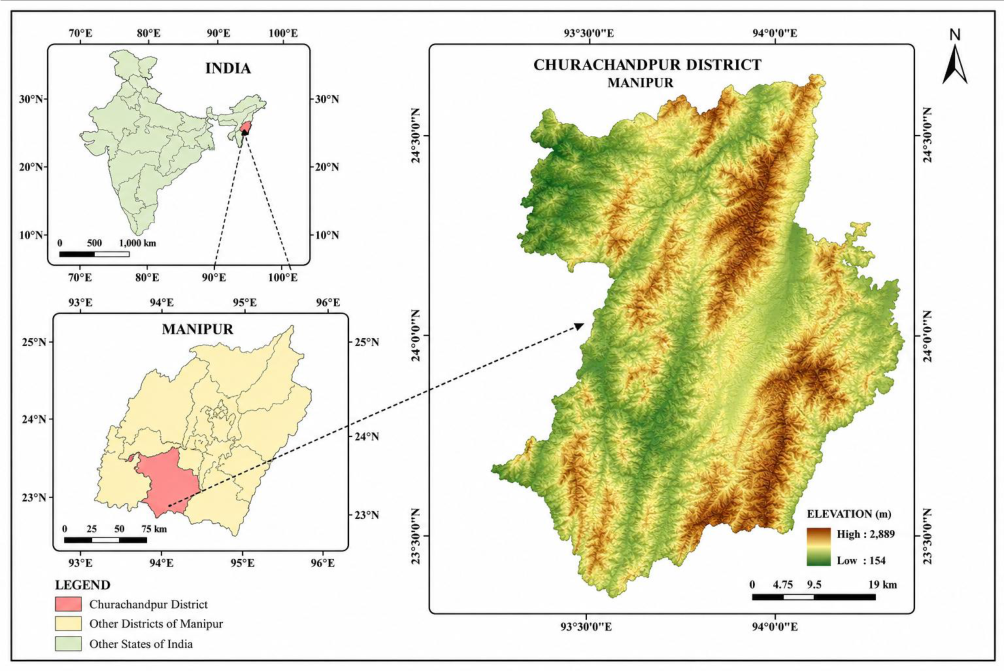 Figure 1
 Table 1
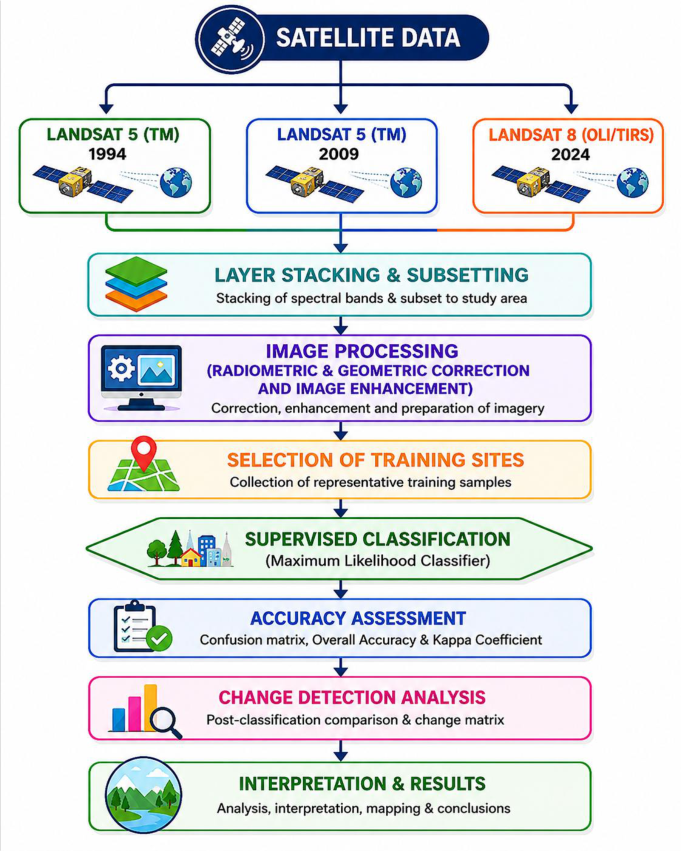 Figure 2
 Table 2
 Table 4
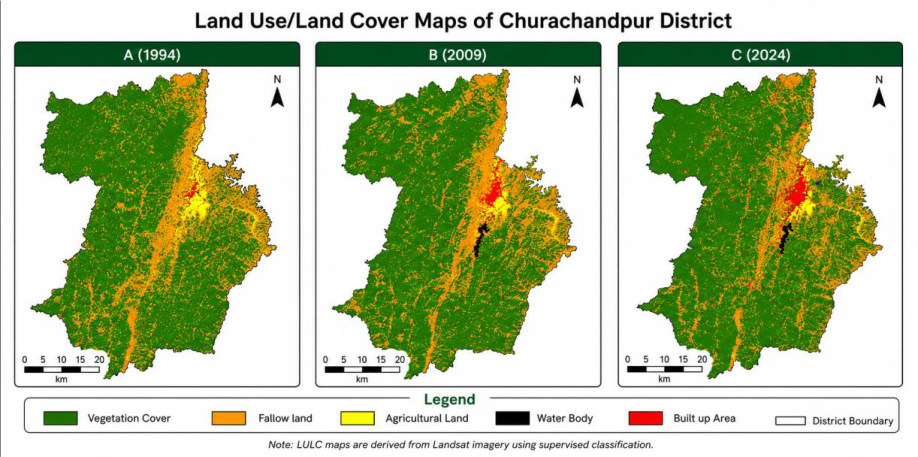 Figure 3
 Table 5
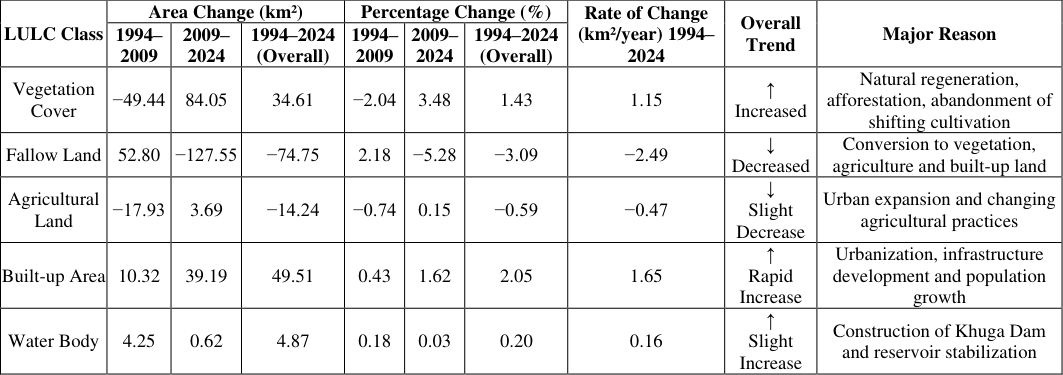 Table 6
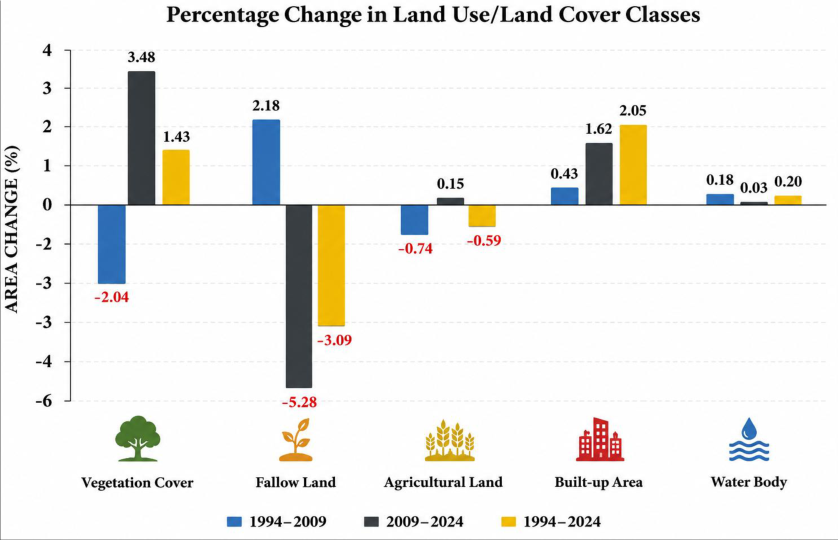 Figure 4
Introduction
Land cover refers to the physical and biophysical attributes of the Earth's surface, including vegetation, water bodies, soil, and built-up areas, whereas land use describes the manner in which humans utilize and manage these resources. As land use directly influences land cover, both concepts are intrinsically linked and are commonly analysed together in environmental and geographical studies. Land use and land cover (LULC) change is a key driver of environmental transformation, significantly affecting ecosystem structure, hydrological processes, biodiversity, soil quality, and local to regional climate systems. Rapid population growth, anthropogenic pressure, urban expansion, infrastructural development, and shifting agricultural practices have accelerated LULC change globally. These changes are particularly pronounced in ecologically fragile mountainous regions, where livelihoods are closely dependent on natural resources and land systems are highly sensitive to disturbance. Remote sensing and Geographic Information System (GIS) technologies have emerged as powerful tools for monitoring and quantifying LULC dynamics. Remote sensing provides repetitive, synoptic, and cost-effective Earth observation data, while GIS enables efficient spatial analysis, modelling, and visualization. The integration of these technologies has therefore become a standard approach in environmental monitoring, land resource management, and regional planning studies. Numerous studies have applied geospatial techniques to assess LULC dynamics across different regions. For instance, Juliev et al. (2019) [7] examined LULC change in Uzbekistan, while Yang et al. (2017) [22] investigated its role in urban heat island intensification in China. In South Asia, rapid urban expansion and associated environmental impacts have been widely reported in Pakistan. In India, LULC studies have been conducted in regions such as the Sikkim Himalaya, Dhanbad district, and Imphal city, while in Manipur, research has focused on forest fragmentation and landscape dynamics in Ukhrul and Senapati districts. Churachandpur district, located in the southern part of Manipur, is characterized by rugged terrain, dense forest cover, and widespread shifting cultivation practices. In recent decades, the district has experienced notable land use changes driven by population growth, urbanization, infrastructure development, and increasing pressure on natural resources. Despite its ecological importance, systematic district-level studies on long-term LULC dynamics in Churachandpur remain limited. Therefore, the present study aims to analyse the spatiotemporal dynamics of LULC in Churachandpur district over a 30-year period (1994-2024) using remote sensing and GIS techniques. The study further identifies major land transformation trends and provides baseline information to support sustainable land management and regional planning in this ecologically sensitive region.
Study Area
Churachandpur district is located in the southern part of Manipur, Northeast India, between 23°56′N to 24°37′N latitude and 93°21′E to 93°53′E longitude (Figure .1). The district forms part of the Manipur Western Hills within the Indo-Myanmar orogenic belt and is characterized by highly dissected mountainous terrain, steep slopes, and narrow valleys. Elevation ranges from approximately 900 to 1000 m above mean sea level, with local variation controlled by structural deformation and fluvial incision.
Physiography
The district exhibits rugged physiography dominated by parallel hill ranges oriented in a north-south direction. The terrain is highly unstable in several locations due to steep slopes, active erosion, and frequent mass-wasting processes. Valley bottoms are relatively narrow and are mainly occupied by settlements and agricultural land, while upland areas are dominated by forest cover and shifting cultivation (jhum) landscapes.
Geology
Geologically, the district is composed predominantly of Tertiary sedimentary formations belonging to the Surma and Barail groups. Lithological units include sandstone, shale, siltstone, and occasional conglomerates. These formations are intensely folded and faulted due to tectonic activity associated with the Indo-Myanmar subduction zone. The region lies in a seismically active belt, and ongoing crustal deformation significantly influences slope instability, drainage evolution, and landform development.
Climate
The district experiences a humid subtropical monsoon climate characterized by warm, humid summers, intense rainfall during the monsoon season, and cool, dry winters. The southwest monsoon contributes the majority of annual rainfall, making the region highly prone to soil erosion, landslides, and rapid geomorphic changes.
Drainage
The drainage system is primarily controlled by structurally guided rivers, including the Khuga, Tuivai, Tuitha, Leimatak, and Manipur rivers. These rivers exhibit dendritic to sub-dendritic drainage patterns in valley regions and are highly responsive to seasonal rainfall variability. The Khuga River system is particularly significant due to the presence of the Khuga Dam, which has also influenced local hydrological and land use conditions.
Vegetation and Land Use
The district is largely covered by dense subtropical hill forests. Vegetation patterns are strongly influenced by altitude, slope, and human intervention. Shifting cultivation (jhum) is widely practiced in upland areas, resulting in a mosaic of forest, secondary vegetation, and fallow land. Increasing anthropogenic pressure has led to gradual conversion of forested areas into agricultural and settlement zones in recent decades.
Socio-economic Profile
According to the Census of India (2011), the district has a population of 226,884 with a literacy rate of 82.78% and a sex ratio of 975 females per 1000 males. Agriculture and forest-based activities form the primary livelihood base. Rapid population growth, infrastructure development, and urban expansion-particularly around Churachandpur town, the district headquarters-have significantly influenced land use dynamics.
Methodology 3.1 Data preparation and processing
Cloud-free (cloud cover <10%) multi-temporal Landsat satellite imagery was utilized to analyse the spatial and temporal dynamics of land use and land cover (LULC) in Churachandpur district, Manipur, over a 30-year period (1994-2024). Landsat 5 Thematic Mapper (TM) imagery was employed for the years 1994 and 2009, whereas Landsat 8 Operational Land Imager (OLI) imagery was used for 2024. All satellite datasets were obtained from the United States Geological Survey (USGS) Earth Resources Observation and Science (EROS) Centre, which provides freely accessible and radiometrically calibrated Earth observation data. To ensure temporal consistency, satellite images corresponding to Path 135 and Row 43 were selected for all three years. Each dataset has a spatial resolution of 30 m, making Landsat imagery suitable for regional-scale LULC mapping and long-term environmental monitoring. Images were acquired during comparable seasons to minimize the influence of seasonal vegetation variability and phenological differences on classification accuracy. Prior to classification, the satellite images underwent a series of standard pre-processing procedures to improve data quality and ensure consistency among the multi-temporal datasets. Radiometric correction was applied to reduce sensor-related noise and convert the digital numbers into standardized reflectance values. Atmospheric correction was subsequently performed to minimize atmospheric scattering and absorption effects, thereby improving spectral consistency between the different acquisition dates. Following radiometric and atmospheric corrections, all images were geometrically corrected and accurately registered to the Universal Transverse Mercator (UTM) coordinate system, WGS 84 datum, ensuring precise pixelto-pixel correspondence among the three temporal datasets. Accurate geometric registration is essential for reliable change detection, as even minor positional errors can significantly affect the interpretation of land-cover transitions. Subsequently, individual spectral bands, including the Blue (B), Green (G), Red (R), Near-Infrared (NIR), and Shortwave Infrared (SWIR) bands, were stacked to generate multispectral composite images suitable for visual interpretation and supervised classification. These spectral bands were selected because they provide valuable information for discriminating vegetation, agricultural land, built-up areas, water bodies, and fallow land. The administrative boundary of Churachandpur district was then used to clip the satellite images, thereby restricting the analysis exclusively to the study area. This step reduced computational requirements and eliminated unnecessary information outside the district boundary. A summary of the satellite datasets, including sensor type, acquisition date, spatial resolution, and path/row information, is presented in Table 1, while the overall methodological framework adopted for image preprocessing, supervised classification, accuracy assessment, and change detection is illustrated in Figure 2. The combination of supervised classification, postclassification comparison, and change matrix analysis enabled a comprehensive assessment of the magnitude, direction, and rate of LULC changes in Churachandpur district over the 30-year study period.
| Sl. No. | Satellite Data | Date of acquisition | Path | Row | Resolution(m) |
|---|---|---|---|---|---|
| 1 | Landsat 5 TM | 21/Feb/1994 | 135 | 43 | 30 |
| 2 | Landsat 5 TM | 14/Feb/2009 | 135 | 43 | 30 |
| 3 | Landsat 8 OLI | 11/Mar/2024 | 135 | 43 | 30 |
Table text extracted from the original PDF; superscript letters are shown inline. The original table image is below.
View original table image
Accuracy Assessment
Accuracy assessment and error matrix analysis are widely used to evaluate the reliability of classified remote sensing outputs (Reis, 2008) [12] . In this study, classification accuracy was assessed for each LULC map to validate the reliability of the results (Devi and Shimrah, 2022) [3] . Accuracy assessment is a fundamental component of remotely sensed data analysis as it determines the quality and robustness of the classification output (Congalton, 2001; Sharma et al., 2016) [2, [15] . A confusion matrix (error matrix) was constructed by comparing classified data with reference data to evaluate classification performance. High-resolution imagery from Google Earth Pro was used as the reference dataset for validation. From the confusion matrix, overall accuracy, kappa coefficient, producer's accuracy (omission error), and user's accuracy (commission error) were derived.
Overall accuracy represents the proportion of correctly classified pixels to the total number of reference pixels within the error matrix (Anand, 2017) [1] . The kappa coefficient provides a statistical measure of agreement between classified and reference data beyond chance agreement. Producer's accuracy indicates the probability that a reference pixel is correctly classified, whereas user's accuracy represents the probability that a classified pixel actually corresponds to the real-world category.
The kappa coefficient and overall accuracy were computed using Equations ( 2) and (3), respectively. Producer's and user's accuracies were calculated using Equations ( 4) and ( 5) following Shimrah et al. (2022) [3] .
( Where, = correctly identified pixels in the class = row total for the considered class.
Results
Results
Accuracy Assessment
Accuracy assessment is an essential step in land use/land cover (LULC) classification, as it evaluates the reliability and quality of the classified maps by comparing the classified data with reference (ground truth) information. In the present study, the accuracy of the supervised classification was assessed using a confusion (error) matrix, from which the Overall Accuracy (OA), Producer's Accuracy (PA), User's Accuracy (UA), and the Kappa coefficient (κ) were calculated. These statistical measures provide a comprehensive evaluation of classification performance by quantifying both omission and commission errors.
The classification results demonstrated a high level of accuracy for all three study years ( Overall, the accuracy assessment demonstrates that the supervised classification approach adopted in this study produced highly reliable LULC maps for all three study years. The overall accuracy values exceeded the commonly accepted threshold of 85%, while the Kappa coefficients consistently remained above 0.80, confirming strong agreement between the classified maps and the reference data. These results validate the suitability of the classification methodology and provide confidence in the subsequent LULC change detection and spatial analysis conducted for Churachandpur district The classified LULC maps for the three study years are presented in Figure 3, illustrating the spatial distribution and temporal evolution of the major land-cover classes. Vegetation cover remained the dominant land-cover category throughout the study period, occupying a substantial proportion of the district. Fallow land was mainly distributed along the central and eastern parts of the district, reflecting the widespread practice of shifting cultivation. Agricultural land was concentrated in valley bottoms and relatively gentle slopes, whereas built-up areas were primarily confined to Churachandpur town and surrounding settlements, showing noticeable expansion over time. Water bodies occupied the smallest proportion of the study area, with a marked increase after 2009 following the impoundment of the Khuga Dam reservoir.
Vegetation Cover
Vegetation cover experienced a decline of 49.44 km² (-2.04%) between 1994 and 2009. However, during 2009-2024, it increased substantially by 84.05 km² (3.48%), resulting in a net gain of 34.61 km² (1.43%) over the entire study period. The average annual rate of change was 1.15 km²/year, indicating an overall recovery of vegetation, likely due to natural regeneration, afforestation, and the abandonment of some shifting cultivation areas.
Fallow Land
Fallow land increased by 52.80 km² (2.18%) during 1994-2009, reflecting the widespread practice of shifting cultivation. In contrast, it declined sharply by 127.55 km² (-5.28%) between 2009 and 2024. Consequently, the overall change from 1994 to 2024 was a decrease of 74.75 km² (-3.09%), with an annual rate of -2.49 km²/year. This reduction suggests that many fallow areas were converted into vegetation, agricultural land, or built-up areas.
Agricultural Land
Agricultural land decreased by 17.93 km² (-0.74%) during the first period but showed a slight increase of 3.69 km² (0.15%) during 2009-2024. Overall, agricultural land recorded a net loss of 14.24 km² (-0.59%), corresponding to an annual decline of 0.47 km²/year. This trend indicates a gradual reduction in cultivated land, possibly due to urban expansion, land abandonment, and changing agricultural practices.
Built-up Area
Built-up area exhibited continuous growth throughout the study period. It increased by 10.32 km² (0.43%) between 1994 and 2009 and expanded more rapidly by 39.19 km² (1.62%) during 2009-2024. Overall, the built-up area increased by 49.51 km² (2.05%), with the highest annual growth rate of 1.65 km²/year among all LULC classes. This substantial increase reflects rapid urbanization, population growth, infrastructure development, and expansion of settlements across the district.
Water Body
Water bodies increased by 4.25 km² (0.18%) between 1994 and 2009, primarily due to the impoundment created by the Khuga Dam. A further but marginal increase of 0.62 km² (0.03%) occurred during 2009-2024. Overall, water bodies expanded by 4.87 km² (0.20%), with an annual rate of change of 0.16 km²/year, indicating that the water surface remained relatively stable after the dam became operational.
Overall Interpretation
The results indicate that Churachandpur district experienced significant land use transformations over the last three decades. The most notable changes include the rapid expansion of built-up areas, reflecting increasing urbanization and infrastructure development, and the marked decline in fallow land, suggesting changes in shifting cultivation practices and land conversion. Vegetation cover showed a net increase over the entire study period, indicating partial ecological recovery despite earlier losses. Agricultural land experienced a slight overall decline, while water bodies remained relatively stable following the construction of the Khuga Dam. These findings highlight the combined influence of anthropogenic activities and natural processes on landscape dynamics and emphasize the importance of sustainable land-use planning for conserving natural resources and supporting balanced regional development. 5 presents the corresponding changes in area (km²), percentage change (%), and annual rate of change (km²/year). Together, they provide a comprehensive understanding of the temporal dynamics of land-use change in the district. Vegetation cover experienced contrasting trends during the study period. Between 1994 and 2009, it declined by 49.44 km² (-2.04%), indicating the conversion of forested land into fallow land, agricultural land, and settlements. However, during 2009-2024, vegetation cover increased substantially by 84.05 km² (3.48%), resulting in a net increase of 34.61 km² (1.43%) over the entire study period, with an average annual gain of 1.15 km²/year. The graph clearly shows this reversal, suggesting vegetation recovery through natural regeneration, plantation activities, and reduced pressure from shifting cultivation in some areas. Fallow land showed the greatest fluctuation among all LULC classes. It increased by 52.80 km² (2.18%) during 1994-2009, reflecting the widespread practice of shifting cultivation (jhum). However, it decreased sharply by 127.55 km² (-5.28%) between 2009 and 2024, leading to an overall decline of 74.75 km² (-3.09%), with the highest annual rate of decrease (-2.49 km²/year). The graph highlights this dramatic decline, indicating that large areas of fallow land were converted into vegetation, agricultural land, and builtup areas. Agricultural land showed relatively minor changes compared to the other classes. It declined by 17.93 km² (-0.74%) during the first period, followed by a slight increase of 3.69 km² (0.15%) during 2009-2024. Despite this recovery, the overall change remained negative, with a net loss of 14.24 km² (-0.59%) and an annual decline of 0.47 km²/year. The graph reflects these modest fluctuations, suggesting that agricultural land remained comparatively stable, although some cultivated land was converted for other purposes. Built-up area recorded the most consistent and rapid increase throughout the study period. It expanded by 10 Water bodies exhibited only minor changes during the study period. They increased by 4.25 km² (0.18%) between 1994 and 2009, primarily due to the formation of the Khuga Dam reservoir, followed by a marginal increase of 0.62 km² (0.03%) during 2009-2024. Consequently, water bodies showed an overall increase of 4.87 km² (0.20%), with an annual growth rate of 0.16 km²/year. The graph indicates that most of the increase occurred during the first period, after which the extent of water bodies remained largely stable. Overall, both the graph and Table 5 demonstrate that Churachandpur district has undergone significant landscape transformation during the past three decades. The most prominent changes include the rapid expansion of built-up areas, the substantial decline in fallow land, and the recovery of vegetation cover after 2009. Agricultural land experienced only a slight overall decline, whereas water bodies remained relatively stable following the construction of the Khuga Dam. These patterns indicate that urbanization, infrastructure development, shifting cultivation practices, and natural vegetation regeneration have been the primary drivers of land-use change. The combined graphical and tabular analysis provides valuable information for sustainable land-use planning, natural resource management, and environmental conservation in Churachandpur district. The simultaneous increase in built-up areas and vegetation cover, together with the decline in fallow and agricultural lands, reflects the evolving interaction between socioeconomic development and environmental processes.
| LULC Classes | Area Change (km²) | — | — | Percentage Change (%) | — | — | Rate of Change (km²/year) C 1994-2024 |
|---|---|---|---|---|---|---|---|
| 1994-2009 | 2009-2024 | 1994-2024 | 1994-2009 | 2009-2024 | 1994-2024 | ||
| Vegetation Cover | −49.44 | 84.05 | 34.61 | −2.04 | 3.48 | 1.43 | 1.15 |
| Fallow Land | 52.80 | −127.55 | −74.75 | 2.18 | −5.28 | −3.09 | −2.49 |
| Agricultural Land | −17.93 | 3.69 | −14.24 | −0.74 | 0.15 | −0.59 | −0.47 |
| Built-up Area | 10.32 | 39.19 | 49.51 | 0.43 | 1.62 | 2.05 | 1.65 |
| Water Body | 4.25 | 0.62 | 4.87 | 0.18 | 0.03 | 0.20 | 0.16 |
Table text extracted from the original PDF; superscript letters are shown inline. The original table image is below.
View original table image
The study confirms that remote sensing and GIS provide an efficient and reliable approach for monitoring long-term landscape dynamics. The generated LULC database and change analysis offer valuable baseline information for understanding land transformation patterns and their environmental implications. These findings can support evidence-based decision-making for sustainable land-use planning, forest conservation, watershed management, biodiversity protection, and balanced regional development.
In conclusion, the observed LULC changes emphasize the importance of implementing sustainable land management strategies that balance developmental needs with environmental conservation. Continuous monitoring using geospatial technologies, combined with appropriate policy interventions, will be essential for ensuring the sustainable utilization of natural resources and maintaining ecological integrity in Churachandpur district in the future.
Acknowledgement
AcknowledgementsThe author gratefully acknowledges Dr. Manichandra Sanoujam for his help. The author also expresses sincere gratitude to Prof. H. Manoranjan Sharma, Principal, Waikhom Mani Girls' College, Thoubal, Manipur, India, for his support and encouragement.
Figures and tables from the paper
| Sl. No. | Year | Overall Accuracy | Kappa Coefficient |
|---|---|---|---|
| 1 | 1994 | 89.25% | 0.85 |
| 2 | 2009 | 94.57% | 0.92 |
| 3 | 2024 | 87.16% | 0.83 |
Table text extracted from the original PDF; superscript letters are shown inline. The original table image is below.
View original table image
| LULC Classes | Area Change (km²) | — | — | Percentage Change (%) | — | — | Rate of Change (km²/year) C 1994-2024 |
|---|---|---|---|---|---|---|---|
| 1994-2009 | 2009-2024 | 1994-2024 | 1994-2009 | 2009-2024 | 1994-2024 | ||
| Vegetation Cover | −49.44 | 84.05 | 34.61 | −2.04 | 3.48 | 1.43 | 1.15 |
| Fallow Land | 52.80 | −127.55 | −74.75 | 2.18 | −5.28 | −3.09 | −2.49 |
| Agricultural Land | −17.93 | 3.69 | −14.24 | −0.74 | 0.15 | −0.59 | −0.47 |
| Built-up Area | 10.32 | 39.19 | 49.51 | 0.43 | 1.62 | 2.05 | 1.65 |
| Water Body | 4.25 | 0.62 | 4.87 | 0.18 | 0.03 | 0.20 | 0.16 |
Table text extracted from the original PDF; superscript letters are shown inline. The original table image is below.
View original table image
References
22 in the original paper- Anand A. Accuracy assessment. In: Processing and Classification of Remotely Sensed Images. 2017. p. 5977.
- Congalton RG. Accuracy assessment and validation of remotely sensed and other spatial information. Int J Wildland Fire. 2001;10(4):321-328.
- Devi AR, Shimrah T. Assessment of land use and land cover and forest fragmentation in traditional landscape in Manipur, Northeast India. Int J Environ Sci Technol. 2022;19(10):10291-10306.
- Foresman TW, Pickett STA, Zipperer WC. Methods for spatial and temporal land use and land cover assessment for urban ecosystems and application in the Greater Baltimore-Chesapeake region. Urban Ecosyst. 1997;1(4):201-216.
- Haokip TL, Gangte PL, Prasad TK, Haokip K, Shah MB. Integrating remote sensing and GIS for land use land cover detection and terrain evaluation in Churachandpur District, Manipur, India. 2025.
- Hasan SS, Zhen L, Miah MG, Ahamed T, Samie A. Impact of land use change on ecosystem services: A review. Environ Dev. 2020;34:100527.
- Juliev M, Pulatov A, Fuchs S, Hübl J. Analysis of land use land cover change detection of Bostanlik District, Uzbekistan. Pol J Environ Stud. 2019;28(5):3235-3248.
- Kachhwala TS. Temporal monitoring of forest land for change detection and forest cover mapping through satellite remote sensing. In: Proceedings of the 6th Asian Conference on Remote Sensing. Hyderabad, India; 1985. p. 77-83.
- Mishra PK, Rai A, Rai SC. Land use and land cover change detection using geospatial techniques in the Sikkim Himalaya, India. Egypt J Remote Sens Space Sci. 2020;23(2):133-143.
- Nabakumar T. Geography of Manipur: A comprehensive study. January 2026 ed. p. 570-571.
- Rawat JS, Kumar M. Monitoring land use/cover change using remote sensing and GIS techniques: A case study of Hawalbagh Block, District Almora, Uttarakhand, India. Egypt J Remote Sens Space Sci. 2015;18(1):7784.
- Reis S. Analyzing land use/land cover changes using remote sensing and GIS in Rize, North-East Turkey. Sensors. 2008;8(10):6188-6202.
- Roy PS, Roy A. Land use and land cover change in India: A remote sensing and GIS perspective. J Indian Inst Sci. 2010;90(4):489-502.
- Sadiq Khan M, Ullah S, Sun T, Rehman AU, Chen L. Land use/land cover changes and its contribution to urban heat island: A case study of Islamabad, Pakistan. Sustainability. 2020;12(9):3861.
- Sharma M, Areendran G, Raj K, Sharma A, Joshi PK. Multitemporal analysis of forest fragmentation in the Hindu Kush Himalaya: A case study from Khangchendzonga Biosphere Reserve, Sikkim, India. Environ Monit Assess. 2016;188(10):596.
- Shimrah T, Lungleng P, Devi AR, Sarma K, Varah F, Khuman YS. Spatio-temporal assessment of land use and land cover (LULC) and forest fragmentation in a shifting agroecosystem landscape in Ukhrul District, Manipur, Northeast India. Environ Monit Assess. 2022;194(1):14.
- Singh RK, Singha M, Singh SK, Pal D, Tripathi N, Singh RS. Land use/land cover change detection analysis using remote sensing and GIS in Dhanbad District, India. Eurasian J For Sci. 2018;6(2):1-12.
- Sohl T, Sleeter B. Role of remote sensing for land-use and land-cover change modeling. In: Remote Sensing of Land Use and Land Cover. 2012. p. 225-239.
- Tiwari MK, Saxena A. Change detection of land use/land cover pattern in and around Mandideep and Obedullaganj using remote sensing and GIS. Int J Technol Eng Syst. 2011;2(3):398-402.
- Tungnung JZ, Anand S. Dynamics of urban sprawl and land use change in Imphal, Manipur, India. Space Cult India. 2017;5(2):69-83.
- Turner MG, Ruscher CL. Changes in landscape patterns in Georgia, USA. Landsc Ecol. 1988;1(4):241-251.
- Yang C, He X, Yan F, Yu L, Bu K, Yang J, Zhang A, Zhang S. Mapping the influence of land use/land cover changes on the urban heat island effect: A case study of Changchun, China. Sustainability. 2017;9(2):312.