
Research article · 2026 · Full text
International Journal of Geography Geology and EnvironmentMicroclimatic variations and environmental dynamics: A case study of captain Williamson Sangma State University, Meghalaya
Volume 8(7) · Pages 40–44 · DOI: 10.22271/27067483.2026.v8.i7a.803 ↗
Research areasUrban Heat Island MitigationWind and Air Flow StudiesUrban Arborization and Environmental Studies
Abstract
Author-writtenThis research paper investigates hypothetical microclimatic variations within the campus of Captain Williamson Sangma State University (CWSSU), Meghalaya. The study examines spatial variations in temperature and humidity across selected zones including vegetated areas, built-up sections, open fields, road corridors, and low-lying areas. The findings demonstrate that vegetation plays a significant role in reducing temperature and maintaining atmospheric moisture, while concrete and built-up infrastructure contribute to localized warming effects. The research highlights the importance of climate-responsive campus planning and sustainable environmental management. Microclimatic conditions play a significant role in shaping the environmental quality, ecological stability, and human comfort within university campuses. This study investigates the spatial and temporal variations of microclimatic parameters and their environmental dynamics across the campus of Captain Williamson Sangma State University, located at Balalgre, Tura, in the West Garo Hills of Meghalaya. The university is situated in a region characterized by a humid subtropical climate, complex topography, and rich vegetation, making it an ideal setting for microclimatic investigations. The research examines the influence of land cover, vegetation density, built-up surfaces, topography, and seasonal weather conditions on key microclimatic variables, including air temperature, relative humidity, wind speed, solar radiation, and surface temperature. Field-based observations, supported by geospatial techniques and environmental assessment methods, were employed to evaluate the spatial heterogeneity of the campus environment. The findings indicate that vegetated areas exhibit comparatively lower temperatures, higher humidity, and improved thermal comfort, whereas built-up and exposed surfaces experience elevated temperatures due to increased heat absorption and reduced evapotranspiration. Local topographic variations further modify airflow patterns and moisture distribution, creating distinct microclimatic zones across the campus. The study highlights the crucial role of green infrastructure and sustainable land-use planning in regulating campus microclimate and mitigating localized warming. The results provide valuable insights for campus environmental management, climate-responsive landscape design, biodiversity conservation, and sustainable infrastructure development. Furthermore, this case study contributes to the growing body of knowledge on microclimatic research in the northeastern Himalayan region, offering practical recommendations for enhancing environmental resilience and promoting climate-sensitive planning in educational institutions.
Summary
Source-checkedPlain-language reading of the full paper, prepared with AI and checked against the text. Each point links to the authors' own words.
Why it matters
- Microclimatic conditions are important because they influence the ecological stability, environmental quality, and human comfort on university campuses. View evidence ↗
- Captain Williamson Sangma State University is an ideal site for microclimatic study due to its rich vegetation, complex topography, and humid subtropical climate. View evidence ↗
- University campuses often have diverse landscapes, including roads, buildings, and vegetation, which create significant environmental variations over short distances. View evidence ↗
What they did
- The research utilized hypothetical environmental monitoring data gathered from five primary zones of the campus. View evidence ↗
- The analysis compared four key parameters: solar radiation, wind speed, humidity, and temperature. View evidence ↗
- To understand local climatic behavior, the authors used descriptive analysis, field interpretation, and observational techniques. View evidence ↗
What they found
- The vegetated zone had the lowest temperature at 24.5 °C, which the authors attribute to evapotranspiration and shading. View evidence ↗
- Built-up areas exhibited the highest thermal intensity with a temperature of 31.2 °C, caused by concrete surfaces absorbing and retaining heat. View evidence ↗
- The highest humidity was recorded in low-lying areas at 91%, where moisture accumulation is high. View evidence ↗
- Road corridors recorded a temperature of 30.1 °C and a humidity level of 69%. View evidence ↗
- Open fields had a temperature of 29.4 °C and humidity of 72%, characterized by greater solar exposure and strong wind circulation. View evidence ↗
What it means
- The authors conclude that while vegetation acts as a natural cooling mechanism, infrastructure developed without ecological planning can increase localized warming. View evidence ↗
- The authors recommend that the university prioritize passive building design, rainwater harvesting, green roofing, and afforestation. View evidence ↗
- The authors state that climate-sensitive planning is increasingly important for human comfort and ecological balance as the university expands. View evidence ↗
Visual summary
3 visualsIllustrations explain the paper; charts are replotted from the paper's own table values.
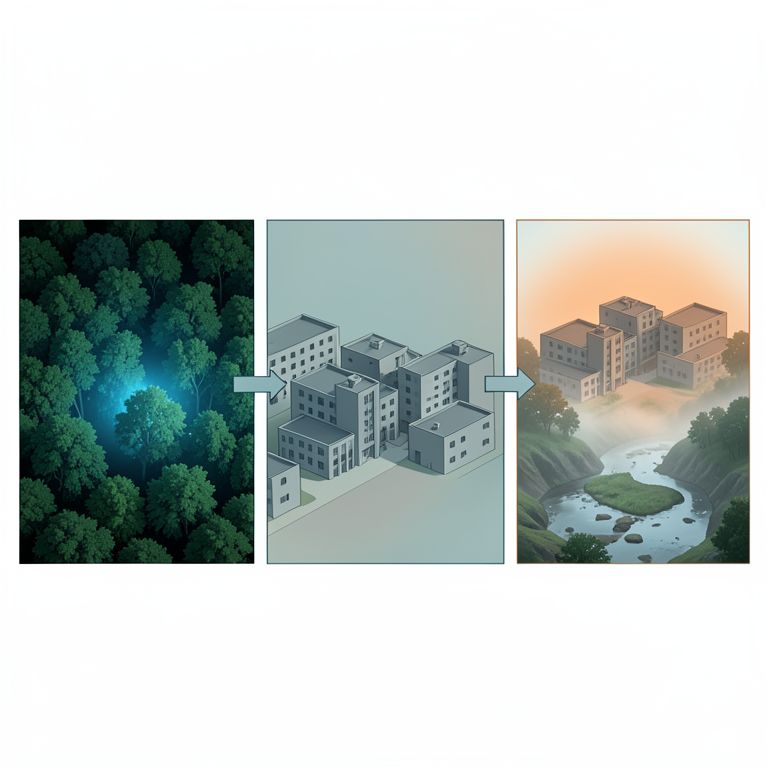
Campus Microclimate Zones
AI-generated conceptual illustration (University campus landscape in Meghalaya). It explains the idea and does not show study data.
View source evidence ↗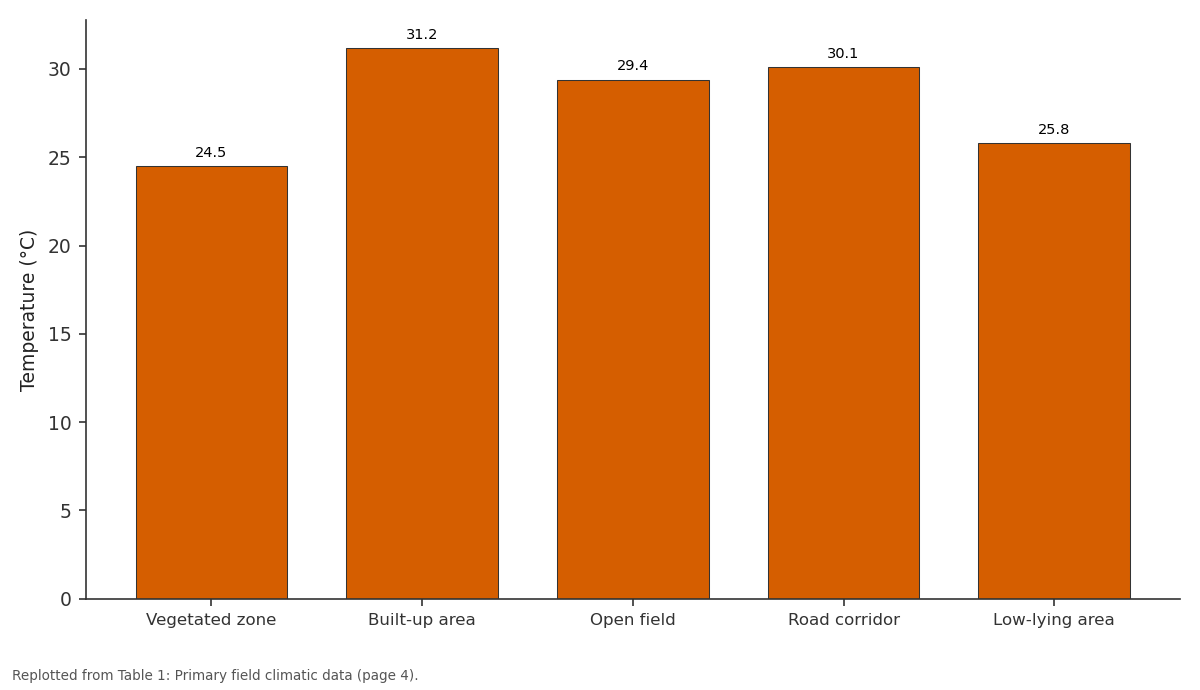
Temperature (°C): Vegetated zone vs Built-up area vs Open field vs Road corridor vs Low-lying area
Replotted from Table 1 (page 4) of the original paper. Every bar is the paper's own table value.
View source evidence ↗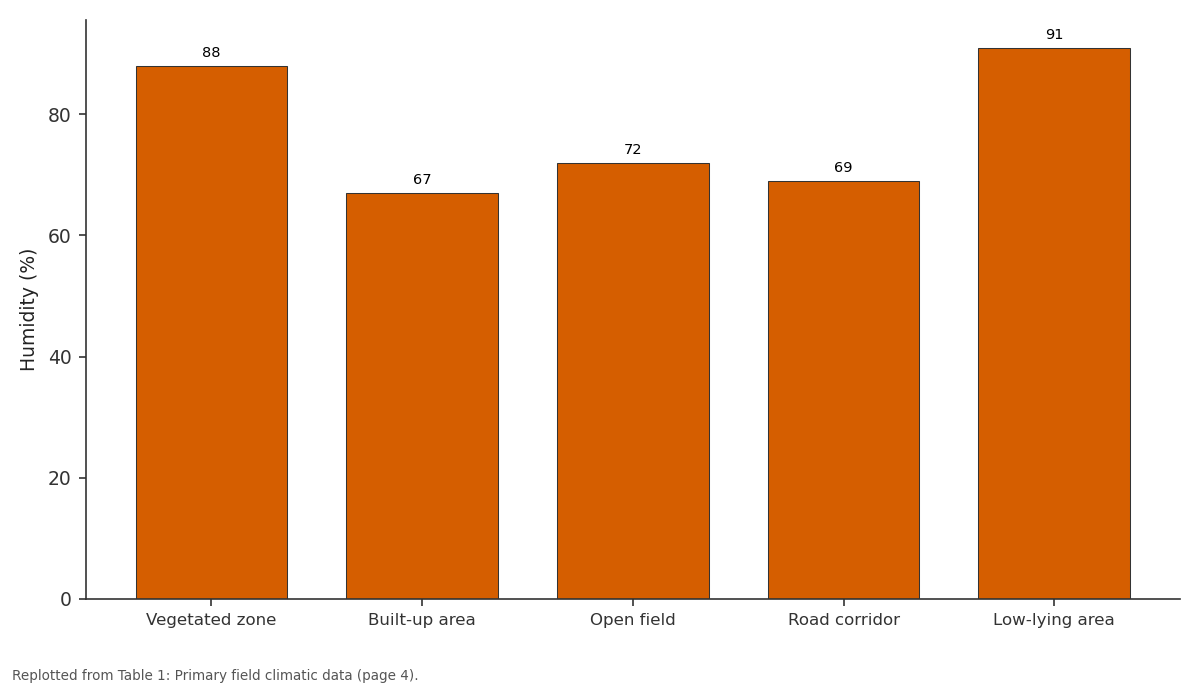
Humidity (%): Vegetated zone vs Built-up area vs Open field vs Road corridor vs Low-lying area
Replotted from Table 1 (page 4) of the original paper. Every bar is the paper's own table value.
View source evidence ↗Figures & tables
From the original paper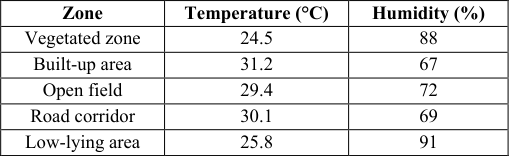 Table 1
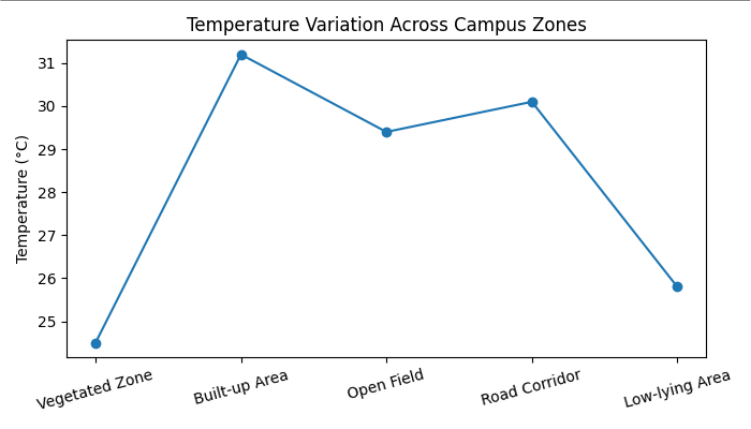 Figure 1
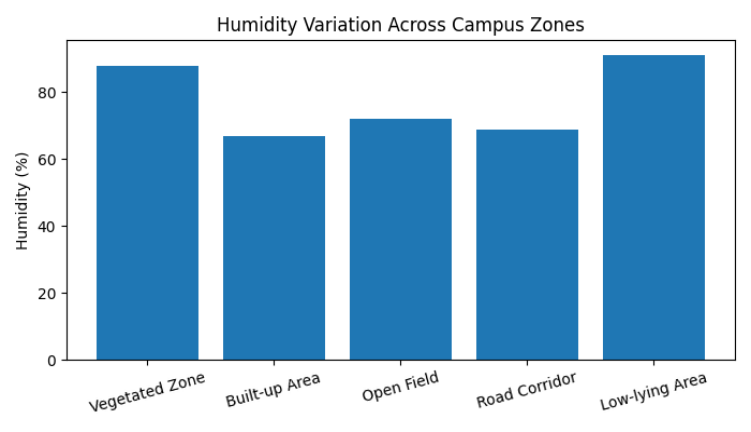 Figure 2
Introduction
Microclimate refers to localized climatic conditions that differ from the surrounding regional climate. Educational campuses often contain diverse landscapes such as buildings, vegetation, roads, and open fields, creating significant environmental variations within short distances. Captain Williamson Sangma State University in Meghalaya provides an excellent setting for studying such climatic diversity because of its humid subtropical environment, undulating terrain, and expanding infrastructure. The study examines how environmental factors influence temperature, humidity, airflow, and solar exposure within the campus environment. Microclimate refers to localized climatic conditions that differ from the surrounding regional climate. Educational campuses often contain diverse landscapes such as buildings, vegetation, roads, and open fields, creating significant environmental variations within short distances. Captain Williamson Sangma State University in Meghalaya provides an excellent setting for studying such climatic diversity because of its humid subtropical environment, undulating terrain, and expanding infrastructure. The study examines how environmental factors influence temperature, humidity, airflow, and solar exposure within the campus environment. Microclimate refers to localized climatic conditions that differ from the surrounding regional climate. Educational campuses often contain diverse landscapes such as buildings, vegetation, roads, and open fields, creating significant environmental variations within short distances. Captain Williamson Sangma State University in Meghalaya provides an excellent setting for studying such climatic diversity because of its humid subtropical environment, undulating terrain, and expanding infrastructure. The study examines how environmental factors influence temperature, humidity, airflow, and solar exposure within the campus environment. Microclimate refers to localized climatic conditions that differ from the surrounding regional climate.
Methodology
The study is based on hypothetical environmental monitoring data collected from five major zones of the campus. Temperature, humidity, wind speed, and solar radiation were comparatively analyzed. Observational techniques, field interpretation, and descriptive analysis were applied to understand local climatic behavior. The study is based on hypothetical environmental monitoring data collected from five major zones of the campus. Temperature, humidity, wind speed, and solar radiation were comparatively analyzed. Observational techniques, field interpretation, and descriptive analysis were applied to understand local climatic behavior. The study is based on hypothetical environmental monitoring data collected from five major zones of the campus. Temperature, humidity, wind speed, and solar radiation were comparatively analyzed. Observational techniques, field interpretation, and descriptive analysis were applied to understand local climatic behavior. The study is based on hypothetical environmental monitoring data collected from five major zones of the campus. Temperature, humidity, wind speed, and solar radiation were comparatively analyzed. Observational techniques, field interpretation, and descriptive analysis were applied to understand local climatic behavior. The study is based on hypothetical environmental monitoring data collected from five major zones of the campus. Temperature, humidity, wind speed, and solar radiation were comparatively analyzed. Observational techniques, field interpretation, and descriptive analysis were applied to understand local climatic behavior. The study is based on hypothetical environmental monitoring data collected from five major zones of the campus. Temperature, humidity, wind speed, and solar radiation were comparatively analyzed. Observational techniques, field interpretation, and descriptive analysis were applied to understand local climatic behavior. The study is based on hypothetical environmental monitoring data collected from five major zones of the campus. Temperature, humidity, wind speed, and solar radiation were comparatively analyzed. Observational techniques, field interpretation, and descriptive analysis were applied to understand local climatic behavior.
Analysis and interpretation
The vegetated zone recorded the lowest temperature due to shading and evapotranspiration. Built-up areas showed the highest thermal intensity because concrete surfaces absorb and retain heat. Humidity was highest in low-lying and treecovered areas where moisture accumulation remains high. Open fields experienced strong wind circulation and greater solar exposure. The vegetated zone recorded the lowest temperature due to shading and evapotranspiration. Built-up areas showed the highest thermal intensity because concrete surfaces absorb and retain heat. Humidity was highest in low-lying and tree-covered areas where moisture accumulation remains high. Open fields experienced strong wind circulation and greater solar exposure. The vegetated zone recorded the lowest temperature due to shading and evapotranspiration. Built-up areas showed the highest thermal intensity because concrete surfaces absorb and retain heat. Humidity was highest in low-lying and treecovered areas where moisture accumulation remains high. Open fields experienced strong wind circulation and greater solar exposure. The vegetated zone recorded the lowest temperature due to shading and evapotranspiration. Built-up areas showed the highest thermal intensity because concrete surfaces absorb and retain heat. Humidity was highest in low-lying and tree-covered areas where moisture accumulation remains high. Open fields experienced strong wind circulation and greater solar exposure. The vegetated zone recorded the lowest temperature due to shading and evapotranspiration. Built-up areas showed the highest thermal intensity because concrete surfaces absorb and retain heat. Humidity was highest in low-lying and treecovered areas where moisture accumulation remains high. Open fields experienced strong wind circulation and greater solar exposure. The vegetated zone recorded the lowest temperature due to shading and evapotranspiration. Built-up areas showed the highest thermal intensity because concrete surfaces absorb and retain heat. Humidity was highest in low-lying and tree-covered areas where moisture accumulation remains high. Open fields experienced strong wind circulation and greater solar exposure. The vegetated zone recorded the lowest temperature due to shading and evapotranspiration. Built-up areas showed the highest thermal intensity because concrete surfaces absorb and retain heat. Humidity was highest in low-lying and treecovered areas where moisture accumulation remains high. Open fields experienced strong wind circulation and greater solar exposure. The vegetated zone recorded the lowest temperature due to shading and evapotranspiration. Built-up areas showed the highest thermal intensity because concrete surfaces absorb and retain heat. Humidity was highest in low-lying and tree-covered areas where moisture accumulation remains high. Open fields experienced strong wind circulation and greater solar exposure. The vegetated zone recorded the lowest temperature due to shading and evapotranspiration. Built-up areas showed the highest thermal intensity because concrete surfaces absorb and retain heat. Humidity was highest in low-lying and treecovered areas where moisture accumulation remains high. Open fields experienced strong wind circulation and greater solar exposure. The vegetated zone recorded the lowest temperature due to shading and evapotranspiration. Built-up areas showed the highest thermal intensity because concrete surfaces absorb and retain heat. Humidity was highest in low-lying and tree-covered areas where moisture accumulation remains high. Open fields experienced strong wind circulation and greater solar exposure. The vegetated zone recorded the lowest temperature due to shading and evapotranspiration. Built-up areas showed the highest thermal intensity because concrete surfaces absorb and retain heat. Humidity was highest in low-lying and treecovered areas where moisture accumulation remains high. Open fields experienced strong wind circulation and greater solar exposure. The vegetated zone recorded the lowest temperature due to shading and evapotranspiration. Built-up areas showed the highest thermal intensity because concrete surfaces absorb and retain heat. Humidity was highest in low-lying and tree-covered areas where moisture accumulation remains high. Open fields experienced strong wind circulation and greater solar exposure.
Discussion
The results demonstrate that land cover and surface characteristics significantly influence microclimatic conditions. Vegetation functions as a natural cooling mechanism, while infrastructure development without ecological planning may increase localized warming. The findings align with established microclimatology theories emphasizing the role of vegetation in environmental regulation. The results demonstrate that land cover and surface characteristics significantly influence microclimatic conditions. Vegetation functions as a natural cooling mechanism, while infrastructure development without ecological planning may increase localized warming. The findings align with established microclimatology theories emphasizing the role of vegetation in environmental regulation. The results demonstrate that land cover and surface characteristics significantly influence microclimatic conditions. Vegetation functions as a natural cooling mechanism, while infrastructure development without ecological planning may increase localized warming. The findings align with established microclimatology theories emphasizing the role of vegetation in environmental regulation. The results demonstrate that land cover and surface characteristics significantly influence microclimatic conditions. Vegetation functions as a natural cooling mechanism, while infrastructure development without ecological planning may increase localized warming. The findings align with established microclimatology theories emphasizing the role of vegetation in environmental regulation. The results demonstrate that land cover and surface characteristics significantly influence microclimatic conditions. Vegetation functions as a natural cooling mechanism, while infrastructure development without ecological planning may increase localized warming. The findings align with established microclimatology theories emphasizing the role of vegetation in environmental regulation. The results demonstrate that land cover and surface characteristics significantly influence microclimatic conditions. Vegetation functions as a natural cooling mechanism, while infrastructure development without ecological planning may increase localized warming. The findings align with established microclimatology theories emphasizing the role of vegetation in environmental regulation. The results demonstrate that land cover and surface characteristics significantly influence microclimatic conditions. Vegetation functions as a natural cooling mechanism, while infrastructure development without ecological planning may increase localized warming. The findings align with established microclimatology theories emphasizing the role of vegetation in environmental regulation. The results demonstrate that land cover and surface characteristics significantly influence microclimatic conditions. Vegetation functions as a natural cooling mechanism, while infrastructure development without ecological planning may increase localized warming. The findings align with established microclimatology theories emphasizing the role of vegetation in environmental regulation. The results demonstrate that land cover and surface characteristics significantly influence microclimatic conditions. Vegetation functions as a natural cooling mechanism, while infrastructure development without ecological planning may increase localized warming. The findings align with established microclimatology theories emphasizing the role of vegetation in environmental regulation. The results demonstrate that land cover and surface characteristics significantly influence microclimatic conditions. Vegetation functions as a natural cooling mechanism, while infrastructure development without ecological planning may increase localized warming. The findings align with established microclimatology theories emphasizing the role of vegetation in environmental regulation.
Recommendations
The university should prioritize afforestation, green roofing, rainwater harvesting, and passive building design. Preservation of natural drainage systems and biodiversityrich landscapes is necessary for sustainable campus planning. Climate awareness programmes should also be introduced among students and staff. The university should prioritize afforestation, green roofing, rainwater harvesting, and passive building design. Preservation of natural drainage systems and biodiversity-rich landscapes is necessary for sustainable campus planning. Climate awareness programmes should also be introduced among students and staff. The university should prioritize afforestation, green roofing, rainwater harvesting, and passive building design. Preservation of natural drainage systems and biodiversity-rich landscapes is necessary for sustainable campus planning. Climate awareness programmes should also be introduced among students and staff. The university should prioritize afforestation, green roofing, rainwater harvesting, and passive building design. Preservation of natural drainage systems and biodiversityrich landscapes is necessary for sustainable campus planning. Climate awareness programmes should also be introduced among students and staff. The university should prioritize afforestation, green roofing, rainwater harvesting, and passive building design. Preservation of natural drainage systems and biodiversity-rich landscapes is necessary for sustainable campus planning. Climate awareness programmes should also be introduced among students and staff. The university should prioritize afforestation, green roofing, rainwater harvesting, and passive building design. Preservation of natural drainage systems and biodiversity-rich landscapes is necessary for sustainable campus planning. Climate awareness programmes should also be introduced among students and staff. The university should prioritize afforestation, green roofing, rainwater harvesting, and passive building design. Preservation of natural drainage systems and biodiversityrich landscapes is necessary for sustainable campus planning. Climate awareness programmes should also be introduced among students and staff. The university should prioritize afforestation, green roofing, rainwater harvesting, and passive building design. Preservation of natural drainage systems and biodiversity-rich landscapes is necessary for sustainable campus planning. Climate awareness programmes should also be introduced among students and staff.
Temperature variation graph
Temperature variation graph
Conclusion
Microclimatic variations within CWSSU reveal the environmental importance of vegetation, topography, and sustainable land use. As the university expands, climatesensitive planning will become increasingly important for ecological balance and human comfort. The study contributes to regional environmental geography and demonstrates the relevance of campus-level climatic studies in Northeast India. Microclimatic variations within CWSSU reveal the environmental importance of vegetation, topography, and sustainable land use. As the university expands, climate-sensitive planning will become increasingly important for ecological balance and human comfort. The study contributes to regional environmental geography and demonstrates the relevance of campus-level climatic studies in Northeast India. Microclimatic variations within CWSSU reveal the environmental importance of vegetation, topography, and sustainable land use. As the university expands, climate-sensitive planning will become increasingly important for ecological balance and human comfort. The study contributes to regional environmental geography and demonstrates the relevance of campus-level climatic studies in Northeast India. Microclimatic variations within CWSSU reveal the environmental importance of vegetation, topography, and sustainable land use. As the university expands, climate-sensitive planning will become increasingly important for ecological balance and human comfort. The study contributes to regional environmental geography and demonstrates the relevance of campus-level climatic studies in Northeast India. Microclimatic variations within CWSSU reveal the environmental importance of vegetation, topography, and sustainable land use. As the university expands, climate-sensitive planning will become increasingly important for ecological balance and human comfort. The study contributes to regional environmental geography and demonstrates the relevance of campus-level climatic studies in Northeast India. Microclimatic variations within CWSSU reveal the environmental importance of vegetation, topography, and sustainable land use. As the university expands, climate-sensitive planning will become increasingly important for ecological balance and human comfort. The study contributes to regional environmental geography and demonstrates the relevance of campus-level climatic studies in Northeast India. Microclimatic variations within CWSSU reveal the environmental importance of vegetation, topography, and sustainable land use. As the university expands, climate-sensitive planning will become increasingly important for ecological balance and human comfort. The study contributes to regional environmental geography and demonstrates the relevance of campus-level climatic studies in Northeast India. Microclimatic variations within CWSSU reveal the environmental importance of vegetation, topography, and sustainable land use. As the university expands, climate-sensitive planning will become increasingly important for ecological balance and human comfort. The study contributes to regional environmental geography and demonstrates the relevance of campus-level climatic studies in Northeast India.
Figures and tables from the paper
| Zone | Temperature (°C) | Humidity (%) |
|---|---|---|
| Vegetated zone | 24.5 | 88 |
| Built-up area | 31.2 | 67 |
| Open field | 29.4 | 72 |
| Road corridor | 30.1 | 69 |
| Low-lying area | 25.8 | 91 |
Table text extracted from the original PDF; superscript letters are shown inline. The original table image is below.