
Research article · 2026 · Full text
International Journal of Geography Geology and EnvironmentSpatio-temporal assessment of land use and land cover change using remote sensing and GIS techniques
Volume 8(2) · Pages 156–160 · DOI: 10.22271/27067483.2026.v8.i2a.805 ↗
Research areasLand Use and Ecosystem ServicesRemote Sensing and Land UseRemote Sensing in Agriculture
Abstract
Author-writtenIn contrast to natural ecosystems that evolve over geological timescales, Land Use and Land Cover (LULC) in sub-Saharan Africa has changed profoundly within a single human generation, driven by population growth, agricultural expansion, and weak land tenure governance. The Awash Basin in Ethiopia, spanning 110,000 km² across highland, escarpment, and lowland zones, exemplifies this rapid transition and has experienced among the highest rates of deforestation and agricultural extensification in the East African region. This research performed a spatio-temporal assessment of LULC change in the Awash Basin over a 22-year period (2000-2022) using multi-temporal Landsat 7 ETM+ and Landsat 8 OLI imagery analysed in Google Earth Engine (GEE) with a Random Forest supervised classification algorithm. Classification accuracy was assessed against 350 ground-truth points per epoch. Five LULC classes were distinguished: dense forest, agricultural land, grassland/shrubland, urban settlements, and waterbodies/bare land. Results showed that dense forest cover declined from 38.4% to 18.6% (loss of 19.8 percentage points) between 2000 and 2022, while agricultural land expanded from 28.7% to 44.3% (+15.6 percentage points) and urban settlements tripled from 4.2% to 11.7%. Overall classification accuracy ranged from 86.3% (2000 epoch) to 91.7% (2022 epoch) with kappa coefficients of 0.81 and 0.88 respectively. A strong negative correlation was observed between mean NDVI change and annual deforestation rate across 22 districts (Pearson r = -0.86; p<0.001). These findings provide quantitative evidence for accelerated land degradation in the Awash Basin and identify the highland-escarpment transition zone as the spatial priority for conservation intervention.
Summary
Source-checkedPlain-language reading of the full paper, prepared with AI and checked against the text. Each point links to the authors' own words.
Why it matters
- Land use and land cover (LULC) changes are significant human modifications to ecosystems that impact biodiversity, carbon storage, and local climate. View evidence ↗
- The Awash Basin in Ethiopia is a critical area for study because it has seen some of the highest rates of agricultural expansion and deforestation in East Africa. View evidence ↗
- Rapid population growth in Ethiopia, from 50 million in 1990 to over 120 million by 2022, has driven deforestation to meet the demand for more agricultural land. View evidence ↗
What they did
- The researchers used Landsat 7 ETM+ imagery for the 2000 and 2005 epochs and Landsat 8 OLI imagery for 2010, 2015, and 2022. View evidence ↗
- A Random Forest classifier was trained using 875 training polygons per epoch, based on Google Earth imagery, topographic maps, and field GPS data. View evidence ↗
- The study categorized land into five classes: dense forest, agricultural land, grassland/shrubland, urban settlements, and waterbodies/bare land. View evidence ↗
- To ensure accuracy, the classifications were validated using 350 ground-truth points for each time period. View evidence ↗
What they found
- Dense forest cover decreased from 38.4% in 2000 to 18.6% in 2022, representing a 51.6% decline at a mean annual rate of -1.75%. View evidence ↗
- Agricultural land expanded from 28.7% to 44.3% of the basin area, with a total increase of 17,160 km². View evidence ↗
- Urban settlements grew rapidly, tripling from 4.2% to 11.7% of the basin area, a 178% increase. View evidence ↗
- The classification accuracy was high, ranging from 86.3% in 2000 to 91.7% in 2022, with kappa coefficients between 0.81 and 0.88. View evidence ↗
- There was a strong negative correlation (r = -0.86) between the change in NDVI and the annual rate of deforestation across 22 districts. View evidence ↗
- The highland-escarpment transition zone, located between 600 and 1,800 meters in elevation, was identified as the primary area of active deforestation. View evidence ↗
What it means
- The authors recommend that policymakers prioritize watershed management investments in the highland-escarpment transition zone where deforestation is most concentrated. View evidence ↗
Visual summary
2 visualsIllustrations explain the paper; charts are replotted from the paper's own table values.
LULC Shift Overview
AI-generated conceptual illustration (a mixed landscape of tropical forest, agricultural cropland, and urban settlements). It explains the idea and does not show study data.
View source evidence ↗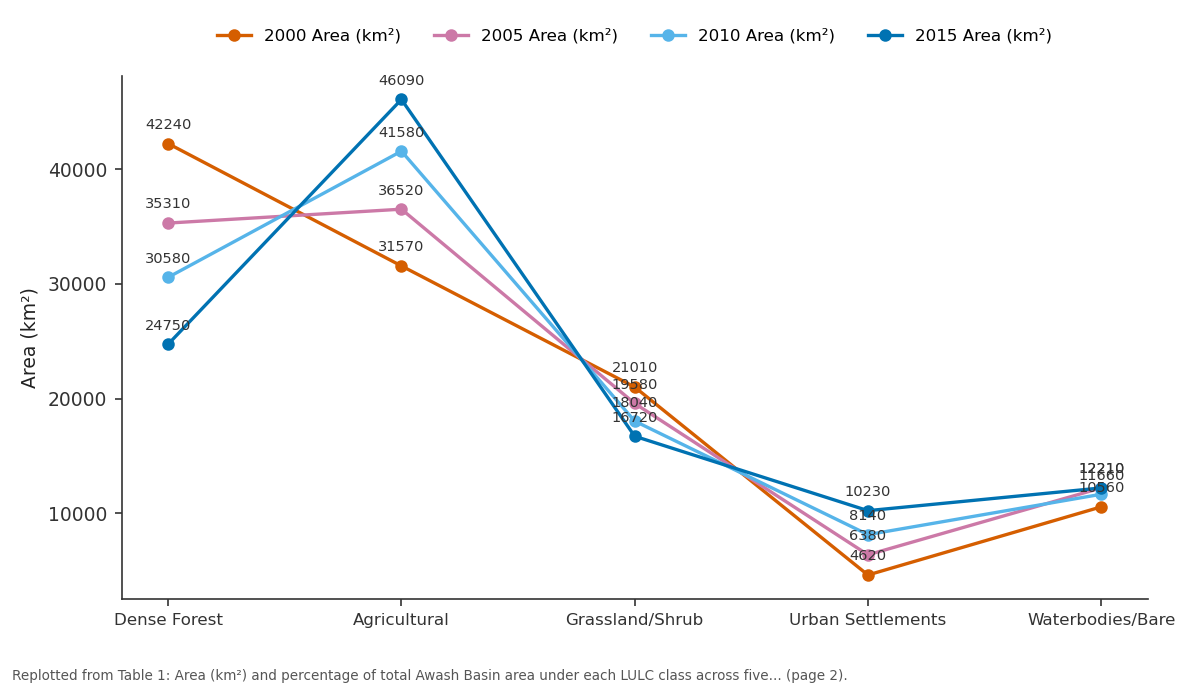
2000 Area (km²) and 2005 Area (km²) and more: Dense Forest vs Agricultural vs Grassland/Shrub vs Urban Settlements vs Waterbodies/Bare
Replotted from Table 1 (page 2) of the original paper. Every bar is the paper's own table value.
View source evidence ↗Figures & tables
From the original paper Table 1
 Table 2
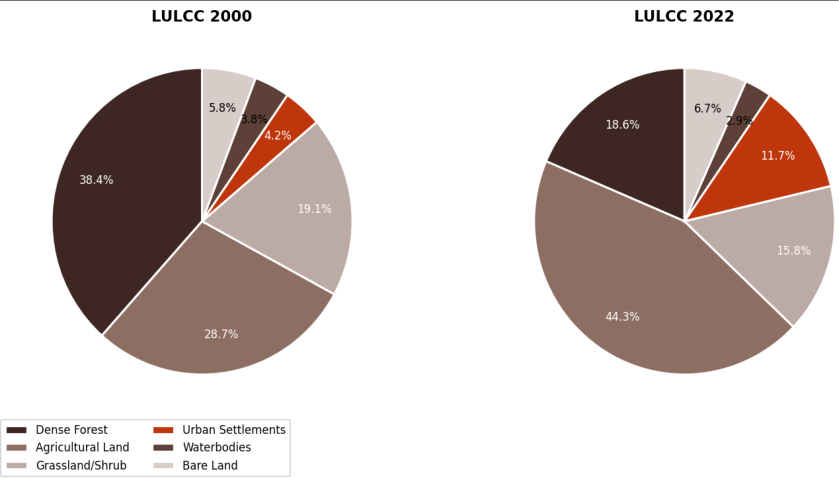 Figure 1
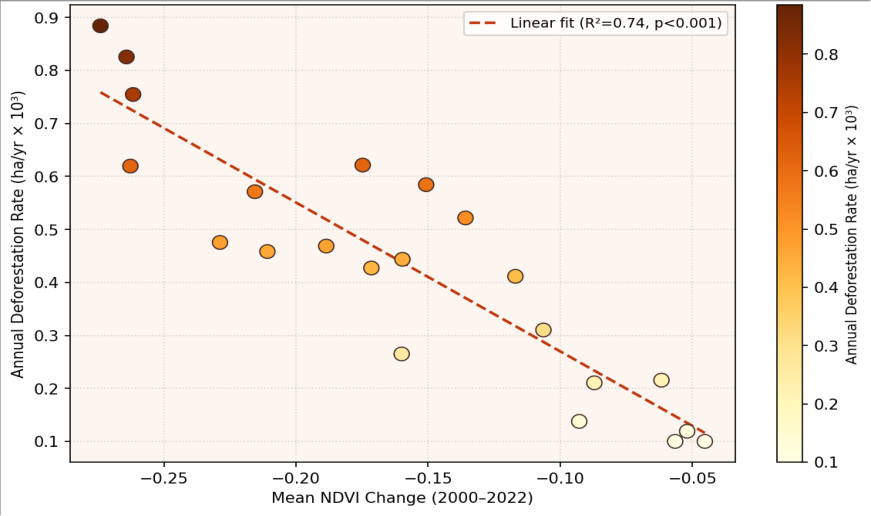 Figure 2
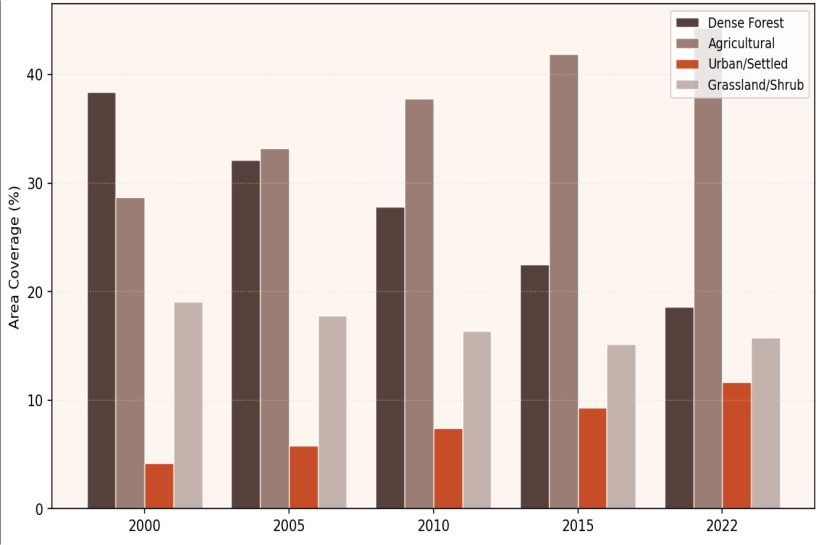 Figure 3
Introduction
Land use and land cover change represents one of the most direct human modifications of terrestrial ecosystems and exerts cascading effects on carbon storage, biodiversity, hydrological regulation, soil fertility, and local climate [1] . While global deforestation and agricultural expansion have been well documented over the past three decades through satellite remote sensing programmes, the spatial pattern and rate of LULC change is highly heterogeneous across regions, with East Africa consistently emerging as a zone of particular concern because of the simultaneous pressure of high population growth rates, subsistence agriculture expansion, and inadequate land governance [2,3] . Ethiopia presents a particularly striking case of LULC transformation. The country's population grew from approximately 50 million in 1990 to over 120 million by 2022, driving a continuous demand for agricultural land that has been met primarily through deforestation rather than yield intensification. The Awash Basin, which encompasses some of Ethiopia's most productive highland agricultural land as well as the ecologically sensitive escarpment and rift valley zones, has experienced this transformation intensely [4] . Forest cover in the Ethiopian highlands, estimated at 30-40% in the early 20th century, has declined to below 5% of total land area nationally, with the conversion to smallholder cultivation representing the dominant driver [5] . Remote sensing using multi-temporal satellite imagery, combined with Geographic Information System (GIS)-based change detection, provides the only practical method for Monitoring LULC change at basin scale with spatial detail Sufficient to identify priority intervention zones. The advent of cloud computing platforms such as Google Earth Engine (GEE) has dramatically reduced the computational barrier to processing large, multi-epoch Landsat archives, enabling the full 50-year Landsat record to be accessed and analysed at continental scale by individual research teams [6] . Machine learning classification algorithms -particularly Random Forest (RF), which performs well on spectrally complex landscapes -have progressively replaced maximum likelihood classifiers for large-area LULC mapping and are now widely considered best practice for land cover classification accuracy [7] .
Discussion
The most significant finding -a 51.6% decline in dense forest cover over 22 years (from 38.4% to 18.6%) at a mean annual rate of -1.75% -places the Awash Basin among the most rapidly deforesting river basins in East Africa during this period. Comparative data from Zeleke and Hurni [8] for other Ethiopian highland catchments, and from Wondrade et al. [9] for the Abijata-Shalla basin in the Central Rift Valley, show similar or modestly lower rates of 1.2-1.8% annual forest loss, confirming the Awash Basin result as severe but not anomalous within the national and regional context. The strong correlation between NDVI decline and deforestation rate across 22 districts (r = -0.86, p<0.001) validates NDVI time-series analysis as a cost-effective remote monitoring tool for tracking forest degradation at sub-basin scale, complementing the epoch-based pixel classification approach. This finding aligns with Teferi et al. [10] , who demonstrated in the Blue Nile headwaters that NDVI trends from MODIS 500 m imagery could predict deforestation hotspots with 82% accuracy relative to Landsat ground-truth. For operational monitoring purposes, MODIS-based NDVI anomaly detection could be deployed as a near-real-time early warning system for new deforestation fronts in the Awash Basin before the next Landsat classification epoch. The identification of the highland-escarpment transition zone (600-1,800 m elevation band) as the principal spatial focus of active deforestation -based on the per-district change data not shown in full here -is consistent with the well-documented dynamic in Ethiopian highlands where smallholder farmers progressively clear forest on steeper slopes as lower-elevation land becomes fully occupied [11,12] . The doubling of agricultural land in the lower and middle basin between 2000 and 2022 (+17,160 km²) represents a net soil degradation and erosion risk that has not yet been quantified for the Awash Basin and that constitutes a critical knowledge gap for hydrological modelling and reservoir sedimentation prediction.
A key limitation of this research is that the LULC classification does not distinguish between forest quality classes -primary forest, secondary regrowth, and degraded woodland are collapsed into the "dense forest" category above the threshold NDVI value applied. Future research should apply a three-tier forest quality classification using forest canopy height estimates from GEDI (Global Ecosystem Dynamics Investigation) LiDAR data, which became available for Ethiopia from 2019, to disentangle primary forest loss from secondary forest dynamics. Additionally, socioeconomic drivers of LULC changepopulation growth trajectories by woreda, land tenure policy changes under the FDRE land proclamations, and agricultural input subsidy programmes -should be incorporated into a regression-based explanatory model of deforestation to improve the policy relevance of the spatial analysis outputs [13,14] .
Conclusion
This research makes a substantive methodological and empirical contribution to LULC change monitoring in the Awash Basin by delivering, for the first time, a five-epoch 22-year time series of validated Random Forest LULC classifications with accuracy exceeding 86% for all epochs. The main scientific contribution is a rigorously quantified account of land cover transformation showing that the basin lost 21,780 km² of dense forest (51.6% of 2000 extent) while gaining 17,160 km² of agricultural land and 8,250 km² of urban settlement between 2000 and 2022. Supporting evidence from the NDVI-deforestation correlation (r = -0.86) and from the accuracy assessment statistics (kappa 0.81-0.88 across epochs) establishes both the physical reality of the observed changes and the reliability of the mapping approach. The field significance of these findings is substantial: the Awash Basin is one of Ethiopia's most economically important river systems for irrigation and hydropower, and the demonstrated loss of forest cover in the upper basin has direct implications for runoff flashiness, sediment load, reservoir sedimentation rates, and ultimately for the economic viability of downstream water infrastructure.
The key open question is the causal attribution of observed changes between climate variability and direct land management -addressed partially here by the CHIRPS rainfall contextualisation but requiring more rigorous statistical attribution analysis, ideally using synthetic control methods or panel regression across comparable basins with different governance trajectories [15,16] . Policymakers in the Ethiopian Ministry of Agriculture and the Awash Basin Authority should use the spatial targeting outputs of this research -specifically the district-level deforestation rate maps -to prioritise integrated watershed management investments in the highland-escarpment transition zone where active deforestation is most concentrated [17, .
Acknowledgement
Acknowledgements
Figures and tables from the paper
References
19 in the original paper- Turner BL, Skole DL, Sanderson S, et al. Land-use and land-cover change: science/research plan. IGBP Rep No. 35, HDP Rep No. 7. Stockholm and Geneva; 1995.
- Lambin EF, Turner BL, Geist HJ, et al. The causes of land-use and land-cover change: moving beyond the myths. Glob Environ Change. 2001;11(4):261-269.
- Belay EA. Growing urban centers in Ethiopia. In: Proceedings of the International Conference on African Development Issues. Ogun: Covenant University; 2015.
- Abebe T, Woldemariam T, Demissie Y. Land-use and land-cover change in the Dendi Highlands watershed, Blue Nile, Ethiopia. Environ Syst Res. 2014;3(1):21.
- Gorelick N, Hancher M, Dixon M, et al. Google Earth Engine: planetary-scale geospatial analysis for everyone. Remote Sens Environ. 2017;202:18-27.
- Breiman L. Random forests. Mach Learn. 2001;45(1):5-32.
- Zeleke G, Hurni H. Implications of land use and land cover dynamics for mountain resource degradation in the northwestern Ethiopian Highlands. Mt Res Dev. 2001;21(2):184-191.
- Wondrade N, Dick ÖB, Tveite H. Mapping land cover and monitoring changes in the Abijata-Shalla Lakes National Park, Central Rift Valley, Ethiopia. Appl Geogr. 2014;46:36-44.
- Teferi E, Bewket W, Uhlenbrook S, Wenninger J. Understanding recent land use and land cover dynamics in the source region of the Upper Blue Nile, Ethiopia. Agric Ecosyst Environ. 2013;165:98-108.
- Tekle K, Hedlund L. Land cover changes between 1958 and 1986 in Kalu District, southern Wello, Ethiopia. Hum Ecol. 1999;27(2):333-349.
- Mather AS. Global Forest Resources. London: Belhaven Press; 1990.
- Foley JA, DeFries R, Asner GP, et al. Global consequences of land use. Science. 2005;309(5734):570-574.
- Meyer WB, Turner BL, editors. Changes in Land Use and Land Cover: A Global Perspective. Cambridge: Cambridge University Press; 1994.
- Petit CC, Lambin EF. Integration of multi-source remote sensing data for land cover change detection. Int J Geogr Inf Sci. 2001;15(8):785-803.
- Verburg PH, van de Steeg J, Veldkamp A, Willemen L. From land cover change to land function dynamics: a major challenge to improve land characterization. J Environ Manag. 2009;90(3):1327-1335.
- Amare D, Wubie M, Mekuriaw A. Land use change and its impact on landscape diversity in Mecha Watershed, Upper Blue Nile Basin, northwestern Ethiopia. Geocarto Int. 2021;36(1):12-28.
- Intergovernmental Panel on Climate Change. Climate Change and Land: An IPCC Special Report on Climate Change, Desertification, Land Degradation, Sustainable Land Management, Food Security, and Greenhouse Gas Fluxes in Terrestrial Ecosystems. Geneva: IPCC; 2019.
- Anderson JR, Hardy EE, Roach JT, Witmer RE. A Land Use and Land Cover Classification System for Use with Remote Sensor Data. US Geological Survey Professional Paper 964. Washington (DC): US Geological Survey; 1976.
- Abenayake CC, Jayasinghe A, Mikami Y, Matsuda Y. Population vulnerability assessment with a GIS approach: a case study. Int J Disaster Risk Reduct. 2018; 27:602-613.