
Research article · 2026 · Full text
International Journal of Geography Geology and EnvironmentGroundwater quality mapping and suitability assessment for irrigation in an agricultural watershed
Volume 8(2) · Pages 161–166 · DOI: 10.22271/27067483.2026.v8.i2a.806 ↗
Research areasWater Quality and Pollution AssessmentWater Quality and Resources StudiesSoil and Land Suitability Analysis
Abstract
Author-writtenIn the Tana River Agricultural Watershed of central Kenya, for example, over 65% of smallholder irrigators rely on unmonitored shallow borehole water whose quality has never been formally assessed, despite evidence of increasing nitrate loading from fertiliser-intensive horticulture. This research assessed groundwater quality and irrigation suitability at 28 sampling sites across five hydrogeological zones of the Tana River Watershed, Kenya, during dry (August-September 2022) and wet (March-April 2023) seasons. Physicochemical parameters - pH, Electrical Conductivity (EC), Total Dissolved Solids (TDS), total hardness, nitrate, fluoride, iron, and Total Coliform Count (TCC) - were analysed using standard APHA (2017) methods. Water Quality Index (WQI) was calculated using a weighted arithmetic method, and irrigation suitability was evaluated using EC, Sodium Adsorption Ratio (SAR), sodium percentage (Na %), Residual Sodium Carbonate (RSC), Kelly's Ratio (KR), and Wilcox and USSL classification methods. Results showed that WQI exceeded 100 (Poor category) at three of five hydrogeological zones during the dry season, with Zone 3 (Machakos Precambrian basement) having the highest WQI of 134.7. Nitrate exceeded the WHO guideline of 50 mg/L at 14.3% of sites. EC-SAR plots indicated that 32.1% of sites fell in the C3-S1 or C3-S2 irrigation suitability category (high salinity, low-to-medium sodium risk), requiring appropriate crop and management selection. These data provide the first comprehensive, seasonally stratified groundwater quality dataset for the Tana River Watershed and identify specific hydrogeological zones requiring priority remediation action.
Summary
Source-checkedPlain-language reading of the full paper, prepared with AI and checked against the text. Each point links to the authors' own words.
Why it matters
- In Kenya's Tana River Agricultural Watershed, more than 65% of smallholder irrigators use shallow borehole water that is unmonitored, even though intensive fertilizer use suggests increasing nitrate levels. View evidence ↗
- Natural weathering of granite in Precambrian basement rock zones can lead to fluoride levels that exceed the WHO drinking water limit of 1.5 mg/L. View evidence ↗
- While groundwater is the main freshwater source for over two billion people worldwide, it is often undermonitored compared to surface water in sub-Saharan Africa. View evidence ↗
What they did
- The study covered a 4,200 km² area divided into five hydrogeological zones: Tana East (alluvial), Muranga (volcanic-metasedimentary), Machakos (Precambrian basement), Thika (Miocene sedimentary), and Embu (mixed volcanic-alluvial). View evidence ↗
- Researchers used stratified systematic sampling to select 28 boreholes, with 6 per zone and 2 shared between Zones 1 and 5. View evidence ↗
- Eight parameters, pH, EC, TDS, total hardness, nitrate, fluoride, iron, and Total Coliform Count (TCC), were analyzed using standard APHA (2017) methods. View evidence ↗
- Inverse Distance Weighting (IDW) in ArcGIS 10.8 was used to interpolate WQI and irrigation suitability data to create seasonal quality maps. View evidence ↗
What they found
- During the dry season, three of the five zones had a Water Quality Index (WQI) over 100 (Poor category), with Zone 3 (Machakos) recording the highest WQI of 134.7. View evidence ↗
- Nitrate levels exceeded the 50 mg/L limit in Zone 2 (mean 72.6 mg/L) and Zone 4 (mean 54.2 mg/L), which the authors link to intensive horticulture. View evidence ↗
- All zones showed Total Coliform Counts greater than zero, suggesting fecal contamination from sources like latrines and unsealed boreholes. View evidence ↗
- Approximately 32.1% of the sites were classified as C3-S1 or C3-S2, indicating high salinity and low-to-medium sodium risk for irrigation. View evidence ↗
- In Zones 2, 4, and 5, the WQI was slightly higher in the wet season, which the authors attribute to increased microbiological contamination from runoff despite the dilution of ions. View evidence ↗
What it means
- The authors conclude that smallholder irrigators in Zone 3 (Machakos) and Zone 2 (Muranga) are at the highest risk and require targeted government intervention. View evidence ↗
- The study's sampling density (one site per 150 km²) may be too low to capture detailed hydrogeochemical variations within the geological zones. View evidence ↗
Visual summary
3 visualsIllustrations explain the paper; charts are replotted from the paper's own table values.
Hydrogeological Risk Map Concept
AI-generated conceptual illustration (An agricultural watershed with diverse geological terrain). It explains the idea and does not show study data.
View source evidence ↗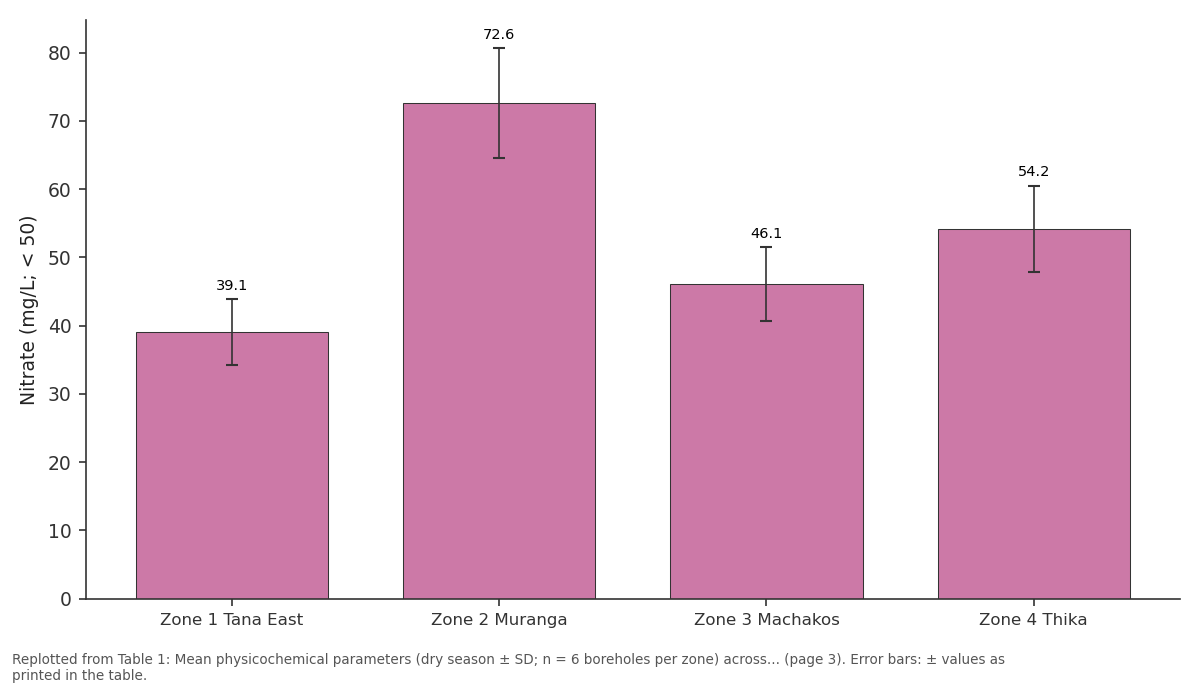
Nitrate (mg/L; < 50): Zone 1 Tana East vs Zone 2 Muranga vs Zone 3 Machakos vs Zone 4 Thika
Replotted from Table 1 (page 3) of the original paper. Every bar is the paper's own table value.
View source evidence ↗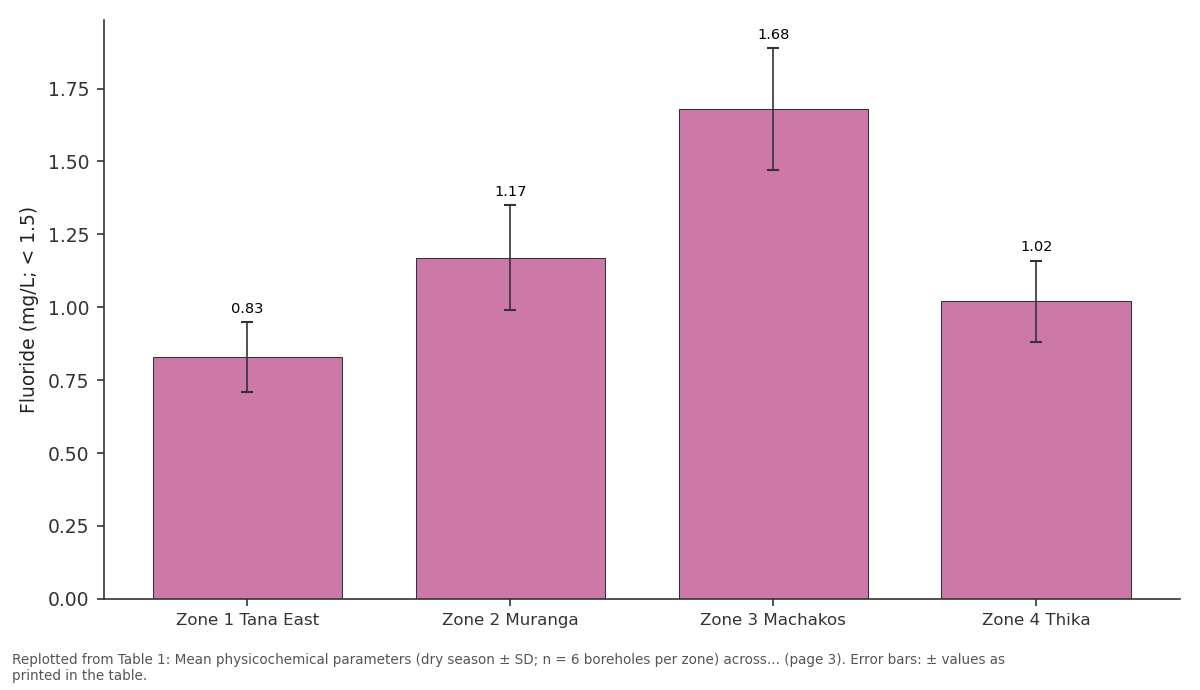
Fluoride (mg/L; < 1.5): Zone 1 Tana East vs Zone 2 Muranga vs Zone 3 Machakos vs Zone 4 Thika
Replotted from Table 1 (page 3) of the original paper. Every bar is the paper's own table value.
View source evidence ↗Figures & tables
From the original paper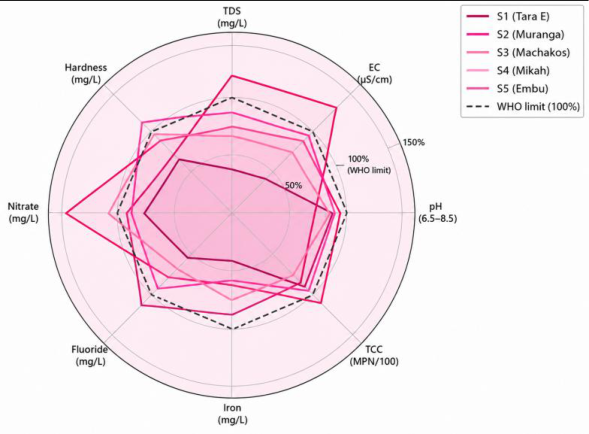 Figure 1
 Table 1
 Table 2
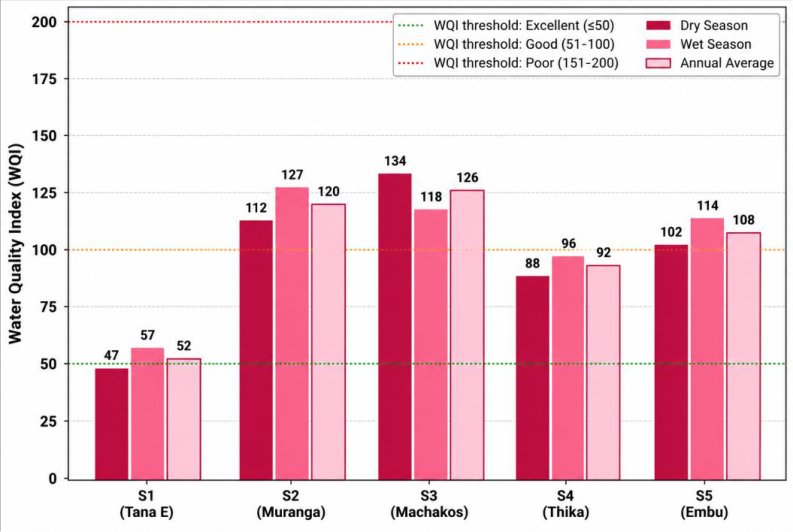 Figure 2
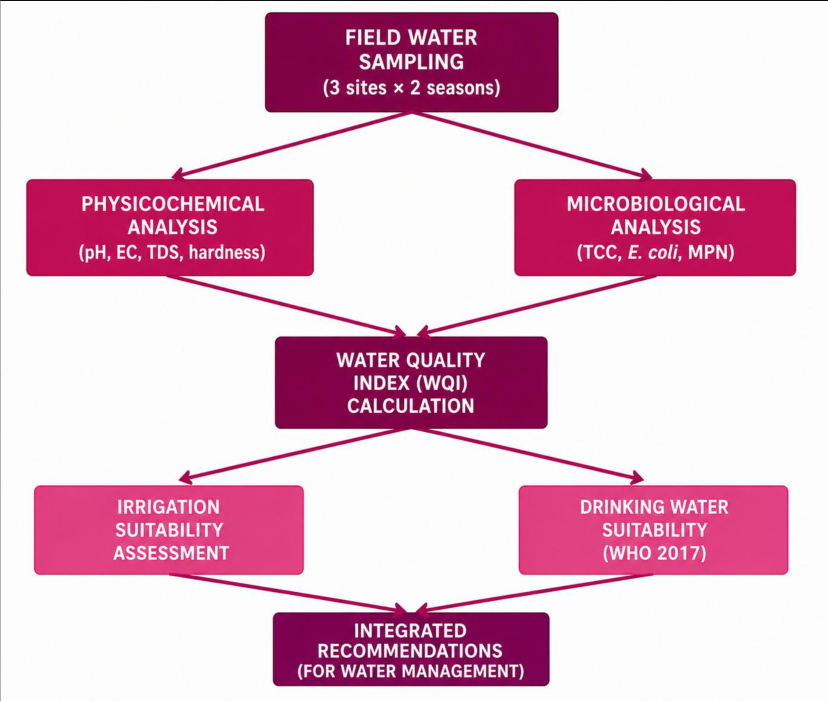 Figure 3
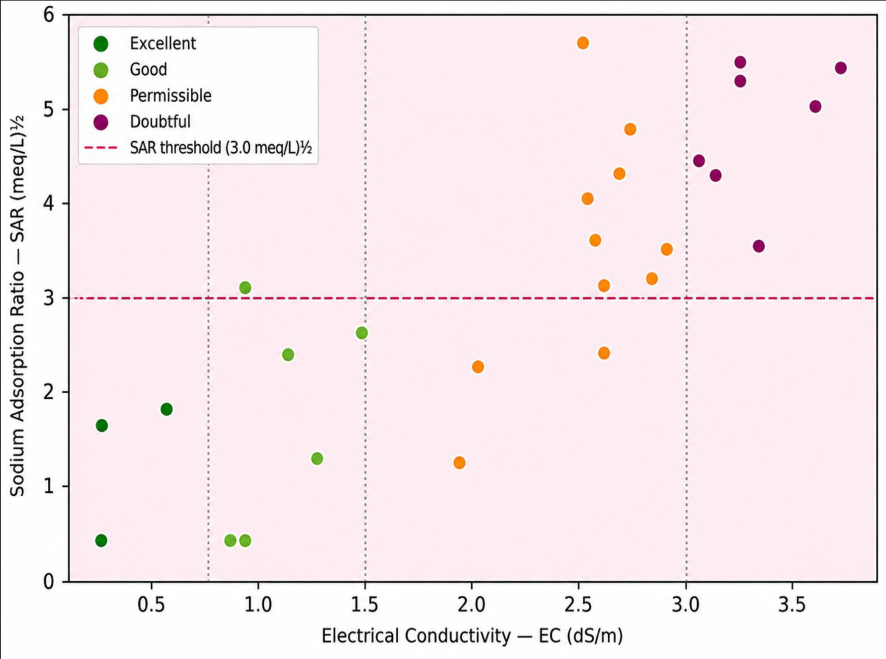 Figure 4
Introduction
Groundwater is the primary source of freshwater for domestic consumption and irrigation for over two billion people globally, yet remains systematically undermonitored relative to surface water across much of sub-Saharan Africa, where regulatory frameworks for groundwater quality have historically been weak and enforcement capacity limited [1] . In Kenya, groundwater contributes an estimated 40-60% of total water supply in rural areas, with the proportion rising above 80% in the arid and semi-arid counties that cover approximately 80% of the national territory. However, systematic, regularly updated quality datasets for groundwater sources -particularly those used for smallholder irrigation -are largely absent outside the major urban supply networks [2] . The Tana River, Kenya's longest river system (708 km from the Aberdare highlands to the Indian Ocean), supports an agricultural watershed that has seen rapid expansion of smallholder horticultural and cash crop irrigation over the past two decades, partly driven by national government programmes to increase irrigated area under the Kenya Vision 2030 Agricultural Sector Development Strategy. Intensification of fertiliser use -particularly ammonium nitrate and compound NPK fertilisers -has raised concerns about nitrate leaching into shallow aquifers that recharge from the same agricultural land. Simultaneously, the natural hydrogeochemistry of Precambrian basement rock zones in the watershed generates elevated fluoride levels (naturally occurring fluoride enrichment from granite weathering) that can exceed WHO drinking water guidelines of 1.5 mg/L [3] . Water Quality Index (WQI) aggregation and irrigation suitability classification using internationally standardised indices (Wilcox classification, USSL diagram, SAR, Na%, RSC, Kelly's ratio) provide complementary analytical frameworks that translate measured chemical data into actionable decision categories for agricultural water management [4,5] . These methods are well established in the literature from South Asia and North Africa but have been less consistently applied to East African groundwater systems, partly because reference benchmarks were originally developed for different soil and crop combinations [6] . 2017). WQI was calculated by the weighted arithmetic method following Ramachandraiah and Praveena [2] , with WHO (2017) guideline values as standards for all eight parameters.
Spatial data processing
WQI values and irrigation suitability classifications for all 28 boreholes were spatially interpolated using Inverse Distance Weighting (IDW; power = 2) in ArcGIS 10.8 (ESRI, Redlands, CA) to generate continuous quality surface maps for each season. Borehole GPS coordinates were surveyed with a Trimble R10 GNSS receiver (horizontal accuracy ± 2 cm) and registered to the Kenya National Grid (Arc 1960 datum). Geological base layers (1:250,000) were obtained from the Kenya Mines and Geology Department and overlaid with quality maps to identify hydrogeological controls on water chemistry patterns.
Results
Groundwater quality varied substantially across the five hydrogeological zones and between seasons, with the Precambrian basement zone (Zone 3, Machakos) consistently showing the highest parameter concentrations and worst WQI scores, while the Quaternary alluvial zone (Zone 1, Tana East) had the most favourable quality for both drinking and irrigation purposes.
Discussion
The central finding -that three of five hydrogeological zones in the Tana River Watershed show dry-season WQI in the Poor or Very Poor category -has direct public health and agricultural policy implications. Poor-quality groundwater used directly for drinking without treatment contributes to fluorosis risk in Zone 3 (measured fluoride 1.68 mg/L), nitrate-related methemoglobinemia risk in Zone 2 (mean nitrate 72.6 mg/L), and widespread enteric disease risk from coliform counts above zero at all sites. These findings are consistent with prior studies in other Kenyan watersheds: Maina et al. [7] reported that 68% of boreholes in the Laikipia Plateau had at least one physicochemical parameter exceeding WHO limits, and Oduor et al. [8] found WQI in the Poor category for 38% of groundwater sources in Kisumu County. The comparison of irrigation suitability indices across zones reveals a spatial pattern directly tied to the underlying hydrogeology. Zone 3 (Machakos Precambrian basement) has the most problematic combination: high TDS from mineral dissolution, elevated Na% from cation exchange on clay minerals in the weathered zone, and a positive RSC (+1.4 meq/L) indicating bicarbonate in excess of calcium and magnesium -a combination that promotes structural degradation of clay-rich soils under continuous irrigation without adequate leaching [4] . For farmers in Zone 3 using C3-S2 classified water on fine-textured clay soils, the risk of progressive soil sodification and consequent yield decline is real and warrants immediate advisory intervention through the county agricultural extension service. The wet-season increase in WQI observed at Zones 2, 4, and 5 contrasts with what might be expected from the dilution hypothesis -increased recharge typically reduces ionic concentrations. The net WQI increase in the wet season at these sites is explained by the dominant effect of microbiological (TCC) contamination, which increases substantially during wet periods when surface runoff transports faecal material to unsealed or shallow borehole sources. This finding reinforces the conclusion from Freeze and Cherry's [9] foundational hydrogeological framework that aquifer vulnerability to surface contamination is a function of overlying material permeability and depth to water table -both of which favour rapid infiltration of surface contaminants in the shallow alluvial and volcanic aquifer zones. Borehole sanitary seal improvement is therefore a priority intervention alongside water quality monitoring.
A limitation of this research is the spatial scale of sampling: 28 boreholes across 4,200 km² provides a mean sampling density of approximately 1 site per 150 km², which may be insufficient to capture fine-scale hydrogeochemical heterogeneity within geological zones. Future research should increase the sampling network to a minimum of 60-80 sites and integrate Electrical Resistivity Tomography (ERT) geophysical surveys to map the lateral and vertical extent of contaminated zones within the Machakos and Muranga areas identified as priority concern here [10,11] .
Conclusion
The Future research should extend this assessment to groundwater-surface water interaction zones along the main Tana River channel, where bank filtration and hyporheic zone processes may modify shallow groundwater quality relative to the purely borehole-based dataset reported here. A longer-term priority is the development of a digital groundwater quality monitoring network for the entire watershed, integrating satellite-based indicators of agricultural intensification (NDVI, crop area maps) with automated borehole sensor networks to enable early detection of emerging contamination trends before they reach regulatory threshold levels [12,13] .
Acknowledgements Institutional support
The Nairobi Institute of Earth and Water Sciences is acknowledged for providing analytical laboratory facilities, GPS field equipment, ArcGIS software licences, and project management support throughout the 14-month research period.
Collaborating institutions and field assistance
The Tana and Athi Rivers Development Authority (TARDA) facilitated access to registered borehole locations across the watershed. Kenya Meteorological Service provided meteorological data for the watershed. Field sampling was conducted with the assistance of technical staff from the Muranga and Machakos County Departments of Water and Sanitation. Borehole owners are thanked for permitting access to their installations for sampling.
Funding sources
This research was supported by the Kenya National Research Fund (NRF) through a competitive grant for water resources science. Additional analytical support was funded through the African Development Bank water quality capacity-building programme for East African research institutions.
Figures and tables from the paper
| Parameter (WHO limit) | Zone 1 Tana East | Zone 2 Muranga | Zone 3 Machakos | Zone 4 Thika | Zone 5 Embu | WHO Guideline |
|---|---|---|---|---|---|---|
| pH (6.5-8.5) | 7.1 ± 0.3 | 7.6 ± 0.4 | 6.9 ± 0.5 | 7.2 ± 0.3 | 7.4 ± 0.4 | 6.5-8.5 |
| EC (µS/cm; < 1500) | 624 ± 87 | 1,324 ± 142 | 1,986 ± 218 | 1,124 ± 133 | 1,424 ± 176 | < 1,500 |
| TDS (mg/L; < 500) | 567 ± 72 | 1,138 ± 124 | 1,768 ± 198 | 1,016 ± 118 | 1,312 ± 152 | < 500 |
| Hardness (mg/L; < 300) | 196 ± 24 | 266 ± 31 | 334 ± 42 | 294 ± 37 | 336 ± 44 | < 300 |
| Nitrate (mg/L; < 50) | 39.1 ± 4.8 | 72.6 ± 8.1 | 46.1 ± 5.4 | 54.2 ± 6.3 | 44.1 ± 5.2 | < 50 |
| Fluoride (mg/L; < 1.5) | 0.83 ± 0.12 | 1.17 ± 0.18 | 1.68 ± 0.21 | 1.02 ± 0.14 | 1.38 ± 0.17 | < 1.5 |
| Iron (mg/L; < 0.3) | 0.12 ± 0.03 | 0.19 ± 0.05 | 0.26 ± 0.07 | 0.23 ± 0.06 | 0.17 ± 0.04 | < 0.3 |
| TCC (MPN/100mL; 0) | 4.5 ± 1.2 | 11.0 ± 3.4 | 8.5 ± 2.6 | 7.6 ± 2.1 | 9.5 ± 2.8 | 0 (absent) |
Table text extracted from the original PDF; superscript letters are shown inline. The original table image is below.
View original table image
| Zone | SAR (meq/L)½ | Na% (%) | RSC (meq/L) | Kelly's Ratio | Wilcox Class | USSL Class | Suitability Assessment |
|---|---|---|---|---|---|---|---|
| Z1 Tana East | 1.8 | 28.4 | −0.6 | 0.40 | Excellent | C2-S1 | Good for all crops |
| Z2 Muranga | 3.4 | 42.1 | +0.8 | 0.73 | Good | C3-S1 | Moderate; select salt-tolerant crops |
| Z3 Machakos | 5.1 | 54.7 | +1.4 | 1.20 | Permissible | C3-S2 | Restricted; drainage management needed |
| Z4 Thika | 2.9 | 38.6 | +0.2 | 0.63 | Good | C3-S1 | Moderate; monitor Na accumulation |
| Z5 Embu | 3.7 | 46.2 | +1.1 | 0.92 | Permissible | C3-S1 | Moderate; leaching needed periodically |
Table text extracted from the original PDF; superscript letters are shown inline. The original table image is below.
View original table image
References
18 in the original paper- World Health Organization. Guidelines for drinkingwater quality. ed. Incorporating the 1st addendum. Geneva: World Health Organization; 2017.
- Ramachandraiah C, Praveena SM. Hydrogeochemical characteristics and groundwater quality assessment in an industrial area, Malaysia. Arab J Geosci. 2012;5(5):927-937.
- Hem JD. Study and interpretation of the chemical characteristics of natural water. 3rd ed. US Geological Survey Water-Supply Paper 2254. Washington (DC): US Geological Survey; 1989.
- Wilcox LV. Classification and use of irrigation waters. USDA Circular No. 969. Washington (DC): United States Department of Agriculture; 1955.
- Richards LA. Diagnosis and improvement of saline and alkali soils. USDA Agriculture Handbook No. 60. Washington (DC): United States Department of Agriculture; 1954.
- Freeze RA, Cherry JA. Groundwater. Englewood Cliffs (NJ): Prentice Hall; 1979.
- Maina CW, Raude JM, Karanja FK, et al. Physicochemical and bacteriological assessment of groundwater quality in Laikipia Plateau, Kenya. J Environ Sci Technol. 2016;9(2):125-139.
- Oduor SO, Schagerl M. Phytoplankton species diversity, abundance, and nutrient status of three Rift Valley saline-alkaline lakes of Kenya. J Plankton Res. 2007;29(12):1041-1053.
- Todd DK, Mays LW. Groundwater hydrology. 3rd ed. New York: Wiley; 2005.
- Piper AM. A graphic procedure in the geochemical interpretation of water analyses. Trans Am Geophys Union. 1944;25:914-923.
- Gibbs RJ. Mechanisms controlling world water chemistry. Science. 1970;170(3962):1088-1090.
- Kelly WP. Use of saline irrigation water. Soil Sci. 1963;95(4):355-391.
- Eaton FM. Significance of carbonates in irrigation waters. Soil Sci. 1950;69(2):123-133.
- Doneen LD. Notes on water quality in agriculture. Water Science and Engineering Paper No. 4001. Davis (CA): Department of Water Science and Engineering, University of California; 1964.
- Sawyer CN, McCarty PL. Chemistry for sanitary engineers. 2nd ed. New York: McGraw-Hill; 1967.
- Sisodia R, Moundiotiya C. Assessment of the water quality index of wetland Kalakho Lake, Rajasthan, India. J Environ Hydrol. 2006;14:1-11.
- Chidambaram S, Anandhan P, Prasanna MV, et al. Hydrogeochemical characterisation of groundwater in Neyveli Basin, Cuddalore District, Tamil Nadu, South India. Arab J Geosci. 2012;5(1):151-163.
- Karanth KR. Ground water assessment: development and management. New Delhi: Tata McGraw-Hill; 1987.