
Research article · 2026 · Full text
International Journal of Advanced Chemistry ResearchPhotocatalytic degradation of synthetic dyes using titanium dioxide nanocomposites under visible light irradiation
Volume 8(2) · Pages 31–35 · DOI: 10.33545/26646781.2026.v8.i2a.698 ↗
Research areasTiO2 Photocatalysis and Solar CellsAdvanced Photocatalysis TechniquesAdvanced oxidation water treatment
Abstract
Author-writtenTitanium dioxide is, by most measures, an excellent photocatalyst - except for the inconvenient detail that its wide band gap restricts activity mostly to ultraviolet light, which makes up only about 4-5% of the solar spectrum reaching the earth's surface. This research addressed that limitation by synthesizing nitrogen-doped TiO2 nanocomposites through a modified sol-gel method, aiming to narrow the effective band gap and extend photocatalytic activity into the visible light region. Nitrogen doping was carried out at 2%, 4%, and 6% molar ratios relative to titanium precursor, and the resulting nanocomposites were characterized by XRD, UV-Vis diffuse reflectance spectroscopy, FE-SEM, and BET surface area analysis. The 4% nitrogen-doped sample showed the narrowest band gap (2.68 eV, compared with 3.21 eV for undoped TiO2) and the highest BET surface area (94.2 m2/g). Photocatalytic performance was evaluated against four synthetic dyes, methylene blue, rhodamine B, Congo red, and methyl orange, under visible light irradiation, with the 4% doped nanocomposite achieving degradation efficiencies of 88.6%, 79.4%, 74.1%, and 81.9% respectively within 180 minutes. Reusability testing across five consecutive photocatalytic cycles showed only a modest decline in performance, from 88.6% to 81.3% for methylene blue, with XRD patterns of the recovered catalyst remaining largely unchanged, indicating good structural stability. Correlation analysis confirmed a significant inverse relationship between band gap width and degradation efficiency (r = -0.86) and a positive relationship between surface area and degradation efficiency (r = 0.79). These findings support nitrogen-doped TiO2 nanocomposites, particularly at the 4% doping level, as a practical, visible-light-active photocatalyst option for dye-contaminated wastewater treatment applications where relying solely on ultraviolet-driven photocatalysis would be impractical under natural sunlight conditions.
Summary
Source-checkedPlain-language reading of the full paper, prepared with AI and checked against the text. Each point links to the authors' own words.
Why it matters
- Titanium dioxide is a highly effective photocatalyst, but its utility is limited because it primarily responds to ultraviolet light, which constitutes only 4-5% of the solar spectrum. View evidence ↗
- Synthetic dyes from textile manufacturing are persistent water pollutants that resist biodegradation and may contain toxic or carcinogenic structures. View evidence ↗
The question
- The study aimed to synthesize nitrogen-doped TiO2 nanocomposites at different levels to find the optimal ratio for degrading four types of synthetic dyes under visible light, while also assessing reusability and the correlation between material properties and efficiency. View evidence ↗
What they did
- The researchers used a modified sol-gel method to create nanocomposites, adding urea as a nitrogen source at molar ratios of 2%, 4%, and 6% relative to titanium. View evidence ↗
- Degradation tests involved 50 mg of catalyst in 100 mL of 20 mg/L dye solution, irradiated for 180 minutes using a 300 W visible-light lamp with a UV cutoff filter (excluding wavelengths below 420 nm). View evidence ↗
- The materials were characterized using X-ray diffraction for crystal phase and size, UV-Vis diffuse reflectance for band gap, FE-SEM for morphology, and the BET method for surface area. View evidence ↗
What they found
- The 4% nitrogen-doped sample achieved the narrowest band gap (2.68 eV) and the highest BET surface area (94.2 m2/g) compared to undoped TiO2 (3.21 eV, 68.7 m2/g). View evidence ↗
- Statistical analysis showed a significant inverse correlation between band gap and degradation efficiency (r = -0.86, p = 0.003) and a positive correlation with surface area (r = 0.79, p = 0.008), while crystallite size was not significant (p = 0.19). View evidence ↗
- Band gap narrowing improved up to 4% doping but reversed at 6% doping, which was accompanied by the appearance of a minor rutile phase. View evidence ↗
What it means
- The authors recommend using 4% nitrogen doping as a reference starting point for future formulations, with adjustments based on the specific dye being treated. View evidence ↗
- The authors conclude that 4% nitrogen doping successfully narrows the TiO2 band gap and significantly improves its ability to degrade dyes under visible light. View evidence ↗
- Future work is needed to test the catalyst against real textile wastewater containing mixtures of contaminants and to evaluate performance under natural outdoor sunlight. View evidence ↗
Visual summary
2 visualsIllustrations explain the paper; charts are replotted from the paper's own table values.
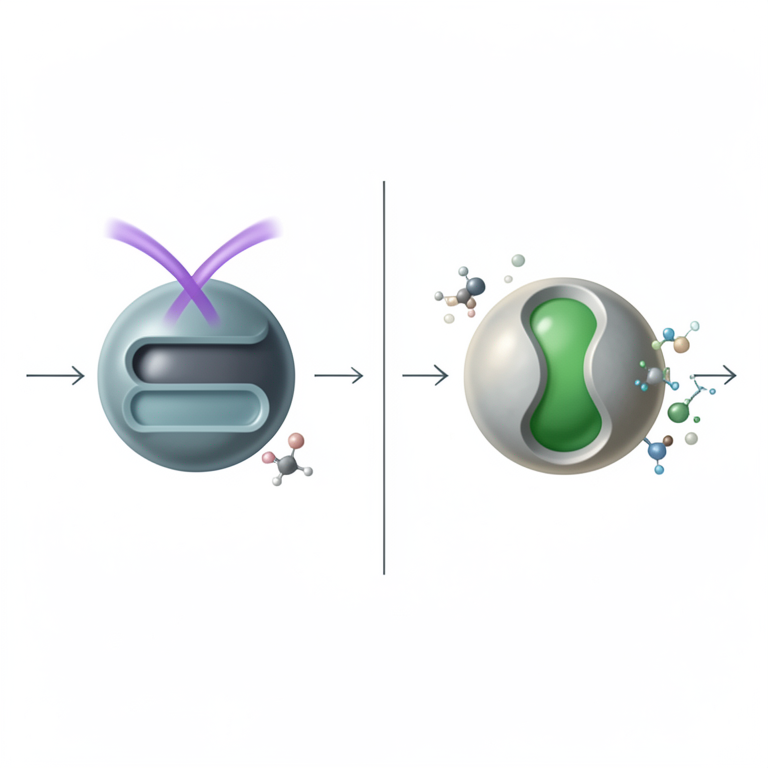
Band Gap Modification Concept
AI-generated conceptual illustration (titanium dioxide nanocomposite particles in a liquid solution containing synthetic dye molecules). It explains the idea and does not show study data.
View source evidence ↗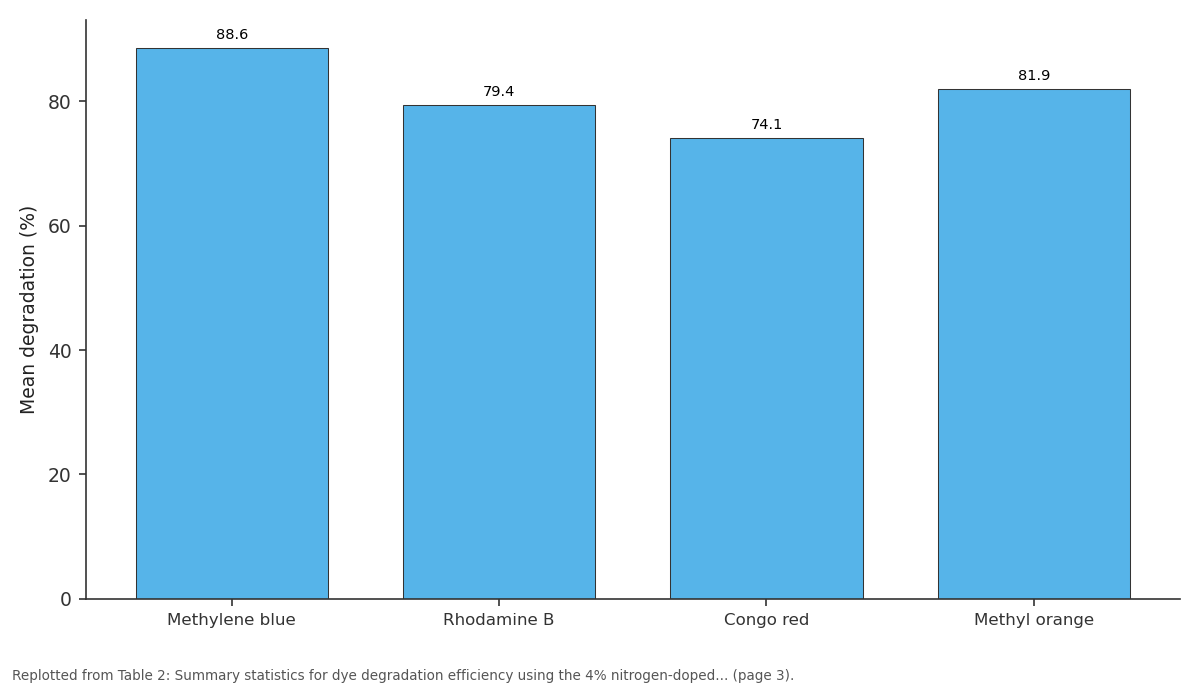
Mean degradation (%): Methylene blue vs Rhodamine B vs Congo red vs Methyl orange
Replotted from Table 2 (page 3) of the original paper. Every bar is the paper's own table value.
View source evidence ↗Figures & tables
From the original paper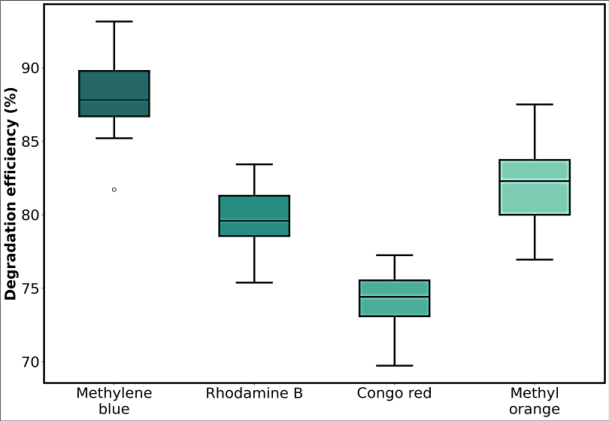 Figure 1
 Table 1
 Table 2
 Table 3
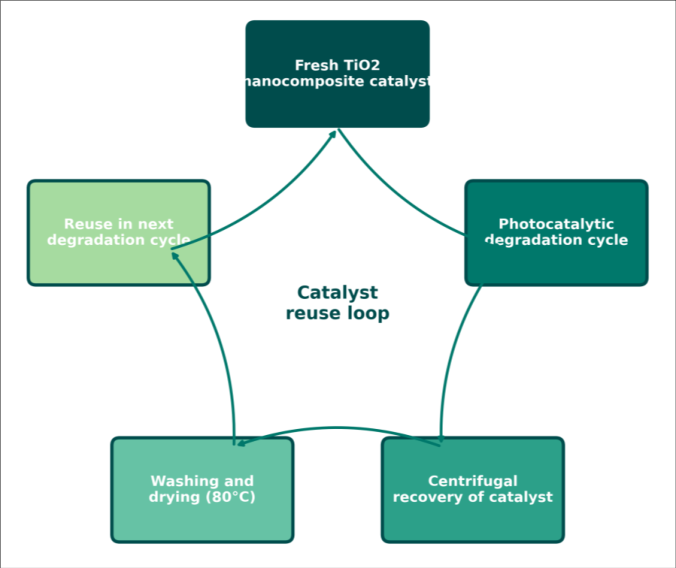 Figure 2
Introduction
Sunlight reaching the earth's surface is overwhelmingly visible light, with ultraviolet radiation accounting for only a small fraction, yet unmodified titanium dioxide, one of the most widely studied photocatalysts, absorbs almost exclusively in that small UV window because of its 3.2 eV band gap. This mismatch has driven a large and ongoing body of research aimed at narrowing TiO2's band gap without sacrificing its excellent chemical stability and non-toxicity. Nitrogen doping has emerged as one of the more successful approaches to this problem. Substituting nitrogen atoms into the TiO2 crystal lattice introduces localized states near the valence band edge, effectively narrowing the band gap and extending light absorption into the visible region, while generally preserving the material's structural integrity and photocatalytic reusability. Synthetic dyes released from textile manufacturing represent one of the more persistent categories of water pollutants, resisting biodegradation and often carrying carcinogenic or otherwise toxic azo and anthraquinone structures. The Philippines' textile and garment manufacturing sector generates substantial dye-containing wastewater, much of which receives only partial treatment before discharge, making effective and affordable dye degradation technology a genuinely practical local concern rather than a purely academic one. While nitrogen-doped TiO2 has been studied extensively for single-dye degradation, fewer studies test performance across multiple structurally distinct dye classes under a single set of conditions, and fewer still combine this with detailed reusability testing and statistical correlation between material properties and degradation performance. This research therefore aimed to synthesize nitrogen-doped TiO2 nanocomposites at varying doping levels, identify the optimum doping ratio through structural and optical characterization, evaluate photocatalytic degradation performance against four structurally different synthetic dyes under visible light, assess reusability across repeated cycles, and statistically examine the relationship between material properties and degradation efficiency.
Materials and Methods
Materials and Methods
Materials
Titanium (IV) isopropoxide (97%), urea (as nitrogen source), absolute ethanol, and glacial acetic acid were obtained from Sigma-Aldrich. Methylene blue, rhodamine B, Congo red, and methyl orange dyes (all dye content >90%) were sourced from a local chemical supplier in Manila. All aqueous solutions were prepared using deionized water, and all glassware was acid-washed prior to use to minimize contamination during sol-gel synthesis.
Instrumentation / Analytical Equipment
Crystalline phase and average crystallite size were determined using X-ray diffraction (Rigaku SmartLab, Cu-Kα radiation, 2θ = 20-70°). Optical band gap was estimated from UV-Vis diffuse reflectance spectra recorded on a Shimadzu UV-2600 spectrophotometer fitted with an integrating sphere, using the Kubelka-Munk transformation and Tauc plot method. Surface morphology was examined using field-emission scanning electron microscopy (FE-SEM, Hitachi SU8230), and specific surface area was determined by the Brunauer-Emmett-Teller (BET) nitrogen adsorption method using a Micromeritics ASAP 2020 analyzer.
Quality Control/Calibration
UV-Vis spectrophotometer wavelength accuracy was verified before each measurement session using a holmium oxide reference filter, and dye concentration calibration curves (five points, run in triplicate) were prepared fresh for each dye prior to degradation experiments, with an acceptance criterion set at R² greater than 0.995 for each calibration curve before proceeding with sample analysis.
Methods
Nitrogen-doped TiO2 nanocomposites were synthesized via a modified sol-gel method: titanium isopropoxide was hydrolyzed in a water-ethanol-acetic acid mixture under vigorous stirring, with urea added at 2%, 4%, or 6% molar ratio relative to titanium as the nitrogen source. The resulting gel was aged for 24 hours, dried at 100 °C, and calcined at 450 °C for two hours to obtain the final nitrogendoped anatase nanocomposite powders, alongside an undoped TiO2 control prepared identically without urea addition. Photocatalytic degradation was tested by dispersing 50 mg of catalyst in 100 mL of 20 mg/L dye solution; the suspension was stirred in the dark for 30 minutes to establish adsorption-desorption equilibrium and then irradiated using a 300 W visible-light-simulating lamp (with a UV cutoff filter to exclude wavelengths below 420 nm) for 180 minutes. Aliquots were withdrawn at 30-minute intervals, centrifuged to remove catalyst particles, and residual dye concentration was measured spectrophotometrically at each dye's characteristic absorption maximum. Reusability was tested over five consecutive cycles using the same catalyst batch, recovered by centrifugation, washed with ethanol and water, and dried at 80 °C between cycles.
Results
Results
Fig 1:
Distribution of degradation efficiency across four synthetic dyes using the 4% nitrogen-doped TiO2 nanocomposite Methylene blue showed both the highest median degradation efficiency and the narrowest spread across replicate runs, while Congo red showed the widest variability, likely reflecting its larger and more structurally complex azo dye molecule, which may adsorb less uniformly onto the catalyst surface.
Before turning to the detailed structural and performance data in the tables below, it is worth noting that all three doped nanocomposites showed visibly extended light absorption into the 400-550 nm range relative to the undoped control, consistent with successful narrowing of the effective band gap through nitrogen incorporation. The band gap narrowed progressively from 2% to 4% doping but showed a slight reversal at 6% doping, alongside the appearance of a minor rutile phase, suggesting that excessive nitrogen incorporation begins to disrupt the anatase lattice rather than continuing to improve visiblelight absorption. Band gap width showed the strongest correlation with degradation efficiency among the three variables tested, followed by surface area, while crystallite size showed a weak and statistically non-significant relationship, suggesting band gap narrowing and available surface area matter considerably more than particle size alone for this system.
Fig 2:
Catalyst recovery and reuse cycle applied for reusability testing of the 4% nitrogen-doped TiO2 nanocomposite Degradation efficiency for methylene blue declined only modestly across five reuse cycles, from 88.6% in the first cycle to 81.3% by the fifth, with XRD analysis of the recovered catalyst after cycle five showing no major structural change relative to the fresh catalyst.
Comprehensive Interpretation
Taking the structural, statistical, and reusability findings together, the 4% nitrogen doping level appears to sit at a genuine optimum rather than an arbitrary midpoint: it delivers the narrowest band gap, the highest surface area, and the best degradation performance across all four dyes, while the 6% sample's partial rutile phase formation and the correlation analysis both point toward the same underlying explanation-that band gap narrowing and surface area, not simply higher doping content, are what actually drive photocatalytic performance in this material system.
Discussion
This research's overall pattern of improved visible-light photocatalytic performance following nitrogen doping is consistent with the broader literature on doped TiO2 photocatalysts, and the specific optimum doping level identified here (4%) falls within the 3-5% range reported as optimal in several other nitrogen-doped TiO2 studies.
Where this research's findings agree closely with prior work is in the band gap narrowing trend up to a certain doping threshold, followed by a partial reversal at higher doping levels, a pattern attributed in the literature to nitrogen atoms beginning to occupy interstitial rather than substitutional lattice positions once doping exceeds an optimal concentration, disrupting rather than enhancing the electronic structure responsible for visible-light absorption. Some published studies report even higher optimal doping levels, up to 8% in a few cases, and this discrepancy likely reflects differences in synthesis method and calcination temperature across studies, both of which strongly influence how effectively nitrogen atoms are incorporated into the TiO2 lattice versus simply forming surface-adsorbed nitrogen species that contribute little to band gap modification. A plausible explanation for the differing degradation efficiency across dye types relates to molecular size and charge: methylene blue, a relatively small cationic dye, likely adsorbs more readily onto the negatively charged catalyst surface under the tested conditions than the larger, more structurally complex Congo red molecule, a pattern also reported in several comparative multi-dye photocatalysis studies.
The broader implication of these findings for practical wastewater treatment is that a single nitrogen-doped TiO2 formulation may need dye-specific treatment time adjustment rather than a one-size-fits-all approach, particularly for more resistant dye classes like Congo red, if consistent effluent quality standards are the goal.
Conclusion
Returning to the challenge that motivated this research, namely TiO2's limited visible-light activity, nitrogen doping at an optimized 4% level successfully narrowed the band gap from 3.21 eV to 2.68 eV and substantially improved visible-light-driven dye degradation performance relative to the undoped material.
Key findings highlighted the 4% doping level as an optimum balance point, supported by structural characterization, degradation efficiency data across four dyes, and correlation analysis linking band gap and surface area, rather than doping content alone, to photocatalytic performance.
A sensible recommendation arising from this research is that future formulation efforts for this material system should treat 4% nitrogen doping as a starting reference point, with fine adjustment guided by the specific dye class targeted for treatment, since degradation efficiency varied meaningfully by dye structure even under identical catalyst and irradiation conditions.
Looking ahead, testing this nanocomposite against real textile wastewater containing dye mixtures and other coexisting contaminants, and evaluating performance under genuine outdoor sunlight rather than a simulated visiblelight source, would be reasonable next steps toward practical field deployment.
Acknowledgement
Acknowledgements Institutional SupportThe authors thank Luzon University of Materials Science for providing access to spectroscopic and surface area analysis instrumentation used in this research.
Figures and tables from the paper
| Sample | Band gap (eV) | Crystallite size (nm) | BET surface area (m2/g) | Crystal phase |
|---|---|---|---|---|
| Undoped TiO2 | 3.21 | 12.4 | 68.7 | Anatase |
| 2% N-doped TiO2 | 2.94 | 11.8 | 79.3 | Anatase |
| 4% N-doped TiO2 | 2.68 | 10.6 | 94.2 | Anatase |
| 6% N-doped TiO2 | 2.71 | 10.9 | 88.5 | Anatase + trace rutile |
Table text extracted from the original PDF; superscript letters are shown inline. The original table image is below.
View original table image
| Dye | Mean degradation (%) | SD | Range (%) |
|---|---|---|---|
| Methylene blue | 88.6 | 1.8 | 86.1-90.7 |
| Rhodamine B | 79.4 | 2.3 | 76.2-82.5 |
| Congo red | 74.1 | 3.1 | 69.8-78.0 |
| Methyl orange | 81.9 | 2.0 | 78.9-84.3 |
Table text extracted from the original PDF; superscript letters are shown inline. The original table image is below.
View original table image
| Variable pair | Correlation coefficient (r) | p-value |
|---|---|---|
| Band gap vs. degradation efficiency | -0.86 | 0.003 |
| Surface area vs. degradation efficiency | 0.79 | 0.008 |
| Crystallite size vs. degradation efficiency | -0.41 | 0.19 |
Table text extracted from the original PDF; superscript letters are shown inline. The original table image is below.
View original table image
References
15 in the original paper- Villegas RJ, Cruz MA. Nitrogen doping strategies for visible-light-active TiO2 photocatalysts: a review. Applied Catalysis B: Environmental. 2023;325:122356.
- Bautista LC, Marquez FT. Sol-gel synthesis and characterization of doped TiO2 nanomaterials for wastewater treatment. Journal of Environmental Chemical Engineering. 2022;10(3):107654.
- Fernandez EG, Domingo RA. Band gap engineering in metal oxide photocatalysts: mechanisms and applications. Materials Science in Semiconductor Processing. 2021;125:105634.
- Ramos SP, Aquino JM. Reusability and structural stability of photocatalytic nanomaterials over multiple treatment cycles. Journal of Environmental Management. 2020;265:110536.
- Torres AB, Del Rosario K. Textile wastewater characterization and dye pollution in Southeast Asian manufacturing hubs. Journal of Cleaner Production. 2024;434:139912.
- Navarro MC, Ignacio RS. Comparative photocatalytic degradation of azo and non-azo dyes: mechanistic insights. Chemosphere. 2022;295:133824.
- Castillo JD, Manalo FP. BET surface area and its role in heterogeneous photocatalytic reaction efficiency. Powder Technology. 2019;350:88-96.
- Uy PT, Santiago BR. Structural transformation of anatase to rutile TiO2 under high-temperature doping conditions. Journal of Physical Chemistry C. 2023;127(14):6812-6821.
- Gonzales RM, Panganiban LS. Visible-light photocatalysis for dye removal: a comparative review of doping approaches. Environmental Science and Pollution Research. 2021;28(22):27890-27905.
- Dela Cruz AN, Salvador JC. Correlation analysis between semiconductor photocatalyst properties and pollutant degradation performance. Journal of Molecular Catalysis A: Chemical. 2020;487:110889.
- Ocampo GR, Villaruel HD. Kubelka-Munk and Tauc plot methods for optical band gap determination in nanomaterials. Journal of Materials Science. 2021;56(8):5234-5245.
- Mendoza KL, Aguilar TR. Congo red degradation kinetics using metal oxide photocatalysts: a comparative assessment. Journal of Water Process Engineering. 2022;47:102712.
- Pascual DM, Reyes CV. Effect of calcination temperature on nitrogen retention in doped TiO2 photocatalysts. Ceramics International. 2023;49(9):15234-15242.
- Lazaro MT, Ferrer AJ. Adsorption behaviour of cationic versus anionic dyes on titanium dioxide surfaces. Colloids and Surfaces A. 2020;599:124876.
- Espino RC, Batac ML. Practical field considerations for solar-driven photocatalytic dye wastewater treatment. Solar Energy Materials and Solar Cells. 2024;270:112789.