
Research article · 2026 · Full text
International Journal of Geography Geology and EnvironmentDevelopment of 3D geospatial data and integrated solutions for the administration, management, and monitoring of climate-adapted coastal smart cities in Vietnam
Volume 8(7) · Pages 32–39 · DOI: 10.22271/27067483.2026.v8.i7a.802 ↗
Research areas3D Modeling in Geospatial ApplicationsSmart Cities and TechnologiesGeographic Information Systems Studies
Abstract
Author-writtenThe development of smart cities in Vietnam's coastal urban areas faces unique challenges in addressing issues such as the consequences of climate change, rising sea levels, urban floods, storms, marine pollution, and other related factors. To meet this demand, in addition to developing urban infrastructure systems, there needs to be an information infrastructure and data system that allows policymakers, administrators, and residents to connect and formulate preparedness and response plans, minimizing risks during extreme events. The most crucial information resource for a smart coastal city is the 3D geospatial data of the city. The 3D geospatial data of Halong city was established based on the geospatial technologies with popular software such as Excel, ArcMap, Sketchup, FME. Based on the results we have developed for the Ha Long coastal area, we will make recommendations on using 3D geospatial data to enhance governance, management, manage and monitor coastal smart cities as they adapt to climate change in Vietnam.
Summary
Source-checkedPlain-language reading of the full paper, prepared with AI and checked against the text. Each point links to the authors' own words.
Why it matters
- Coastal smart cities in Vietnam face significant challenges due to climate change, including rising sea levels, storms, and urban flooding. View evidence ↗
- Beyond physical infrastructure, these cities require information and data systems to help policymakers and residents plan responses to extreme events and minimize risks. View evidence ↗
- 3D geospatial data is considered the most critical information resource for the operation of a smart coastal city. View evidence ↗
The question
- The study aims to develop 3D geospatial data for Ha Long city to provide recommendations for enhancing the governance and monitoring of climate-adapted coastal smart cities in Vietnam. View evidence ↗
What they did
- The research focused on Hung Thang Ward in Ha Long City, Vietnam, surveying an area of approximately 1.17 km² using an unmanned aerial vehicle (UAV). View evidence ↗
- The study integrated three data acquisition techniques: terrestrial laser scanning, terrestrial photogrammetry, and unmanned aerial systems (UAV). View evidence ↗
- The 3D geospatial data was processed and established using software including Excel, ArcMap, Sketchup, and FME. View evidence ↗
- The research methodology was structured into three distinct phases: data acquisition, data processing, and the generation of results. View evidence ↗
What they found
- The study successfully integrated the fused datasets to construct a final 3D model of the experimental area. View evidence ↗
- The resulting 3D geospatial data was organized into specific urban feature layers, including buildings, trees, traffic, and hydrological data. View evidence ↗
- The use of different Levels of Detail (LoD) in 3D geospatial data provides more specific and visually detailed technical drawings for real estate management. View evidence ↗
- The authors note that approximately 80% of urban planning and management decisions are based on the analysis of geospatial information. View evidence ↗
- The 3D model can be used for emergency response, such as pre-selecting the optimal placement for firefighting ladders before teams arrive. View evidence ↗
- Integrating smart drainage systems with 3D spatial models allows for accurate, real-time monitoring of water levels. View evidence ↗
- 3D geospatial analysis allows for the optimization of waste management by determining ideal landfill locations and the most cost-effective collection routes. View evidence ↗
What it means
- The authors conclude that 3D geospatial data, consisting of multiple layers and X, Y, Z coordinates, provides essential input for urban administration and monitoring. View evidence ↗
Visual summary
1 visualsIllustrations explain the paper; they do not show study data.
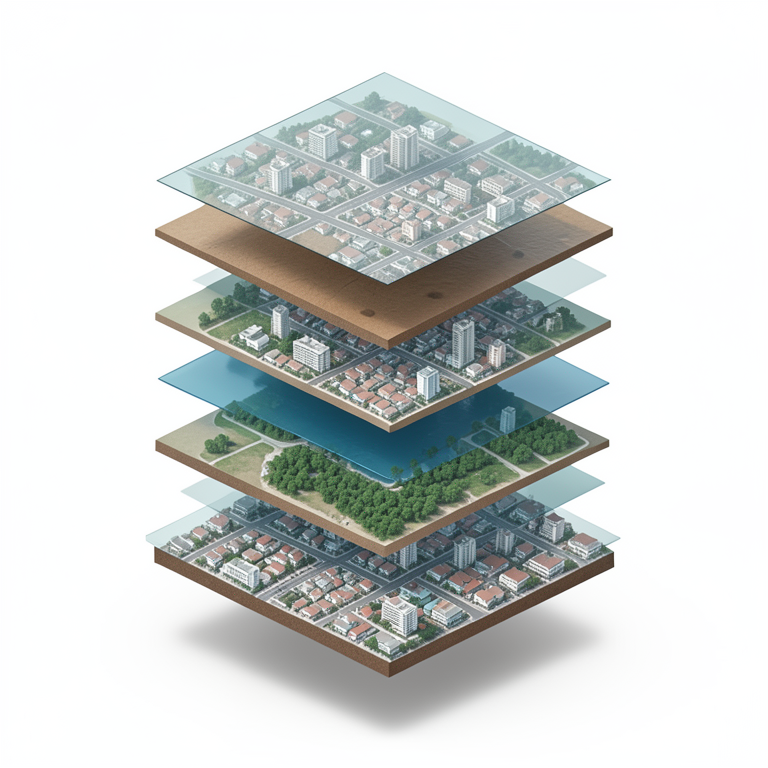
Layers of 3D Geospatial Data
AI-generated conceptual illustration (A coastal city in Vietnam). It explains the idea and does not show study data.
View source evidence ↗Figures & tables
From the original paper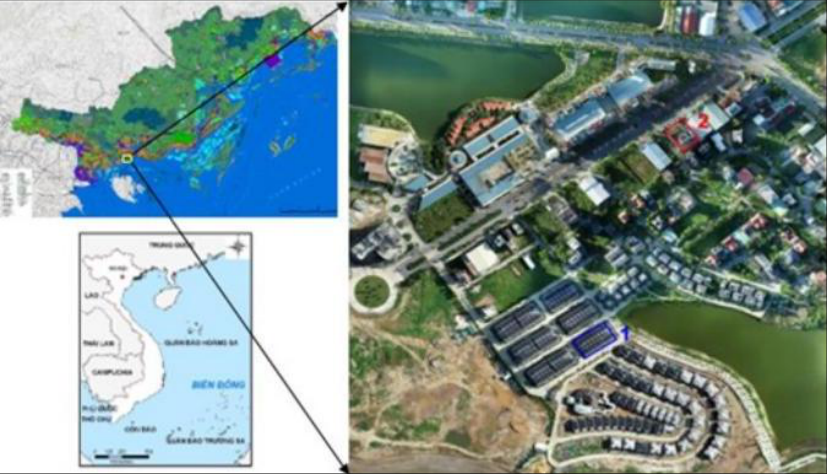 Figure 1
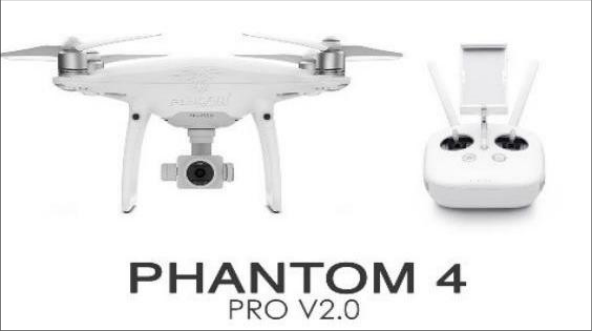 Figure 2
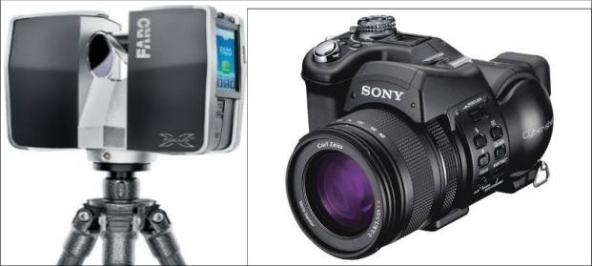 Figure 3
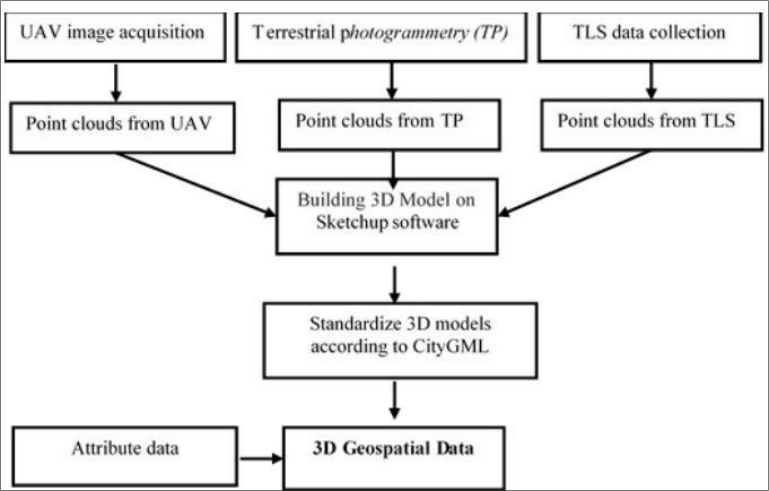 Figure 4
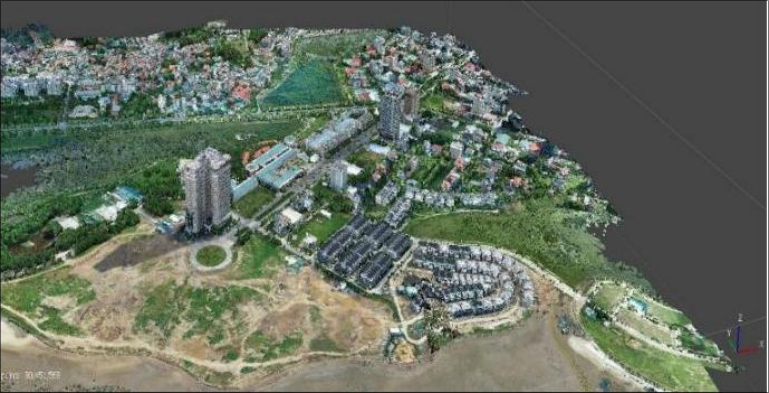 Figure 5
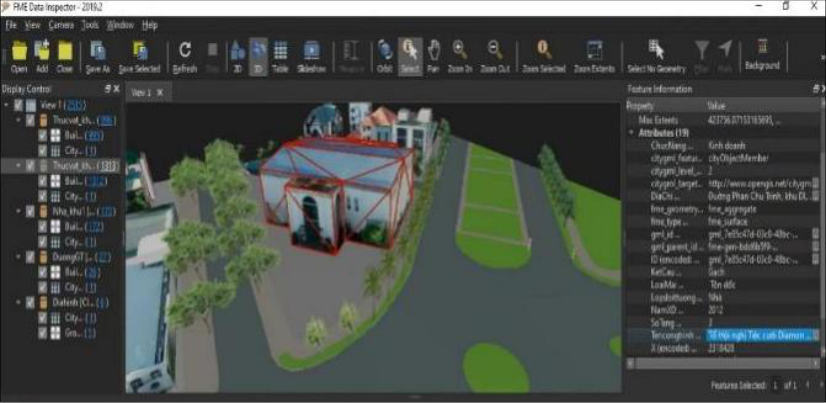 Figure 6
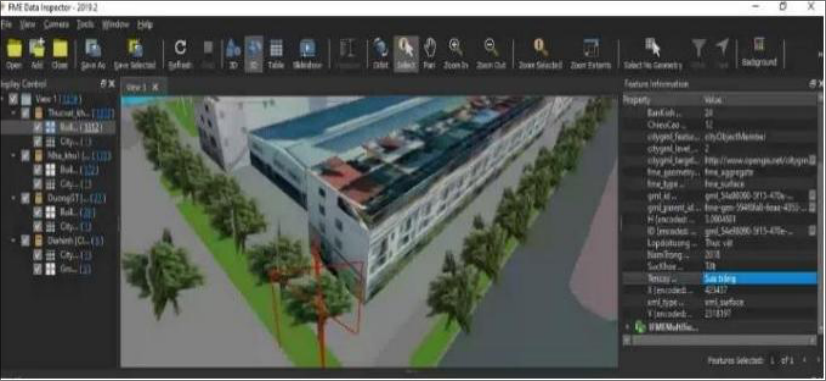 Figure 7
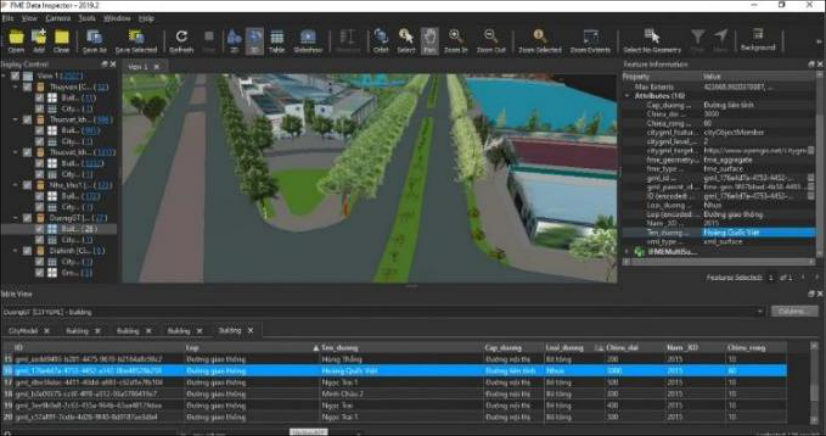 Figure 8
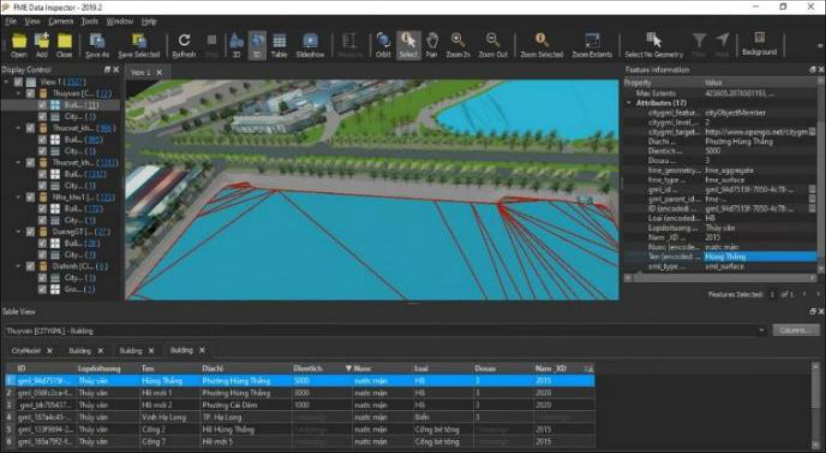 Figure 9
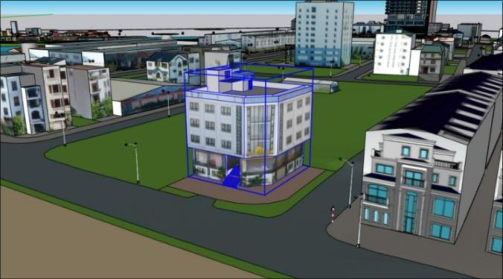 Figure 10
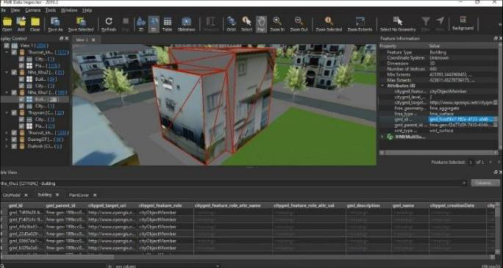 Figure 11
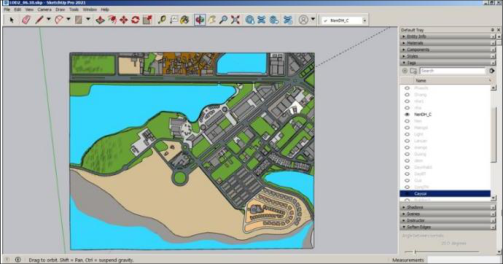 Figure 12
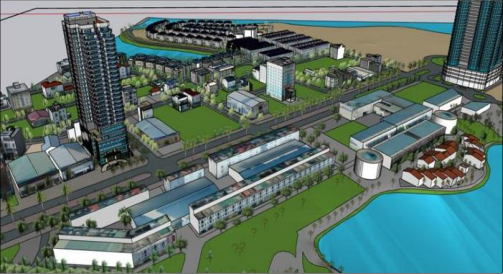 Figure 13
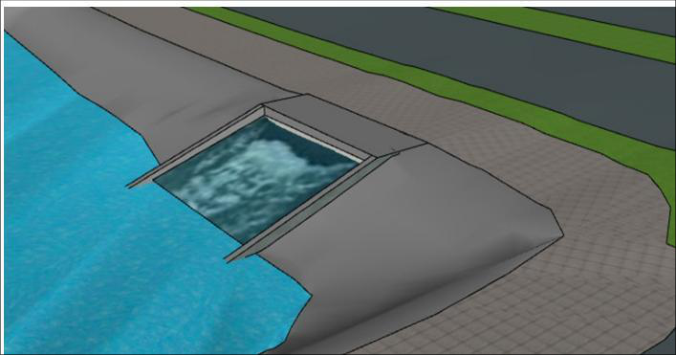 Figure 14
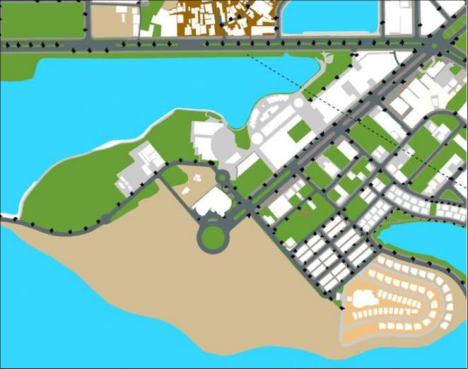 Figure 15
Introduction
3D geospatial data is a geographic information system (GIS) database system where each geographical entity is treated as a presence situated in a three-dimensional (3D) space. These databases are designed for efficient storage and retrieval of information pertaining to objects within a geospatial model. Numerous 3D database models exist, and one of the exemplary models is characterized by having just two primary components: spatial data and attribute data. Spatial data represents an assembly of objects within 3D space, consisting of points defined by a threedimensional coordinate system (x, y, z), accompanied by 3D geographical entities and their associated property information. Coastal cities, characterized by significant population density, face the crucial objective of constructing smart urban environments to safeguard residential communities from the consequences of extreme events. To fulfill this need, beyond constructing urban infrastructure, establishing information and data systems is crucial. These systems assist policymakers, managers, and residents in collaborating to devise strategies for readiness and response, reducing risks during extreme events. The primary information system in a smart coastal city is its 3D geospatial data (Kumar, 2014) [5] . In developed nations, the use of 3D geospatial information and geospatial technologies in constructing intelligent coastal cities to tackle climate change and rising sea levels has been put into practice. Meanwhile, the utilization of LiDAR data to generate 3D geospatial information has offered solutions in crafting flood geospatial data for a city in Honduras (Haile and Rientjes, 2005) [2] . UAV data was utilized to develop a 3D coastal map for Pusan, Korea, aiding its adaptation to climate change (Yoo, Oh, and Choi, 2018) [12] . Additionally, (Papakonstantinou et al., 2015) [8] delineated coastal regions and crafted 3D maps using UAV data for the advancement of smart city initiatives in Lesvos Island and the Eressos coast, Greece. These studies highlight the capability of geospatial data in constructing 3D geospatial information for smart cities, specifically in adapting to coastal regions within developed nations. Presently, our country is advancing towards smart city development, with approximately 30 cities already in the process. Among these cities are Hanoi, Ho Chi Minh City, Ha Long, Hai Phong, Thai Nguyen, Da Nang, Hue, Da Lat, Binh Duong, Can Tho, and more…Vietnam is currently adopting a fresh strategy for organizing and overseeing marine areas through a geospatial database system. This system aims to detail the positions and spatial boundaries of marine entities while directing oceanic courses. It assists in coastal and marine area planning, shaping legal frameworks, and offers a foundation for users and stakeholders to depict, visualize, and recognize spatial data pertaining to the sea and coastal regions, presented as 3D geospatial information. Creating 3D geospatial data demands consideration of Vietnam's coastal city features amid climate change. This involves using existing data and incorporating new, locationspecific data tailored to each area within the country's localities. In our study, we have used a technique to integrate the different data acquisition techniques, including terrestrial laser scanner, terrestrial photogrammetry, and unmanned aerial system (UAV). The project has built a 3D geospatial data set for the coastal smart city of Ha Long city, Quang Ninh province. This study focuses on recommendations on using 3D geospatial data to enhance governance, management, manage and monitor coastal smart cities as they adapt to climate change in Vietnam.
Building 3D geospatial data for the coastal area of Ha Long City 2.1 Study Area
The study area is Hung Thang Ward, located in Ha Long City, Quang Ninh Province (see Fig. 1), Vietnam. The area was surveyed using an unmanned aerial vehicle (UAV), covering approximately 1.17 km² and encompassing various features such as buildings, urban vegetation, water bodies, and other land cover components. This area exhibits heterogeneous development characteristics: the southeastern part has been developed according to a new urban structure, while the southwestern part is still under construction, featuring adjacent villa complexes and newly built high-rise hotels along the coastline. The methodology of this study can be categorized into three phases: data acquisition, data processing, and the results (fig. 4)
The results
Upon achieving satisfactory integration results, the fused dataset is employed to construct a 3D model, which represents the final output of this study. Figure 5 depicts the resulting 3D model derived from the point cloud integration process, whereas Figures 6 through 9 present the 3D geospatial data corresponding to different urban feature layers within the study area. Furthermore, 3D geographic spatial data of the city provides the capability to display visuals with precise geographic coordinates and dimensions relative to reality. This allows designers and planners to efficiently develop and integrate their design proposals directly onto models for evaluation ( Fig 10). When designing transportation routes through an area, 3D urban spatial data also serves as crucial documentation for assessing impact levels, calculating information, estimating relocation and compensation costs, and determining traffic density. It also provides the optimal conditions for planning amusement parks, greenery planting, and landscape design for research areas. Furthermore, through spatial data analysis, it is possible to determine the shortest or most sensible route to make decisions regarding the most advantageous approach to an object or incident. Spatial information about housing density, infrastructure systems, the likelihood of crime occurrence serves as a foundation for urban authorities to devise preventive measures against fires, traffic incidents, and criminal activities.
Solution applying 3D geographic spatial data in smart risk alert management for coastal cities ensures adaptation to climate change.
The integration of information technology facilitates the realtime connection of data between monitoring locations and the center. Data from specialized automated monitoring stations are continuously updated online and shared with 3D geographic spatial data. With applications on mobile devices, technical staff can extract all the needed information, and some criteria are even automatically alerted by the system. In addition to automatic updates from monitoring stations, risk information data can also be contributed by the community in real-time to the relevant authorities. By combining 3D geographic spatial data with real-time models and figures, the analysis, calculation, and statistical assessment of damages (if any) during risks or natural disasters are conducted. Real-time updates of parameters and the construction of models are performed using 3D geographic spatial data, which includes the positions of real-time monitoring stations. This is combined with expert knowledge to provide forecasts for the monitored areas in the near future.
Based on actual data and forecasts, leaders can make quick decisions to minimize damages as much as possible. 3D geographic spatial data of the city provides information about buildings in the form of visual 3D data with real dimensions. In addition to calculating damages and assessing risks from natural disasters such as earthquakes, tsunamis, etc., it also aids in developing preventive measures, such as evacuation and rescue plans during disasters. The 3D geographic spatial data is constructed on a terrain with real photo overlays, assisting in choosing optimal evacuation locations in the event of flooding. In densely populated urban areas, incidents such as traffic accidents, emergency medical responses, fires, crimes, etc., occur frequently and require prompt and timely handling. Furthermore, 3D geographic spatial data provides information about the street network, buildings, roads, infrastructure, enabling experts to quickly identify and timely access the locations of incidents (Fig 13). Moreover, it helps determine the shortest or most reasonable route for approaching objects or incidents in the most advantageous way. In the case of fires, the 3D model serves as a basis for pre-selecting the location to place firefighting ladders while the firefighting team is en route to the scene.
The solution applying 3D geographic spatial data in smart water management for coastal cities involves several aspects.
The 3D geographic spatial data helps city managers have an overview of the city's water supply and drainage system, enabling them to plan renovations, upgrades, and new installations in a synchronized manner, while meeting the requirements of a smart city. 3D geographic spatial data in smart cities is used for storing, managing, manipulating, and analyzing spatial information. This data can be used to create specialized maps, enabling the design and operation of a unified water supply and drainage system for the entire city (Fig 14). This real-time model helps operators and managers know precisely when to control the system for optimal operation.
Combined with e-governance in providing new clean water services, operators can use the existing 3D spatial data of the city to make the most optimal choices during realworld deployments based on operational requirements. This comprehensive 3D geographic spatial data facilitates the implementation of a smart road transportation system, contributing to the economic and social development of coastal cities.
Solution for Applying 3D Geographic Spatial Data in Smart Waste Collection and Management for Urban Environmental Protection
Identifying environmental issues and managing the urban environment, one significant concern in large cities is urban waste. The results of spatial data analysis from 3D geographic spatial data enable the determination of landfill locations, assessing their volume and optimizing waste collection routes for cost efficiency and increased effectiveness. The landfill location depends on various criteria, such as the distance to the city center, residential areas, locations of water wells, and groundwater sources.
Analyzing multiple criteria allows identifying the optimal landfill location. Spatial data analysis helps determine the optimal collection routes for waste transportation within the urban area. Optimized collection routes contribute to cost savings in transportation, fuel efficiency, and time. The application of 3D database for managers and government authorities enables the identification and planning of centralized waste treatment areas using modern technology to minimize the impact on the surrounding environment. Around islands and coastlines, sensors can be placed to determine the flow of waste in the sea, allowing for quick remedies. Remote-controlled robots can also be deployed to access areas that are inaccessible to humans.
Conclusions
Based on the research findings on solutions for applying geospatial data to support the management and monitoring of smart cities, the paper draws the following conclusions: 3D geospatial data comprises multiple layers of information, including buildings, urban vegetation, hydrology, transportation, and terrain. This data provides 3D objects with spatial information in terms of coordinates (X, Y, Z) as well as associated attributes. These object attributes serve as essential input data for urban space management, administration, and monitoring. Analyses and computations derived from 3D geospatial data support early warning of natural disaster impacts, smart drainage system management, operation and monitoring of intelligent transportation systems, as well as waste collection management. These functions are fundamental to the development, operation, and governance of smart cities.
Conflict of Interest Statement
We, the authors, declare that there are no conflicts of interest related to the research, authorship, and publication of this manuscript. No financial or non-financial interests have influenced the content or findings presented. All authors have approved the manuscript and confirm that it represents our honest work.
Figures and tables from the paper
References
12 in the original paper- Biljecki F, Stoter J, Ledoux H, Zlatanova S, Çöltekin A. Applications of 3D City Models: State of the Art Review. ISPRS International Journal of Geo-Information. 2015;4(4):2842-2889.
- Haile AT, Rientjes THM. Effects of LIDAR DEM resolution in flood modelling: a model sensitivity study for the city of Tegucigalpa, Honduras. Proceedings of the ISPRS workshop laser scanning 2005, 12-15 September, Enschede ITC, The Netherlands. Available:https://www.komninos.eu/wpcontent/uploads/2014/01/2011-eChallenges_ref_196Roadmap-for-Smart-Cities-Published.pdf; 2005.
- Kozłowski W, Suwar K. Smart City: Definitions, Dimensions, and Initiatives. European Research Studies Journal. 2021;XXIV(3):509-520.
- Komninos N. Developing a policy roadmap for smart cities and the future internet. eChallenges e-2011 Conference Proceedings. 2021;1-8.
- Kumar TMV. Geographic Information System for Smart Cities. Copal Publishing Group; 2014.
- Gerhard G, Thomas HK, Angela C, Claus N. OpenGIS® City Geography Markup Language (CityGML) Encoding Standard. Version 1.0.0. Open Geospatial Consortium Inc.; 2008
- Góźdź K, Pachelski W, Oosterom PO, Coors V. The possibilities of using CityGML for 3D representation of buildings in the cadastre. Proceedings of the 4th International Workshop on 3D Cadastres, 9-11 November 2014, Dubai, United Arab Emirates. 2014;339-362.
- Papakonstantinou A, Topouzelis K, Pavlogeorgatos G. Coastline Zones Identification and 3D Coastal Mapping Using UAV Spatial Data. International Conference on Environmental Management Engineering, Planning and Economics (CEMEPE 2015). 2015.
- OGC CityGML 3.0 Conceptual Model. [Online]. Available:https://github.com/opengeospatial/CityGML3.0CM;2020.
- Kutzner T, Chaturvedi K, Kolbe T. CityGML 3.0: New Functions Open Up New Applications. Journal of Photogrammetry, Remote Sensing and Geoinformation Science. 2020;88:43-61.
- Yalcin G, Selcuk O. 3D City Modelling with Oblique Photogrammetry Method. Procedia Technology. 2015;19:424-431.
- Yoo CI, Oh YS, Choi YJ. Coastal mapping of Jinu-do with UAV for Busan smart city, Korea. The International Archives of the Photogrammetry, Remote Sensing and Spatial Information Sciences. 2018;XLII(4):725-729.