
Research article · 2026 · Full text
International Journal of Geography Geology and EnvironmentUrban amenities and household resilience: A socio-economic and climatic assessment of livelihoods in Dehradun district
Volume 8(7) · Pages 25–31 · DOI: 10.22271/27067483.2026.v8.i7a.801 ↗
Research areasClimate change impacts on agricultureDisaster Management and ResilienceClimate Change and Sustainable Development
Abstract
Author-writtenThis study investigates the socio-economic and climatic dimensions of household resilience and urban amenities in Dehradun district, Uttarakhand. Using rainfall and temperature data from the India Meteorological Department (1984-2024) alongside a household survey of 300 respondents, the analysis highlights significant climatic variability marked by alternating flood-prone and drought-prone decades, rising maximum temperatures, and progressive night-time warming. These climatic shifts directly affect household livelihoods through crop loss, water scarcity, and health stress, and place pressure on urban systems such as drainage, water supply, healthcare, and education. Survey findings reveal that households are moderately educated, largely agrarian, and socially cohesive, adopting resilience strategies like migration, rainwater harvesting, and diversification. Urban responses include relief camps, tanker supply, and mobile health units. The study underscores the positive correlation between household resilience and urban amenities, emphasising the need for integrated resilience planning to mitigate climatic stress and strengthen adaptive capacity.
Summary
Source-checkedPlain-language reading of the full paper, prepared with AI and checked against the text. Each point links to the authors' own words.
Why it matters
- Peri-urban Dehradun is particularly susceptible to climate change because of fast urban growth and changes in how land is used. View evidence ↗
- The expansion of urban areas in Dehradun has quickly converted forests and fertile farmland into dense built-up zones. View evidence ↗
- In India, the quality of urban life is largely determined by access to basic services like water, electricity, sanitation, and clean fuel. View evidence ↗
The question
- The study aims to analyze temperature and rainfall trends in Dehradun from 1984 to 2014 and evaluate how this climatic variability affects urban amenities and household resilience. View evidence ↗
What they did
- Researchers conducted a structured survey of 300 individuals, selecting 50 people from each of the six development blocks in Dehradun district. View evidence ↗
- The study used a mixed-methods approach, integrating quantitative climate data with qualitative results from household surveys. View evidence ↗
What they found
- Rainfall showed sharp fluctuations between 1984 and 2014, with peaks above 600 mm in 1984 and 1994, a drop to around 260 mm in 2004, and a rise to over 570 mm in 2014. View evidence ↗
- Peak maximum temperatures rose steadily over the decades, from 32-33 °C in 1984 to approximately 40 °C in 2014. View evidence ↗
- The surveyed population was primarily middle-aged (59.33%), with young adults making up 23.33% and older adults 17.33%. View evidence ↗
- Agriculture is the main livelihood for 53.33% of households, though 20% work in services and 18.67% in business. View evidence ↗
- Floods and droughts are the most severe climatic events, affecting 42% and 36% of the surveyed households, respectively. View evidence ↗
- During drought years, 50% of households reported water supply shortages, placing significant pressure on urban systems. View evidence ↗
- Flood-related disruptions, including road blockages and drainage overflow, affected 45% of households. View evidence ↗
- There is a positive correlation (r ≈ 0.65) between the Household Resilience Index (HRI) and the Urban Amenities Index (UAI), meaning better urban infrastructure lowers household vulnerability. View evidence ↗
What it means
- The authors conclude that sustainable resilience in Himalayan districts requires integrated planning that combines infrastructural improvements with socio-economic adaptation. View evidence ↗
Visual summary
3 visualsIllustrations explain the paper; charts are replotted from the paper's own table values.
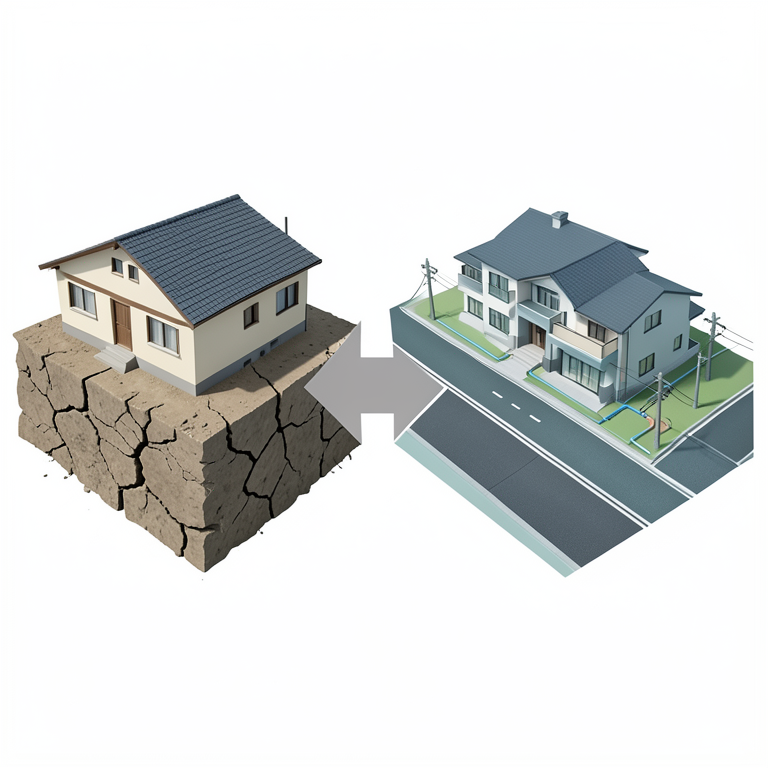
Resilience Correlation Concept
AI-generated conceptual illustration (Urban residential houses and city infrastructure in Dehradun district). It explains the idea and does not show study data.
View source evidence ↗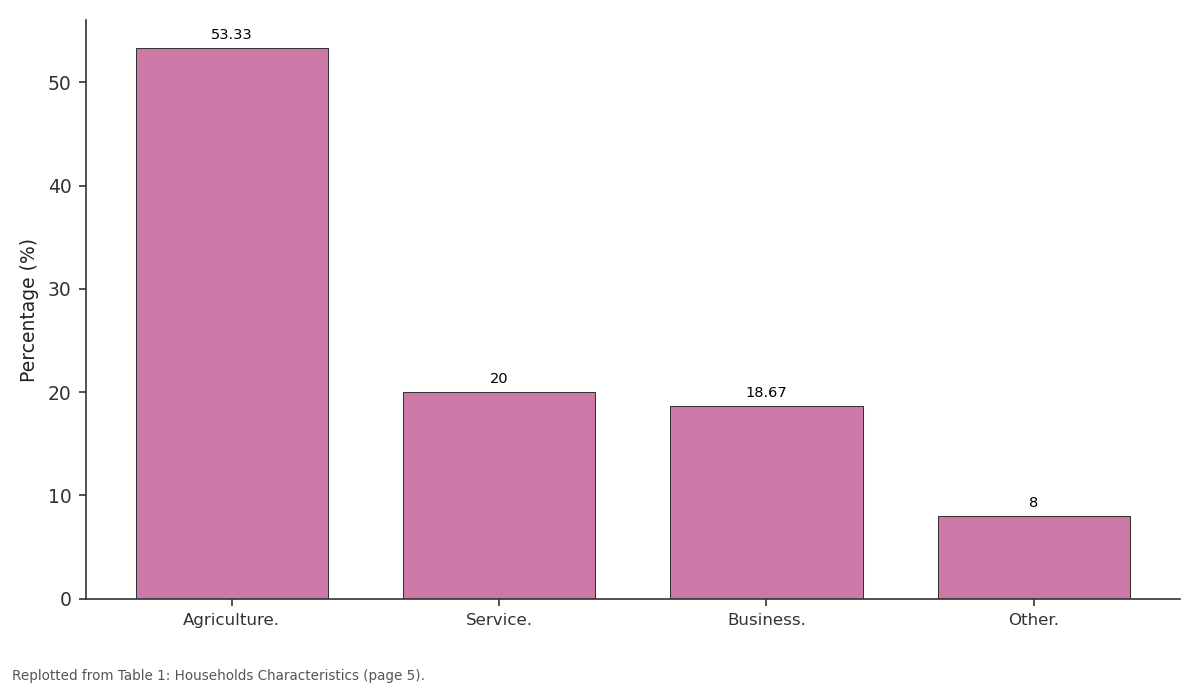
Percentage (%): Agriculture. vs Service. vs Business. vs Other.
Replotted from Table 1 (page 5) of the original paper. Every bar is the paper's own table value.
View source evidence ↗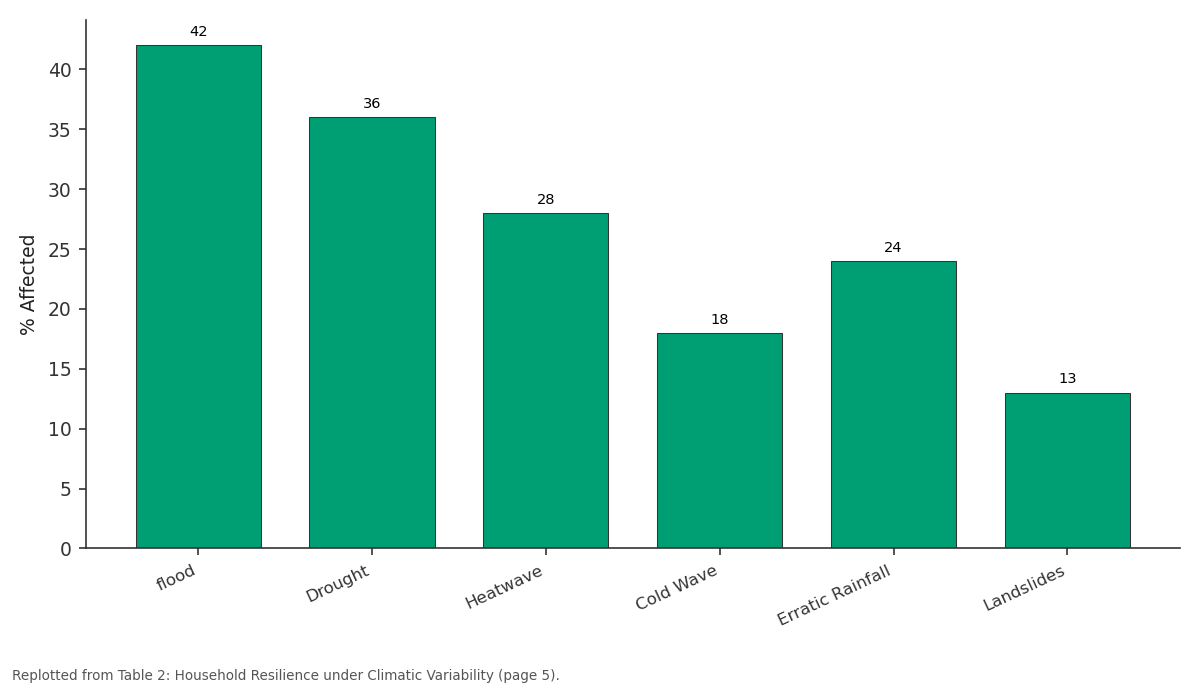
% Affected: flood vs Drought vs Heatwave vs Cold Wave vs Erratic Rainfall
Replotted from Table 2 (page 5) of the original paper. Every bar is the paper's own table value.
View source evidence ↗Figures & tables
From the original paper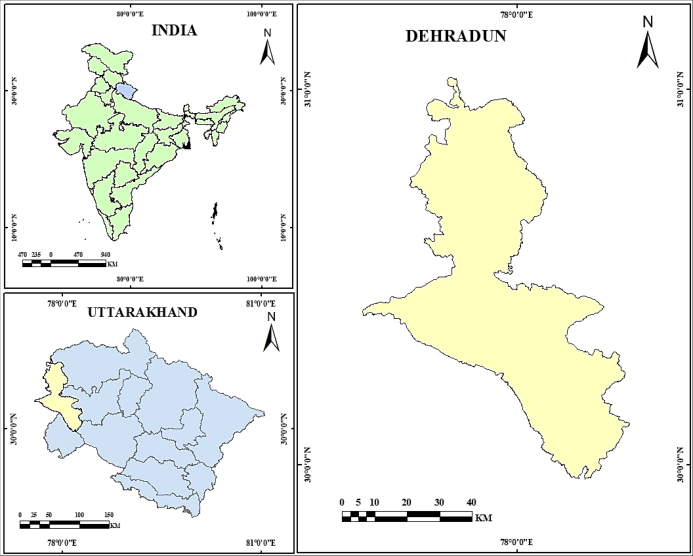 Figure 1
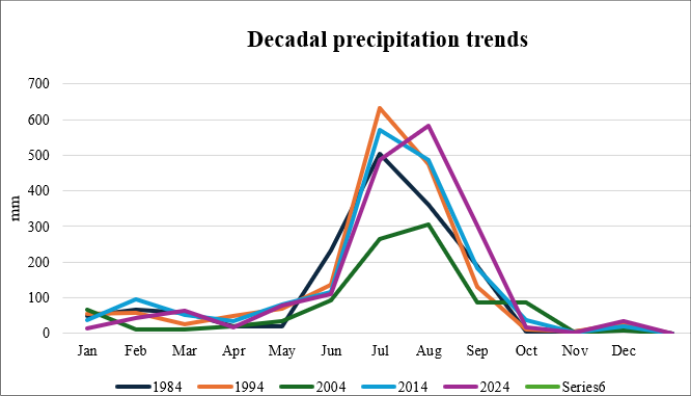 Figure 2
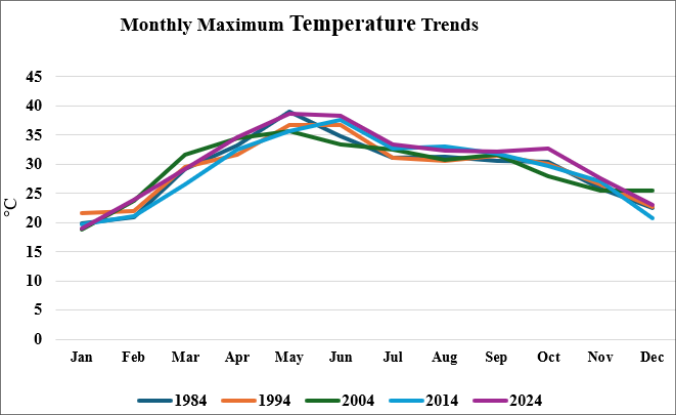 Figure 3
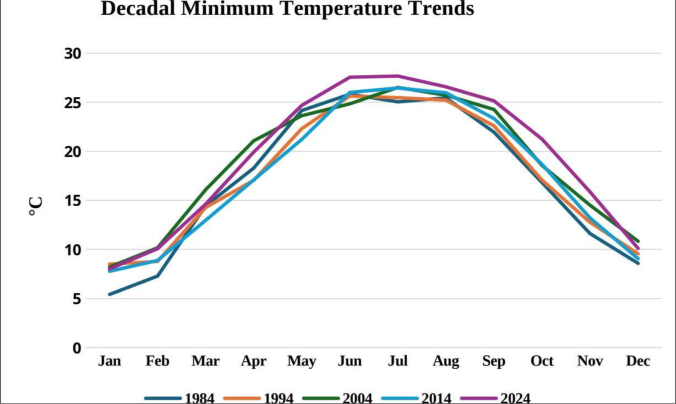 Figure 4
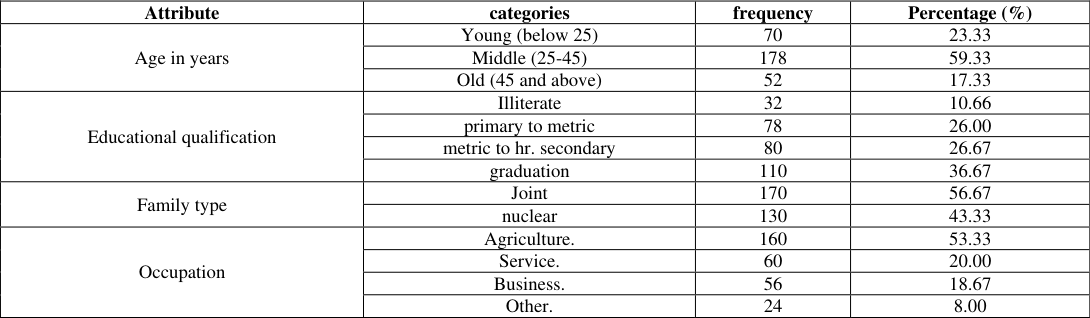 Table 1
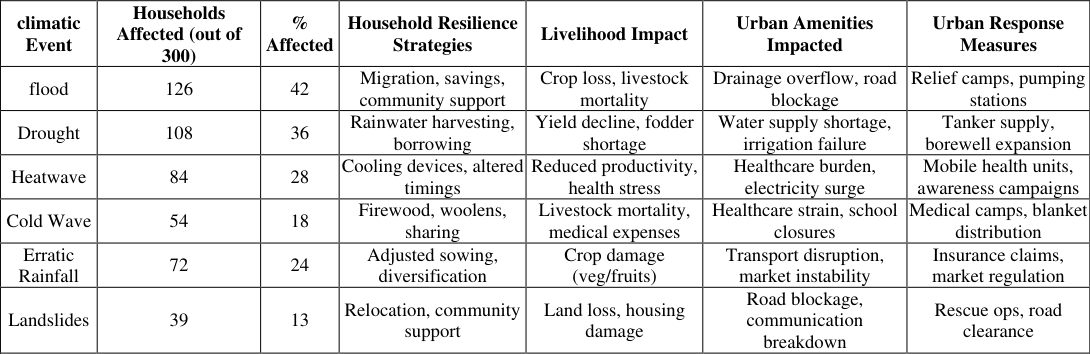 Table 2
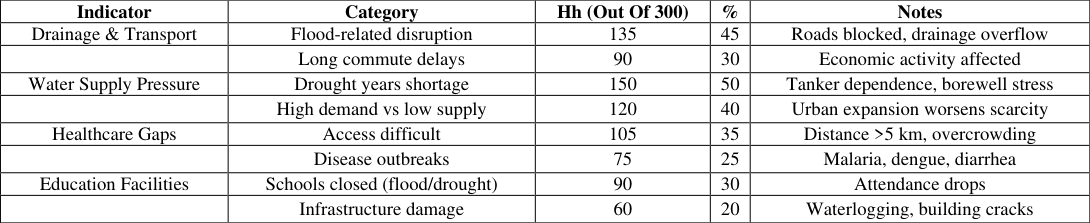 Table 3
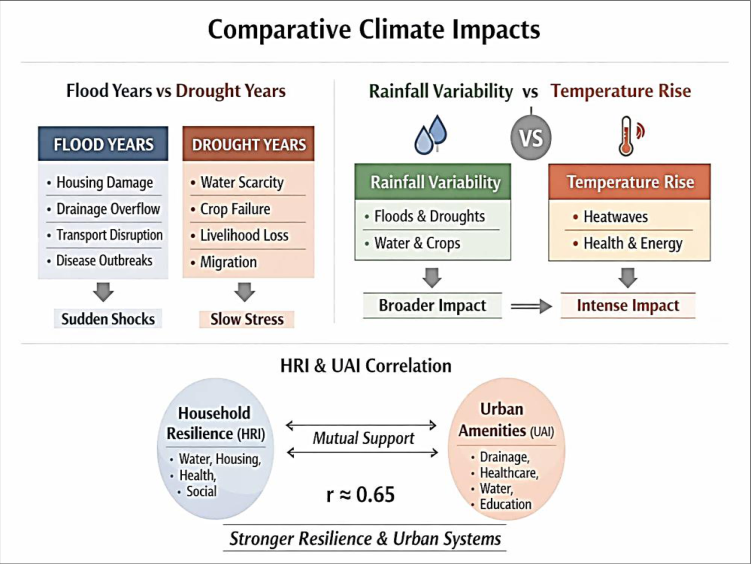 Figure 5
Introduction
Peri-urban Dehradun is highly vulnerable to climate change due to rapid land-use transitions and urban expansion. Dual methodology-spatio-temporal indices (NDVI, NDBI, LST) and perception-based surveys-reveals strong correlations with rising heat and rainfall variability. Built-up area expanded from 531.1 sq km (2000) to 834.2 sq km (2020), while vegetation declined, intensifying urban heat. Community interviews highlight shifting monsoon patterns, fragile infrastructure, and water stress. Adaptive frameworks-green infrastructure, zoning policies, and AI-based monitoring are essential for resilience planning. Joint action among governments, companies, and communities is critical to scale sustainable strategies globally. Saini, Shrivastava, Dhupper, & Gupta et al. (2025) [1] . Urban expansion in Dehradun has rapidly transformed fertile agricultural and forest lands into dense built-up areas. While infrastructure and socio-cultural opportunities improved, environmental quality and affordability declined sharply. GIS-based analysis highlights significant land use change between 1998 and 2017, with green spaces shrinking into grey zones. Future growth demands holistic, sustainable planning to balance development with ecological harmony and resident well-being. Agarwal, Sharma, & Kulkarni, et al. (2019) [3] . Access to electricity, water, sanitation, and clean fuel remains a decisive marker of urban quality in India. Large cities fare better in service delivery, though slum concentration lowers toilet and sanitation access. Regional disparities persist, with weaker states and small towns struggling due to limited financial autonomy. Without empowering local bodies and inclusive policies, urban growth risks deepening inequality in basic amenities. Bhagat, et al. (2011) [4] . Dehradun's urban area expanded 160% between 1987 and 2008, with rapid growth after becoming Uttarakhand's capital. The wind-rose analysis shows expansion strongest in the south, southeast, and southwest directions. Urban spread has extended from an 8 km to a 15 km radius, encroaching on fertile agricultural land and straining infrastructure. Sustainable planning and proactive management are crucial for balancing future growth with ecological and social needs. Gupta, et al. (2013) [6] . Dehradun's ward-level analysis reveals a severe urban green space crisis, with per-capita availability far below national standards. Immediate equity-focused planning and community-driven micro-park development are essential to restore livability and environmental justice. Kumar, Joshi, & Gogoi et al.(2025) [10 . Rapid, unplanned urbanisation in the Himalaya is intensifying ecological stress, resource depletion, and hazard vulnerability. While towns generate employment and services, they simultaneously disrupt forests, watersheds, and biodiversity. Climate change compounds risks by triggering slope instability and geo-hydrological extremes in fragile mountain ecosystems. Integrated urban-rural land use planning and participatory conservation frameworks are essential for sustainable Himalayan futures. Tiwari, Tiwari & Joshi et al. (2018) [7] [8,12] . The case of SCMC versus MDDA in the Doon Valley underscores the tension between civic activism and weak institutional enforcement in India's urban planning. Strengthening Urban Local Bodies, clarifying overlapping jurisdictions, and fostering participatory governance are essential to restore public trust and address the intertwined crises of democracy, environment, and urbanisation. Rawat, et al (2002) [2] . ADH households showed greater vulnerability than NDH households, reflecting disparities in infrastructure and livelihood settings. Combining traditional practices with modern facilities, stronger social networks, and financial capital can reduce vulnerability. Integrated policies that mainstream human, social, and financial assets are essential to build resilience in fragile Himalayan communities. Pandey, Jha, Alatalo, Archie, & Gupta, et al. (2017) [9] . Dehradun's wards face a critical green space deficit, with per-capita availability far below the national standard of 9 m²/person. Rapid urbanisation has reduced historic parks and tree cover, intensifying pollution, heat stress, and environmental injustice. Equity-based ward-level planning, micro-park creation, and community stewardship are essential to restore livability and resilience. Kumar, Joshi, & Gogoi, et al (2025) [11] . Rapid urban expansion from 2003 to 2023 has intensified land surface temperature and surface urban heat islands in Dehradun. Built-up areas show strong correlations with rising pollutants, especially nitrogen dioxide and formaldehyde, highlighting anthropogenic impacts. Sustainable urban planning and integrated management are essential to mitigate environmental health risks and ensure resilient urban futures. Dhankar, Singh, & Kumar et al(2024) [12] . Rising student migration has intensified demand for affordable, safe, and well-located housing, exposing gaps in current rental markets. Purpose-Built Student Accommodation (PBSA) offers a sustainable solution, balancing student needs with neighbourhood preservation. Adaptive density planning and inclusive policies are essential to foster vibrant, student-friendly urban environments in India's education hubs. Tiwari, & Roy,et al. (2025) [13] . The study of Dehradun and Haldwani reveals distinct urban sprawl dynamics shaped by geography and infrastructure. Dehradun expanded northeast, southeast, and southwest along major highways due to improved connectivity, while Haldwani's growth concentrated south and west, constrained by forests, hills, and the Gaula River. Bisht, Deepak, Lohani, Tiwari, Das, et al (2026) [5] . Rapid, unplanned urbanisation and narrow roads have heightened earthquake vulnerability in Dehradun, especially in the Dharampur ward. GIS and remote sensing provide crucial tools for identifying at-risk buildings and populations, enabling targeted mitigation strategies. Roy, et al. (2007) [14] . Intensive land use change in the fragile Indian Himalayan Region (IHR) has disrupted ecosystem health, reduced productivity, and heightened vulnerability to disasters. Unplanned construction, deforestation, soil degradation, and altered agriculture threaten food security and sustainability, demanding conservation-focused strategies for resilient socioeconomic progress. Borah, Rout, Nooruddin, et al (2025) [15] . Rapid, unplanned urbanisation in the Himalaya has intensified ecological degradation, disrupted watershed regimes, and heightened vulnerability to geo-hydrological hazards. Sustainable urban-rural land use planning, climate vulnerability mapping, risk zone analysis, and participatory water resource conservation are essential for resilient adaptation and balanced socio-economic progress. Tiwari, Tiwari, & Joshi, et al. (2018) [7] .
Study Area
Dehradun district, situated in the Garhwal Himalayas of Uttarakhand, extends between 29º58′-30º31′ N latitude and 77º 35 -78º19 ′ E longitude, encompassing an area of about 3,088 km² with its administrative headquarters at Dehradun city, the state capital. As per the Census of India (2011), the district has a population of 1,696,694, comprising 1,253,160 rural and 443,534 urban residents, with a density of 549 persons per km² and a decadal growth rate of 32.5%. Physiographically, Dehradun is marked by three distinct zones-the Shivalik Hills, the fertile Doon Valley, and the Himalayan ranges-where elevations vary from 400 m in the valley to over 2,700 m in the northern highlands. Extensive forest cover dominated by Sal, Teak, and Pine species contributes to biodiversity and ecological balance. The district experiences a humid subtropical climate with concentrated monsoon rainfall, while languages such as Hindi, Garhwali, Urdu, and English are widely spoken across rural and urban settlements
Approach
A mixed-methods framework was adopted, combining quantitative climatic data with qualitative household survey findings. Triangulation of evidence was used to strengthen validity, linking meteorological trends with household resilience strategies and urban amenity stress. Comparative analysis was conducted between flood years and drought years, rainfall variability and temperature rise, and correlation between Household Resilience Index (HRI) and Urban Amenities Index (UAI).
Results and Discussion
Source: India Meteorological Department (IMD) The decadal precipitation trend in Dehradun district from 1984 to 2024 reveals significant climatic variability, with rainfall consistently peaking in July across all decades, reflecting strong monsoon concentration. However, the magnitude of rainfall shows sharp fluctuations: extremely high values in 1984 and 1994 (above 600 mm), a marked decline in 2004 (around 260 mm), and renewed intensity in 2014 (over 570 mm), while 2024 indicates moderate rainfall. This alternating pattern of floodprone and drought-prone decades highlights the instability of the regional climate system. Such variability directly influences household resilience through water scarcity, flood damage, and livelihood stress, and places pressure on urban amenities, including drainage, transportation, and water supply infrastructure. The data used for this analysis were obtained from the Indian Meteorological Department (IMD) and supplemented with secondary sources, including Census of India reports and district statistical handbooks.
Source: India Meteorological Department (IMD) The monthly maximum temperature trends in Dehradun district from 1984 to 2024 reveal a consistent seasonal cycle, with temperatures rising steadily from January, peaking in May-June, and then declining toward December. Across decades, however, the magnitude of maximum temperatures shows a clear upward shift: in 1984, the peak was around 32-33 °C, rising to nearly 35 °C in 1994, further increasing to 37-38 °C in 2004, and reaching approximately 40 °C in 2014, before moderating slightly to 36-37 °C in 2024. This long-term warming trend highlights growing climatic stress in the region. The implications are significant, as rising maximum temperatures intensify heatwaves, increase health risks such as heatstroke and dehydration, and place additional pressure on urban amenities, including water supply, electricity demand, and public health infrastructure.
Source: India Meteorological Department (IMD) The decadal minimum temperature trends in Dehradun district from 1984 to 2024 show a consistent seasonal cycle, with values rising gradually from January, peaking around June-July, and then declining toward December. Across decades, however, the magnitude of minimum temperatures has steadily increased, indicating a trend of warming. In 1984, the winter months recorded minimum temperatures of around 5 °C,, while summer peaks reached 20 -22 °C. By 1994 and 2004, these values had risen further, with summer minima approaching 24 -25 °C. In 2014, the warming trend became more pronounced, with summer minima exceeding 26 °C, and even in 2024, the pattern remains elevated compared to earlier decades. This progressive rise in minimum temperatures highlights the phenomenon of night-time warming, which intensifies heat stress, reduces recovery periods during hot seasons, and places additional pressure on household resilience and urban amenities such as water supply, electricity demand, and healthcare services. The household survey of 300 respondents in Dehradun district reveals that the majority belong to the middle-aged group (59.33%), followed by the young (23.33%) and the old (17.33%), indicating that the active workforce dominates resilience decisions. Educational attainment is relatively high, with 36.67% graduates and another 26.67% having completed higher secondary, while only 10.66% are illiterate, suggesting better awareness and adaptive capacity. Family structures show a slight dominance of joint families (56.67%) over nuclear ones (43.33%), reflecting traditional social cohesion that supports resilience. Occupation patterns highlight agriculture as the primary livelihood (53.33%), but diversification is evident with 20% in service and 18.67% in business, showing urban influence and adaptation to climatic stress. Overall, the socioeconomic profile demonstrates that Dehradun households are moderately educated, largely agrarian, and socially cohesive, yet increasingly diversifying livelihoods to cope with climatic variability and urban challenges. 3 illustrates how climatic variability disrupts urban amenities in Dehradun, leading to long commute delays for 30%, which hampers economic activity. Drought years place immense pressure on water supply systems, with 50% of households reporting shortages and 40% facing demand-supply imbalances worsened by urban expansion. Healthcare accessibility gaps are evident, as 35% of households struggle with distance and overcrowding, while 25% experience disease outbreaks such as malaria, dengue, and diarrhoea. Education facilities are also vulnerable, with 30% of households reporting school closures during floods and droughts, and 20% noting infrastructure damage from waterlogging and cracks. Overall, the data highlights the multi-dimensional stress climatic events impose on urban systems, underscoring the need for resilient infrastructure and adaptive planning.
Flood Years vs Drought Years
Flood years create sudden shocks: housing damage, drainage overflow, transport disruption, and outbreaks of waterborne diseases. Fg.5 In contrast, drought years impose slow but persistent stress: water scarcity, crop failure, livelihood insecurity, and migration. Thus, floods primarily disrupt infrastructure and health systems immediately, while droughts steadily weaken livelihoods and water supply networks over time.
Rainfall Variability vs Temperature Rise
Rainfall variability directly drives floods and droughts, influencing water availability, agriculture, housing, and drainage systems. Temperature rise, on the other hand, intensifies heat stress, health risks, energy demand, and cold wave mortality. In Himalayan districts like Chamoli and Dehradun, rainfall variability has broader socio-economic consequences, while temperature rise exerts sharper impacts on health and energy. Overall, rainfall variability emerges as the dominant stressor, though temperature rise amplifies vulnerability.
Correlation between Household Resilience Index (HRI) and Urban Amenities Index (UAI)
The Household Resilience Index (HRI) reflects coping capacity in water, housing, health, food, and social support, while the Urban Amenities Index (UAI) measures infrastructure strength in drainage, water supply, healthcare, and education. Analysis shows a positive correlation: r(HRI, UAI) ≈ 0.65 This indicates that stronger urban amenities reduce household vulnerability, while resilient households depend less heavily on overstressed urban systems. Together, HRI and UAI reinforce each other, highlighting the need for integrated resilience planning.
conclusion
The findings reveal that Dehradun district faces pronounced climatic variability, with alternating decades of extreme rainfall and drought, rising maximum temperatures, and progressive night-time warming. These changes intensify household vulnerability and strain urban amenities, particularly water supply, healthcare, and transport systems. Floods cause immediate infrastructure disruption, while droughts impose long-term livelihood stress. Household resilience strategies such as migration, rainwater harvesting, and diversification were evident among the 300 surveyed households, and are reinforced by urban responses like relief camps and tanker supply. Importantly, the positive correlation between HRI and UAI (r ≈ 0.65) demonstrates that stronger urban infrastructure reduces household vulnerability, while resilient households ease pressure on urban systems. The study concludes that integrated resilience planning, combining socio-economic adaptation with infrastructural strengthening, is essential for sustainable urban and household resilience in Himalayan districts like Dehradun.
Figures and tables from the paper
| Attribute | categories | frequency | Percentage (%) |
|---|---|---|---|
| Age in years | Young (below 25) | 70 | 23.33 |
| Middle (25-45) | 178 | 59.33 | |
| Old (45 and above) | 52 | 17.33 | |
| Educational qualification | Illiterate | 32 | 10.66 |
| primary to metric | 78 | 26.00 | |
| metric to hr. secondary | 80 | 26.67 | |
| graduation | 110 | 36.67 | |
| Family type | Joint | 170 | 56.67 |
| nuclear | 130 | 43.33 | |
| Occupation | Agriculture. | 160 | 53.33 |
| Service. | 60 | 20.00 | |
| Business. | 56 | 18.67 | |
| Other. | 24 | 8.00 |
Table text extracted from the original PDF; superscript letters are shown inline. The original table image is below.
View original table image
| Indicator | Category | Hh (Out Of 300) | % | Notes |
|---|---|---|---|---|
| Drainage & Transport | Flood-related disruption | 135 | 45 | Roads blocked, drainage overflow |
| Long commute delays | 90 | 30 | Economic activity affected | |
| Water Supply Pressure | Drought years shortage | 150 | 50 | Tanker dependence, borewell stress |
| High demand vs low supply | 120 | 40 | Urban expansion worsens scarcity | |
| Healthcare Gaps | Access difficult | 105 | 35 | Distance >5 km, overcrowding |
| Disease outbreaks | 75 | 25 | Malaria, dengue, diarrhea | |
| Education Facilities | Schools closed (flood/drought) | 90 | 30 | Attendance drops |
| Infrastructure damage | 60 | 20 | Waterlogging, building cracks |
Table text extracted from the original PDF; superscript letters are shown inline. The original table image is below.
View original table image
References
15 in the original paper- Saini J, Shrivastava A, Dhupper R, Gupta AK. Climate vulnerability and resilience in Peri-urban settings of Dehradun city in Uttarakhand, India: spatio-temporal and perception analysis. Environment Conservation Journal. 2025;26(2).
- Rawat R. Governance and citizen intervention in urban planning processes of Dehradun, India. Urban Planning Processes. 2002.
- Agarwal B, Sharma A, Kulkarni S. Socio-economic impact assessment of city growth on residents of Dehradun, Uttarakhand, India. In: Proceedings of the International Conference of Architectural Science Association. 2019;41(50).
- Bhagat RB. Urbanisation and access to basic amenities in India. Urban India. 2011;31(1):1-13.
- Bisht H, Deepak L, Lohani R, Tiwari PC, Das A. Comparative Study with Urban Growth and Urban Sprawl: A Study of Dehradun and Haldwani City. In: Ghosh S, Mahalingam B, B C, V (eds). Geospatial Solutions for Ecological Challenges and Sustainability. Advances in Geographic Information Science. Springer, Cham; 2026.
- Gupta K. Unprecedented growth of Dehradun urban area: a spatio-temporal analysis. International Journal of Advancement in Remote Sensing, GIS and Geography. 2013;1(2):47-56.
- Tiwari PC, Tiwari A, Joshi B. Urban growth in the Himalaya: understanding the process and options for sustainable development. Journal of Urban and Regional Studies on Contemporary India. 2018;4(2):15-27.
- Kapruwan R, Saksham AK, Bhadoriya VS, Kumar C, Goyal Y, Pandey R. Household livelihood resilience of pastoralists and smallholders to climate change in Western Himalaya, India. Heliyon. 2024;10(2).
- Pandey R, Jha SK, Alatalo JM, Archie KM, Gupta AK. Sustainable livelihood framework-based indicators for assessing climate change vulnerability and adaptation for Himalayan communities. Ecological indicators. 2017;79:338-346.
- Kumar, A., Joshi, A., & Gogoi, H. Urban Green Spaces and Parks Contribution to Improving Livability: A Ward-Level Assessment Study of Dehradun, India. International Journal of Environmental Sciences, 11(4), 2025..
- Kumar A, Joshi A, Gogoi H. Urban Green Spaces and Parks Contribution to Improving Livability: A Ward-Level Assessment Study of Dehradun, India. International Journal of Environmental Sciences. 2025;11(4).
- Dhankar S, Singh G, Kumar K. Impacts of urbanisation on land use, air quality, and temperature dynamics in Dehradun district of Uttarakhand, India: a comprehensive analysis. Frontiers in Environmental Science. 2024;12:1324186.
- Tiwari D, Roy UK. Analysing Student Housing Preferences and Urban Impact in Dehradun, India. International Review for Spatial Planning and Sustainable Development. 2025;13(4):100-127.
- Roy DEBARTA I. Urban seismic risk assessment in Dehradun City using remote sensing and geoinformation techniques. Andhra University, M. Sc.; 2007.
- Borah D, Rout J, Nooruddin T. Impacts of Land Use Changes in the Indian Himalayas: A Socio-economic and Ecological Perspective. In: Borthakur A, Singh P (eds). People and Mountain Environments. Springer, Cham; 2025.