
Research article · 2026 · Full text
International Journal of Agriculture and NutritionData driven crop insurance model using ensemble learning and extreme risk analysis
Volume 8(7) · Pages 09–17 · DOI: 10.33545/26646064.2026.v8.i7a.667 ↗
Research areasAgricultural risk and resilienceClimate change impacts on agricultureSmart Agriculture and AI
Abstract
Author-writtenClimate has a significant effect on agriculture since farmers rely on rainfall, temperature, and water level to determine the yield of crops. The traditional crop insurance models tend to utilize few inputs and only single predictions thus dealing with the uncertainty and extreme conditions may be hard to manage, such as floods and droughts. This influences the calculation of premium, payouts and benefits to farmers. Moreover, the alteration of climatic conditions and unforeseeable weather patterns also expose farmers to more risk. Thus, the even more developed and validated prediction techniques are required to enhance the accuracy of insurance and promote the better decision-making in the field of agriculture. In order to enhance precision, the models used in this project include Extra Trees, Gradient Boosting and MLP with some other weather and seasonal attributes. CQR is applied to give prediction ranges, whereas Extreme event analysis is provided by Extreme Value Theory (EVT) and Generalized Pareto Distribution (GPD). R-Vine Copula (RVC) models interaction of weather variables, Hidden Markov Model (HMM) conditions of dry, normal, and wet, and Ridge Regression (RR) is the integration of various risks into one measure. In the workflow, data collection, feature engineering, model training, ensemble prediction, uncertainty analysis, stress testing, and Monte Carlo simulation are included. Findings indicate an increase in reliability with a lower RMSE of 3.2995e-04 and MAE of 2.4003e-04, and high adoption rates (up to 88.4) and premium forecasting to make good insurance decisions.
Summary
Source-checkedPlain-language reading of the full paper, prepared with AI and checked against the text. Each point links to the authors' own words.
Why it matters
- Agricultural yields are heavily dependent on climatic factors such as temperature, rainfall, and water levels. View evidence ↗
- Traditional crop insurance models often struggle with extreme weather events like droughts and floods because they rely on limited inputs and single-point predictions. View evidence ↗
- Changing climatic conditions and unpredictable weather patterns increase the overall risk exposure for farmers. View evidence ↗
The question
- The study aims to create a single pipeline that integrates uncertainty quantification, dependency modeling, and tail-risk characterization to improve crop insurance. View evidence ↗
What they did
- The framework was evaluated using three datasets: ERA5 climate data, historical crop yield data, and commodity crop price data. View evidence ↗
- The researchers used a stacked ensemble consisting of Extra Trees, Gradient Boosting, and a deep Multi-Layer Perceptron trained on 18 features. View evidence ↗
- Conformal Quantile Regression was employed to generate distribution-free prediction intervals to quantify uncertainty. View evidence ↗
- Extreme Value Theory using a Generalized Pareto Distribution with an automated cutoff was used to estimate tail risks for rare, high-severity events. View evidence ↗
- A four-state Hidden Markov Model was used to identify latent climatic regimes (wet, normal, dry, and transitional) based on Weighted Moving Average time series. View evidence ↗
What they found
- The proposed stacked ensemble achieved a Root Mean Square Error (RMSE) of 3.299e-04, a Mean Absolute Error (MAE) of 2.400e-04, and an R² of 0.9835. View evidence ↗
- The ensemble model outperformed the baseline Random Forest model, reducing the RMSE from 4.862e-04 to 3.299e-04. View evidence ↗
- The Conformal Quantile Regression achieved 91.5% empirical coverage on held-out data against a target of 90%. View evidence ↗
- Tail-risk analysis yielded a 99th-percentile Value-at-Risk (VaR) of 0.01292 m and a Conditional Value-at-Risk (CVaR) of 0.01466 m. View evidence ↗
- The R-Vine Copula identified a joint tail amplification factor of 4.9x, indicating that treating weather variables as dependent significantly changes risk estimates. View evidence ↗
- Across seven IPCC AR6 climate scenarios, the framework maintained a consistent hedging effectiveness of approximately 41%. View evidence ↗
- Stress testing showed that appropriate insurance premiums scaled from 298 to over 900 USD/ha/month as climate severity increased. View evidence ↗
What it means
- The authors conclude that accurate agricultural insurance pricing requires explicit modeling of variable dependence, tail behavior, and uncertainty rather than relying on point forecasts. View evidence ↗
- The study is limited by being tested on only one crop and geographic area, and the computational cost of HMM and vine copula fitting may hinder real-time scaling. View evidence ↗
Visual summary
1 visualsIllustrations explain the paper; they do not show study data.
Crop Insurance Pipeline Architecture
AI-generated conceptual illustration (Maize crops in a field). It explains the idea and does not show study data.
View source evidence ↗Figures & tables
From the original paper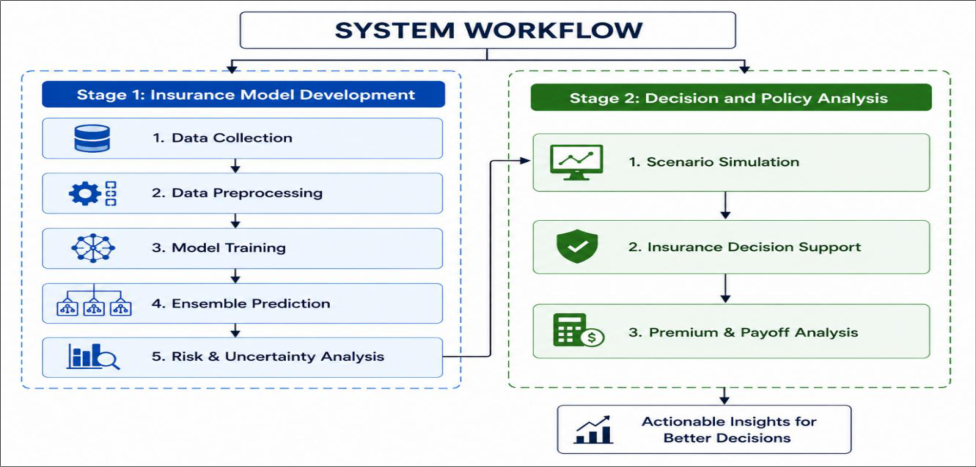 Figure 1
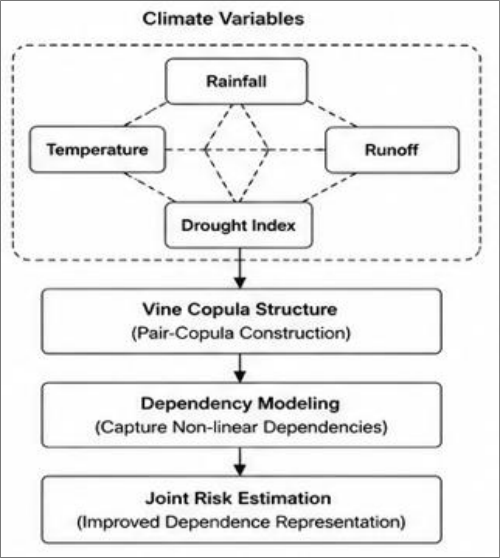 Figure 2
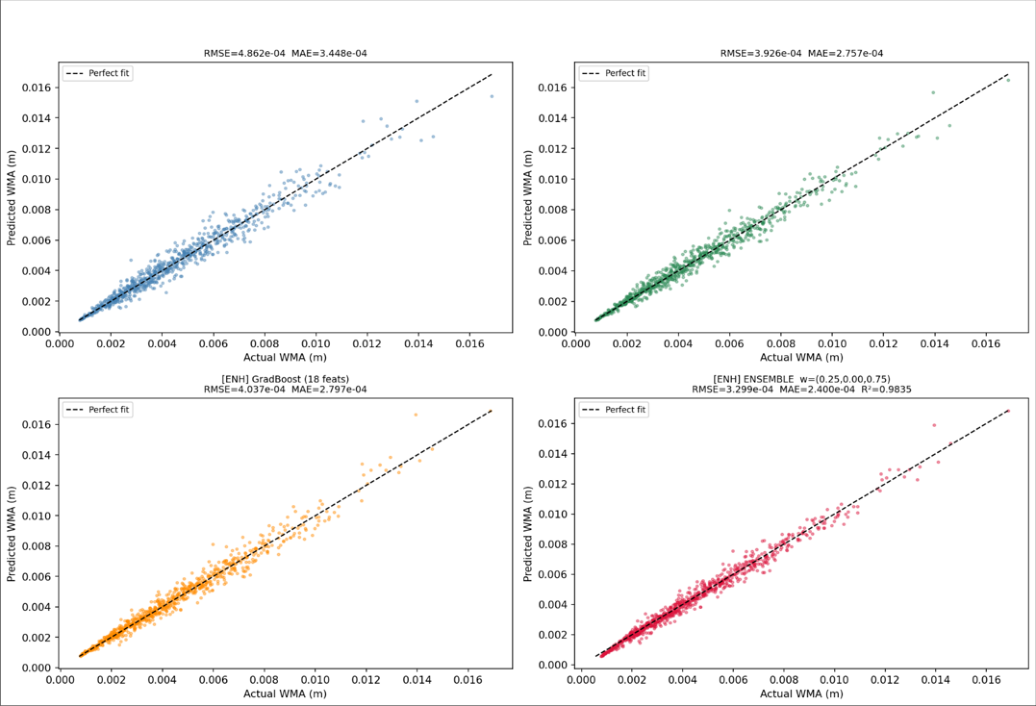 Figure 3
 Table 1
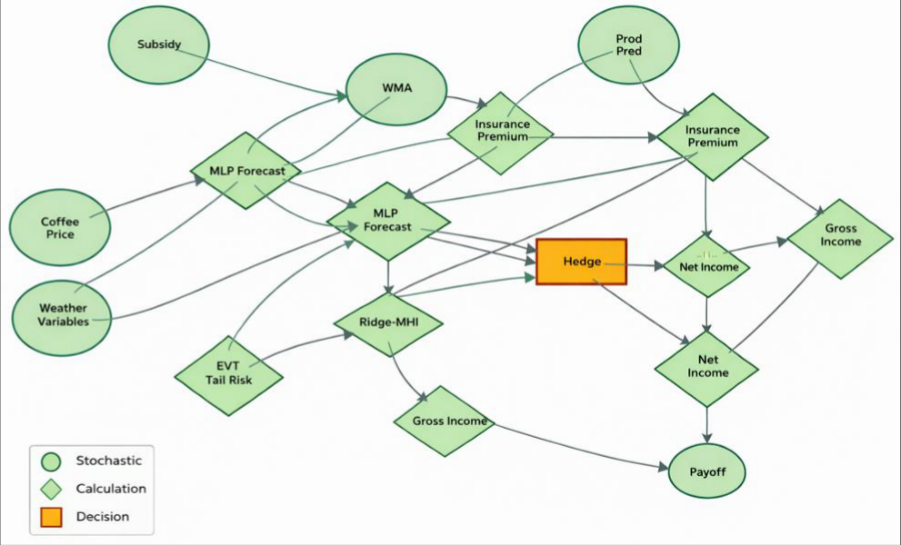 Figure 4
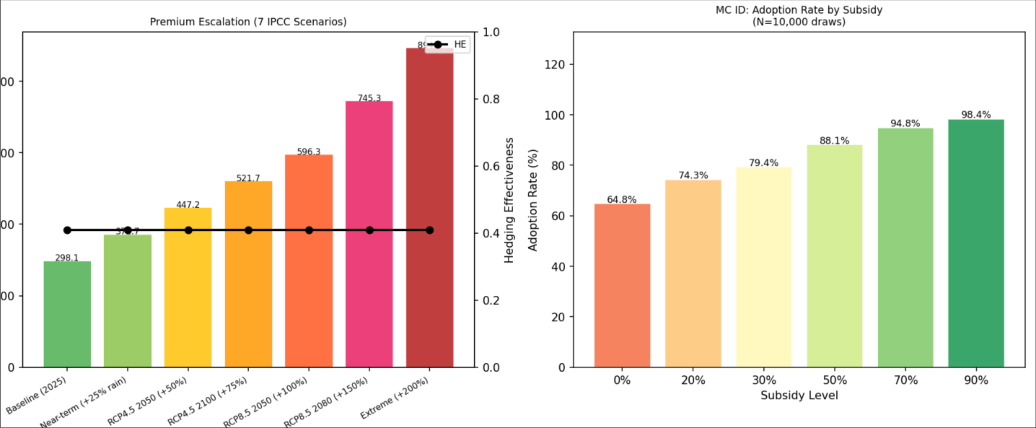 Figure 5
Introduction
Climate variability is increasingly becoming a threat to agricultural stability in the world and extreme impacts of rainfall deficits, heatwave, and floods are rapidly affecting the productivity of crops and livestock. Indemnity based insurance, relying on field level verification of losses, continues to be slow and costly to administer at scale [1] Weather index insurance (WII) was suggested as a solution to this issue as it bases payouts on an objective, verifiable climate index and not on the measured damage [2] . An expanding literature has used machine learning to enhance different elements of the WII pipeline. Crop-yield forecasting with ensemble and tree-based models have been found to be substantially better with vegetation-index and remote-sensing inputs [3] , and similar improvements have been reported with machine-learning-based methodology in place of traditional geostatistical methods in detecting weather-induced financial losses in spatial rainfall forecasting [5] Integration with lagged climate variables has been found to enhance the detection of weather-induced financial losses in the context of regional case studies in both insurance and agricultural prediction [5] , and analogous improvements have been reported in the case of multi-step model prediction [6] . Although these advances occurred, the majority of deployed systems are still based on one point-estimate model and do not pay much attention to three dimensions of risks that are interconnected. First, little systems quantify the confidence of their own forecasts, even though it has been demonstrated that explainable, uncertainty-conscious forecasting leads to better credibility in operational procedures like predicting heatwaves [7] Second, tail risk is commonly understated: ensemble-based drought-vulnerability indices have shown that uncommon, extreme events must be forecasted with specific statistical attention rather than mere extrapolation of more ordinary scales [8] a fact supported by specialized indices of early flash-drought detection [9] .Third, weather variables are often considered separately, although copula-based literature has repeatedly demonstrated that drought and rainfall-deficit indicators are strongly jointly dependent in agricultural risk situations [10] and specific studies have been done on exposure to flood and drought as a roadmap to simultaneously expose these hazards and mitigate combined risk [11] . Similar studies have also been conducted on alternative technological and economic drivers to enhance WII delivery and adoption. Architectures built on blockchain have been suggested to enhance supply chains of crop-index insurance based on transparency and settlement speed [12] and IoTbased integrated platforms with machine learning to facilitate finer-grained payout triggering [13] have been proposed. Regarding the adoption dimension, comparative research on crop and livestock insurance adoption has indicated that price accuracy and perceived reliability have a strong impact on whether farmers adopt such insurance schemes [14] and hybrid statistical-downscaling methods based on a combination of hidden Markov models and random forests have enhanced the accuracy of localised rain-forecasting in areas with sparsity of station data [15] .A recent systematic review of information-driven WII design further verifies that pricing, risk management, and model selection are still dynamic and unresolved research issues [16] . Developing these results, the framework proposed in this paper considers the three gaps which were highlighted above as uncertainty quantification, tail-risk characterization and dependency modeling as united within a single, straight pipeline as opposed to the current literature that has been discussing them as independent research threads. Precisionagriculture methods, in general, driven by AI, have demonstrated great potential in data-scarce agricultural decision-making [9] , and parameter-optimization investigations of WII demonstrate that machine-learningtuned designs can beat fixed statistical expressions [17] . Based on this, the following contributions are incorporated in the proposed framework: A stacked ensemble of Extra Trees + Gradient Boosting + deep Multi-Layer Perceptron, trained on 18-feature representation, which significantly extends the relatively small feature sets used in the previous WII forecasting literature. Conformal Quantile Regression to generate distribution-free prediction intervals, which are calibrated, to overcome the above-discussed confidence-estimation gap. Extreme Value Theory Direct Value-at-Risk estimation with an automated Generalized Pareto tail fit, which extends the tail-risks issues of drought-vulnerability modelling. A R-Vine Copula and Hidden Markov Model to jointly model the dependence of weather variables and latent climate regimes based on the dependency evidence found in copula-based drought modeling. A Multi-Hazard Index based on Ridge-regression, with stress testing in 7 IPCC AR6 scenarios and Monte Carlo integration of the adoption behavior at scale.
II. Literature Review
The weather index insurance (WII) literature shows a definite evolution of the past direction in which the forecastbased model of design has evolved into an integrated risk analytics model that employs machine-learning. The early literature suggests a forecast-based index model of weather index design specific to vulnerable economies [1] that defines the policy and pricing framework to be built upon by a significant portion of the later literature. Based on this, field-level validation shows that crop index insurance has a positive effect on climate resilience of smallholder farmers in Nigeria [2] or that index-based but not indemnity-based coverage is effective in resilience across agricultural supply chains when there is extreme weather risk [3] . Switching to policy rationale, much of a literature is dedicated to the enhancement of the data-driven construction of WII as such. A thorough overview synthesises the data-driven method to WII design, pricing, and risk management [5] and associated literature use machine learning and remote sensing as a specific parameter optimization tool [6] and to design cornyield protection models. A design layer atop this is the technological infrastructure, covered by a blockchain-based construction of crop index insurance, which enhances transparency and traceability along the agricultural supply chain [7] and a two-step copula-based model of flood and drought risk insurance under data-scarcity conditions [8] and a conditional drought copula of rainfed wheat yield comparing multiscalar drought indicators in the Tabriz region [9] . In addition to the insurance peculiar design, more general machine-learning applications inform the enabling analytics that are consumed by such structures. The analytical context is provided by a survey of AI use in precision agriculture [10] , and multi-step machine learning is demonstrated to enhance predictive performance when forecasting agricultural losses caused by extreme weather in the Delmarva Peninsula [11] and supervised learning algorithms are also demonstrated to enhance risk forecasting in the life insurance industry [13] with direct implications on agricultural underwriting. Building on this ensemble-based methodology, a drought vulnerability index pooling M5P, dagging, random sub-space, and rotation forest models attains excellent regional discrimination performance [14] and a new Standardized Precipitation Evaporation Differential Index is useful at detecting flash droughts in South Korea [15] . Explainable machine learning and remote sensing data are also extended to predict seasonal heatwaves [16] and to the integration of blockchain, IoT and machine learning to modernize the use of remote-sensing-integrated models in crop insurance delivery [17] to augment the predictive capabilities of either models. On the adoption side, the crop and livestock insurance adoption intensity has been studied in Mexico [19] and a hybrid statistical downscaling HMM-RF model improves rainfall prediction in Selangor [20] is part of the regime-conscious modeling branch of this literature. Lastly, economic-impact results of a field experiment in Mali have shown the ex-ante welfare effects of agricultural insurance on the production choices of farmers that take place prior to any payout being made [24] . Taken together this body of literature points to three common needs that have not yet been met adequately by any of these studies: quantifying uncertainty on a calibrated basis, tail-risk modelling of un-Common climatic events, joint dependence modelling of correlated weather hazards-the gap that is the focus of this work.
III. Proposed methodology A. System Overview
The weather index insurance scheme is deployed as a pipeline of modules that take raw climate data through six stages of preprocessing features, en-semble forecasting, uncertainty quantification, dependency and regime modelling and incorporating multi-hazard fusion to reach a final premium and hedging decision. Each of the stages will be structured as a stand-alone module such that the individual component can be improved or changed without affecting the overall workflow, and so that the contribution of each technique to the risk estimate at the end of it can be traced. The framework combines machine learning, statistical modeling, and risk analytics to both represent the common climate variability and extreme weather occurrences. Integrating predictive accuracy and uncertainty-aware forecasting, the system assists in more reliable insurance price and payout estimation. Additionally, the modular architecture also improves scalability and flexibility, allowing the framework to support new climate indicators, alternative forecasting models, and regionspecific risk factors as more data becomes available. This design ensures transparency, flexibility, and robustness in supporting weather-based insurance decision-making. Figure 1 illustrates the two-stage system workflow of this pipeline with climate data flowing through Stage 1 (model development) preprocessing, feature engineering, ensemble forecasting, uncertainty quantification, and risk and uncertainty analysis into Stage 2 (decision and risk fusion) which includes dependency and regime modeling, multihazard fusion, and stress testing, finally to the final premium and hedge decision output.
B. Dataset Description
Three combined datasets, namely the ERA5 climate dataset, which contains past rainfall, temperature, and weather data to make predictions and calculate risks, the crop yield dataset, which includes past agricultural production to measure crop losses due to the weather, and the crop price dataset, which includes past commodity market prices to compute the premium and make insurance decisions, are used to evaluate the proposed framework.
C. Climate Data Preprocessing
These observations of historical rainfall, temperature, runoff and drought conditions are cleaned and standardized to eliminate missing values and anomalies due to sensor gaps or station discontinuities. The step standardizes units among heterogeneous data sources, and generates a formatted dataset that can be used in further modeling. Continuous preprocessing at this point is not seen as add-on but as mandatory because, once a mistake is made here it would be reflected in every other module.
D. Feature Engineering
A four-variable representation of the data at the baseline is then expanded to an eighteen-feature representation by the creation of seasonal indicators and two-way interaction terms between the core climate variables.This growth is meant to reveal nonlinear seasonal effects e.g. the compounded effect of low precipitation over an already-dry seasonal window that cannot be reproduced by a small, unengineered feature set alone.
E. Ensemble Forecasting
The engineered feature set is learned on by three base learners: an Extra Trees regressor, a Gradient Boosting regressor, and a four-layer Multi-Layer Perceptron. The learners store varying degrees of the underlying data structure, and their combination has complementary advantages. Instead of choosing one most successful model, the framework stacks the results of all three learners.1) Feature Interaction: To create an interaction term, each pair of base climate features has an interaction term constructed as:
• 𝑥 𝑖 and 𝑥 𝑗 are fundamental weather conditions.
• 𝑥 𝑖𝑗 𝑖𝑛𝑡 indicates the interaction term that is computed on the 18-feature representation.
International Journal of Agriculture and Nutrition https://www.agriculturejournal.net
2) Ensemble Stacking: he overall prediction is based on the three base learners as:
Where: Y1, Y2, Y3 are the values of the predictions of the three separate models (Extra Trees, Gradient Boosting, MLP). w1, w2, w3 are the weights of prediction of each model. Y is the last combined ensemble prediction.
The pairwise interaction features produced in equation ( 1) help to identify nonlinear interactions among climate variables. The ensemble stacking process is described in equation ( 2) and here, the predictions of the Extra Trees, Gradient Boosting and MLP models are averaged together by using weights to enhance prediction accuracy and strength.Letting each make up what the other has weaknesses in. Differential Evolution is used to tune hyperparameters across the ensemble, instead of a localsearch algorithm like Nelder-Mead, because the expanded, eighteen-dimensional feature space presents a non-convex loss surface, which is better explored with a global-search approach. One point forecast does not give any clue as to the level of confidence to attach to it. To overcome this, Conformal Quantile Regression is applied to each ensemble, and generates prediction intervals with a coverage guarantee independent of distribution contrary to the prediction intervals generated by an assumed error distribution. This is practiced to reach around 91.5% empirical coverage on held-out data, which provides insurers with a defensible premise on conservative pricing of premiums under true uncertainty and not a single, possibly overconfident figure.
F. Conformal Quantile Regression to Uncertainty Quantification
With the help of the upper and lower quantile predictions, along with the score of conformity generated by the calibration, Equation (3) builds prediction intervals that consider the uncertainty in the forecasting. Those intervals provide a better depiction of risk compared to a single point estimate.
3) Conformal Prediction Interval: The calibrated interval is at a specified input:
Where: q lower(x) and q upper (x) are the lower and upper predictions of the quantiles at input x. Q is the calibration-set conformity-score quantile, which was calculated using residuals on some held-out calibration data.
G. Tail Risk: Extreme Value Theory
Since the losses incurred by insurance may be dominated by infrequent, extreme events as opposed to common conditions, the model generalizes a Generalized Pareto Distribution to excesses above an automatically determined cutoff, not a fixed, manually selected cutoff. The tail model is then employed to estimate Value-at-Risk at long return periods to enable the system to describe low probability, high severity droughts and floods in the same rigor as the ordinary forecasting, which a point estimate model cannot do by design.
H. Dependency Modeling using R-Vine Copula
Weather hazards are not generally independent; a drought spells, say, is usually associated with low soil moisture and high deficits of runoff. The framework, as shown in the figure 2, models this joint behavior with an R-Vine Copula structure fitted between the weather-moisture-area (WMA) indicator and precipitation, with the choice of Gaussian paircopula families chosen to fit the dependence structure as observed. The resulting dependency value is not dropped after fitting but instead progressed to the multi-hazard fusion stage hence the final risk score is the reinforcement of the hazards by each other and not independent of each variable.
K. Stress Testing and Monte Carlo Simulation
The total pipeline is then tested considering seven climatestress cases across IPCC AR6 pathways, with a near-term moderate rainfall anomaly up to end-of-century RCP4.5 and RCP8.5 pathways and an extreme warming scenario. A 10,000-draw Monte Carlo simulation is matched to each scenario, to model the uncertainty in the behavior of farmers in terms of adoption and payout results, in uncertain future conditions. This phase of stress testing confirms the sanity of the frameworks premium and hedging-effectiveness outputs as the severity of climate increases, not just under one fixed assumption. The framework estimates performance over a wider range of scenarios instead of a deterministic environment, thus offering a more accurate representation of the performance of the insurance product in the conditions of the real future climate uncertainty.
IV. Results
The presented framework was tested in terms of three integrated datasets, the ERA5 climate dataset, a historical crop yield dataset, and a crop price dataset that were preprocessed and featured engineered into a single set of climate and risk-relevant features. The stacked ensemble proposed had a RMSE of 3.299 x 10 952 -4 and a MAE of 2.400 x10 952 4 and R2 of 0.9835 which points to a good fit between the predicted and observed weather-moisture-area values.
Figure 3 presents the scatter plots of the predicted and actual values of WMA through four models, i.e. the baseline RF (4 features), and three better models with 18 features Extra Trees, Grad Boost, and an optimized ensemble blend. All the panel diagrams plot points on a diagonal of a perfect fit, and the ensemble model has the lowest clustering and best fit (RMSE=3.299e-04, R2=0.9835) of all against the baseline RF (RMSE=4.862e-04 The calibration of Conformal Quantile Regression using a 90% desired coverage of target data resulted in 91.5% empirical coverage of held out data, again showing that the constructed prediction intervals are not arbitrary but rather statistically sound. The EVT-based value-at-risk analysis of rare and severe weather events gave a 99 th -percentile Value-at-Risk of 0.01292 m and corresponding Conditional Value-at-Risk of 0.01466 m whereby CVaR is significantly larger than VaR. The Bayesian Information Criterion of model selection found four possible climate regimes as the best explanation of underlying weather dynamics, the first of stable normal conditions and the last of extreme dry/wet conditions. This form of regime is the input to the Ridge-regression-based Multi-Hazard Index, which combines rainfall, temperature, runoff, and drought signals into one composite score, and has a correlation of 0.9999 with the underlying WMA signal and also takes the extra riskdimensions provided by the EVT, copula, and HMM modules. The fact that the R-Vine AIC of -11795.3 and the joint tail amplification factor of 4.9x are consistent with the idea that the choice of whether to treat weather variables as dependent or independent variables can significantly alter the risk exposure estimate, supports the use of the copulabased dependency structure as a necessary part of the overall pipeline and not an optional improvement. Thus, they capture the variability and uncertainty of the future climate conditions. The framework can assess how sensitive the premiums, payouts and hedging strategies are to varying risk levels by running 10,000 simulation runs that offer a more holistic evaluation of insurance performance in normal and extreme weather conditions. Figure 5 The proposed framework demonstrated a steady and better result on all the dimensions compared to the baseline Random Forest model with RMSE and MAE growth of 32.1% and 30.4% respectively, and an R2 of 0.9835. Conformal Quantile Regression provided an empirical coverage of 91.5% and an Extreme Value Theory estimate of a 99th-percentile VaR of 0.01292 m, and the R-Vine Copula provided a joint tail amplification of 4.9x -functions that the baseline completely failed. The Hidden Markov Model was employed to identify four best climate regimes and the Multi-Hazard Index that was built using Ridgeregression was able to combine all risk signals into one single premium-relevant score. The scaling up of the appropriate premiums between 298 to more than 900 USD/ha/month and the maintenance of the hedging effectiveness of 0.41 in the stress test among seven IPCC AR6 scenarios showed that the framework retains the protective value in adverse climate conditions and offers a sound basis of data-driven insurance-of-agricultural pricing.
V. Conclusion
The paper introduced a data-driven weather index insurance platform merging stacked ensemble forecasting, conformal uncertainty quantification, extreme value tail-risks structure, R-Vine copula dependency structure, Markov, hidden regime identification and Ridge-regression-based multihazard fusion into a single pipeline, which is modular. A combination of feature engineering and ensemble learning was run on historical climate, crop yield, and commodity price data to enhance the accuracy of predictions, and Conformal Quantile Regression provided calibrated uncertainty intervals and Extreme Value Theory described rare, high-severity climatic events that are not adequately captured by conventional point-forecast models.
The experiments indicated that the suggested ensemble produced significantly lower forecasting errors compared to the individual baseline models with an RMSE of 3.299 x 10 -4 and R2 of 0.9835 and the conformal prediction framework produced 91.5% empirical coverage with a 90% target -indicating that the uncertainty estimates produced by the system are not arbitrary values. Multi-hazard-Indexing Tail-risk analysis with EVT and regime detection with HMM again risk-characterization information can be offered by a single-model baseline, but the resulting multi-hazard index stress-tested across seven IPCC AR6 climate scenarios, under which the framework retained a consistent hedging effectiveness of about 41% despite increasing climate severity.
To the extent that they add up, these findings justify the more general finding that sufficient prices in agricultural insurance involve explicit modeling of uncertainty, tail behavior, and the dependence of variables other than the point forecast. The modular nature of the framework also implies that the separate parts can easily be made/unmade without affecting the remainder of the pipeline in case improved forecasting or risk-modeling methods are discovered. Certain limitations remain. The quality and completeness of historical climate, yield and price data contributes to the performance of the system and extreme weather occurrences are not necessarily governed by historical statistical extremes, which may influence the accuracy of the forecasts in such unprecedented circumstances. The framework has been tested on one geographic area and crop scenario, and computationally expensive components like the vine copula and HMM fitting can be a limitation to real-time implementation at scale. Future directions include the use of real-time data in weather stations, satellite monitoring, and IoT sensors; developing the dependency model to higher-dimension vine frameworks to include additional climate variables; testing the framework on various crops and regions; and developing dynamic frameworks of premium-adjustment, responding automatically to changes in environmental conditions.
VI. Future Enhancements
It is also possible to extend the suggested framework by adding the real-time climate data retrieved through the weather stations, satellite observations, and monitoring systems based on the IoT. More sophisticated deep learning also like LSTM, Transformer and hybrid neural networks may be investigated to enhance the accuracy of long-term weather predictions. It can also be observed in the future that the mechanisms of dynamic premium adjustment will be investigated which will automatically adjust to changing environmental conditions. The model can be scaled by adding a variety of crops, regions, and insurance products by calibrating risks at the region level. The connection to blockchain technology has the potential to enhance transparency and streamline settlement claims. Furthermore, integrating socioeconomic and data on farmer behavior would allow more tailored insurance advice, and enhance climate-adaptation measures in the agricultural industry.
Figures and tables from the paper
| S.No | Scenario | Rainfall Anomaly | Premium (USD/ha/mo) | Hedging Effectiveness (HE) |
|---|---|---|---|---|
| 1 | Baseline (2025) | ~300 | 0.41 | |
| 2 | Near-term | +25% | ~375 | 0.41 |
| 3 | RCP4.5 (2050) | +50% | ~450 | 0.41 |
| 4 | RCP4.5 (2100) | +75% | ~525 | 0.41 |
| 5 | RCP8.5 (2050) | +100% | ~600 | 0.41 |
| 6 | RCP8.5 (2080) | +150% | ~750 | 0.41 |
| 7 | Extreme | +200% | ~900+ | 0.41 |
Table text extracted from the original PDF; superscript letters are shown inline. The original table image is below.
View original table image
References
26 in the original paper- Wang X, Wu J. Coping With Extreme Weather Risks: Implications of Insurance Innovation and Subsidies in Agricultural Supply Chains. IEEE Trans Eng Manag. 2026;73:418-431. DOI: 10.1109/TEM.2025.3634149.
- Abrego-Perez AL, Nuñez-Mora JA. Climate risk, policy, and insurance: a forecast-based model for weather index design in vulnerable economies. International Economics and Economic Policy. 2026 Feb;23(1). DOI: 10.1007/s10368-025-00695-3.
- Aina I, Ayinde O, Thiam D, Miranda M. Crop index insurance as a tool for climate resilience: lessons from smallholder farmers in Nigeria. Natural Hazards. 2024 Mar;120(5):4811-4828. DOI: 10.1007/s11069-02306388-x.
- Nobrega AEL, Barroca Filho IM. Analysis of Machine Learning Performance in Spatial Interpolation of Rainfall Data. IEEE Access. 2025;13:84727-84737. DOI: 10.1109/ACCESS.2025.3569261.
- Nourali Z, Shortridge JE. Predicting the impact of extreme weather on agricultural losses in the Delmarva peninsula using multi-step machine learning and financial crop loss data. Stochastic Environmental Research and Risk Assessment. 2026 Jan;40(1). DOI: 10.1007/s00477-025-03157-z.
- Boodhun N, Jayabalan M. Risk prediction in life insurance industry using supervised learning algorithms. Complex & Intelligent Systems. 2018 Jun;4(2):145-154. DOI: 10.1007/s40747-018-0072-1.
- Kan JC, Vieira Passos M, Destouni G, Barquet K, Ferreira CSS, Kalantari Z. Seasonal heatwave forecasting with explainable machine learning and remote sensing data. Stochastic Environmental Research and Risk Assessment. 2025 Aug;39(8):33333352. DOI: 10.1007/s00477-025-03020-1.
- Saha S, Kundu B, Paul GC, Pradhan B. Proposing an ensemble machine learning based drought vulnerability index using M5P, dagging, random sub-space and rotation forest models. Stochastic Environmental Research and Risk Assessment. 2023 Jul;37(7):25132540. DOI: 10.1007/s00477-023-02403-6.
- Kang S, Kim HJ, Lee JH, Yoon HC, Kwon HH. Introducing a novel Standardized Precipitation Evaporation Differential Index (SPEDI) for improved flash drought detection and assessment: a case study in South Korea. Stochastic Environmental Research and Risk Assessment. 2025 Nov;39(11):5601-5624. DOI: 10.1007/s00477-025-03092-z.
- Khaledi-Alamdari M, Fakheri-Fard A, Mirabbasi R, Russo A, Majnooni-Heris A. Conditional drought risk of rainfed wheat yield through copula analysis: comparison between two multiscalar drought indicators in the Tabriz region, Iran. Stochastic Environmental Research and Risk Assessment. 2025 Jul;39(7):28432857. DOI: 10.1007/s00477-025-02995-1.
- Abrego-Pérez AL, Boonman TM, Valencia Arboleda CF. Index insurance for simultaneous flooding and drought risks with insufficient data: a two-step approach. Stochastic Environmental Research and Risk Assessment. 2025 Jul;39(7):2769-2788. DOI: 10.1007/s00477-025-02966-6.
- Omar IA, Jayaraman R, Salah K, Hasan HR, Antony J, Omar M. Blockchain-Based Approach for Crop Index Insurance in Agricultural Supply Chain. IEEE Access. 2023;11:118660-118675. DOI: 10.1109/ACCESS.2023.3327286.
- Padwal S, Sattur S, Shinde A, Tekade P, Salunke D, Rangdale S. Modernizing Agriculture with Real-Time Crop Insurance: Leveraging Blockchain, IoT, and Machine Learning. In: 2024 IEEE International Conference on Blockchain and Distributed Systems Security (ICBDS); 2024; Institute of Electrical and Electronics Engineers Inc. DOI: 10.1109/ICBDS61829.2024.10837140.
- Mazviona B, Sølvsten S, Palwishah RI. Intensity of crop and livestock insurance adoption: lessons from Mexico. Mitig Adapt Strateg Glob Chang. 2025 Dec;30(8). DOI: 10.1007/s11027-025-10265-2.
- Sani NHM, Shaharudin SM, Ibrahim MS, Lall U, Tan ML. Integrating a hybrid statistical Downscaling-based HMM-RF model for enhanced rainfall prediction in Selangor. Stochastic Environmental Research and Risk Assessment. 2025 Dec;39(12):6001-6018. DOI: 10.1007/s00477-025-03103-z.
- Wijesena SB, Pradhan B. Advancements in Weather Index Insurance: A Review of Data-Driven Approaches to Design, Pricing and Risk Management. Earth Systems and Environment. 2025 Sep;9(3):2355-2379. DOI: 10.1007/s41748-025-00712-0.
- Wijesena S, Pradhan B. Weather index insurance parameter optimisation using machine learning and remote sensing data. In: 2024 International Conference on Machine Intelligence for GeoAnalytics and Remote Sensing (MIGARS); 2024; Institute of Electrical and Electronics Engineers Inc. DOI: 10.1109/MIGARS61408.2024.10544637.
- Ashfaq M, Khan I, Alzahrani A, Tariq MU, Khan H, Ghani A. Accurate Wheat Yield Prediction Using Machine Learning and Climate-NDVI Data Fusion. IEEE Access. 2024;12:40947-40961. DOI: 10.1109/ACCESS.2024.3376735.
- Swain KP, Mohapatra SK, Sahoo SK. Enhancing predictive modeling across industries with automated machine learning: applications in insurance and International Journal of Agriculture and Nutrition https://www.agriculturejournal.net agriculture. Discover Sustainability. 2025 Dec;6(1). DOI: 10.1007/s43621-025-00965-9.
- Hott C, Regner J. Weather extremes, agriculture and the value of weather index insurance. GENEVA Risk and Insurance Review. 2023 Sep;48(2):230-259. DOI: 10.1057/s10713-023-00081-6.
- Gupta G, Kumar Pal S. Applications of AI in precision agriculture. Discover Agriculture. 2025 Apr;3(1). DOI: 10.1007/s44279-025-00220-9.
- Xiu-min L, Fa-chao L. Extreme value theory: An empirical analysis of equity risk for Shanghai stock market. In: Proceedings of the 2006 International Conference on Service Systems and Service Management (ICSSSM); 2006; Troyes, France. p. 1073-1077. DOI: 10.1109/ICSSSM.2006.320657.
- Jensen V, Bianchi FM, Anfinsen SN. Ensemble conformalized quantile regression for probabilistic time series forecasting. IEEE Transactions on Neural Networks and Learning Systems. 2024 Jul;35(7):90149025. DOI: 10.1109/TNNLS.2022.3217694.
- Ahmad S, Agarwal A, Ansari H. Prediction of insurance premium using machine learning with an adaptive approach. In: Proceedings of the 2023 14th International Conference on Computing Communication and Networking Technologies (ICCCNT); 2023; Delhi, India. p. 1-5. DOI: 10.1109/ICCCNT56998.2023.10307009.
- Elabed AH, Carter MR. Ex-ante impacts of agricultural insurance: Evidence from a field experiment in Mali. American Journal of Agricultural Economics. 2015 Jan 5;97(2):530-545. DOI: 10.1093/ajae/aau104.
- Balakrishnan TS, Krishnan P, Ebenezar US, Mohammed Nizarudeen M, Kamal N. Machine Learning for Climate Change Impact and Adaptation Planning. In: TQCEBT 2024 -2nd IEEE International Conference on Trends in Quantum Computing and Emerging Business Technologies; 2024; Institute of Electrical and Electronics Engineers Inc. DOI: 10.1109/TQCEBT59414.2024.10545291.