
Research article · 2026 · Full text
International Journal of Advanced Chemistry ResearchDevelopment of functionalized MWCNT-Nafion modified glassy carbon electrode as a sensor for electrochemical studies and voltammetric determination of melphalan, based on improved kinetic parameters
Volume 8(6) · Pages 55–67 · DOI: 10.33545/26646781.2026.v8.i6a.688 ↗
Research areasElectrochemical sensors and biosensorsElectrochemical Analysis and ApplicationsElectrocatalysts for Energy Conversion
Abstract
Author-writtenA simple, fast, sensitive and validated voltammetric method was developed to study redox behavior, electrode kinetics, redox mechanism and for determination of melphalan. Cyclic voltammetry (CV) and differential pulse voltammetry (DPV) techniques were performed for voltammetric studies of melphalan using functionalized multiwalled carbon nanotubes-Nafion modified glassy carbon electrode (f-MWCNT-Nafion/GCE). Obtained results were compared with bare glassy carbon electrode (GCE). A sharp oxidation peak was obtained in anodic direction at a potential of 0.821 V versus Ag/AgCl in Britton-Robinson (BR) buffer of pH 7.2. Absence of peak in reverse scan suggested the irreversible nature of oxidation process. Rise in diffusion coefficient and heterogeneous rate constant prove the catalytic activity of f-MWCNT. Furthermore, under optimized conditions peak current linearly increased from 1.7 × 10⁻⁸ M to 3.9 × 10⁻⁷ M concentration of melphalan with the limit of detection (LOD) and limit of quantification (LOQ) 1.95 × 10⁻⁹ and 1.3 × 10⁻⁸ respectively. The developed method was successfully applied for the determination of drug in bulk, pharmaceutical formulation and in serum sample.
Summary
Source-checkedPlain-language reading of the full paper, prepared with AI and checked against the text. Each point links to the authors' own words.
Why it matters
- Melphalan is an alkylating agent used as an antineoplastic drug to treat breast and ovary carcinomas, as well as multiple myeloma. View evidence ↗
The question
- The study aims to develop a fast, low-cost, and sensitive differential pulse voltammetric (DPV) method using a functionalized multiwalled carbon nanotubes-Nafion modified glassy carbon electrode (f-MWCNT-Nafion/GCE) to determine melphalan. View evidence ↗
What they did
- Voltammetric measurements were conducted using a three-electrode cell consisting of a glassy carbon working electrode, a platinum wire auxiliary electrode, and an Ag/AgCl reference electrode. View evidence ↗
- Functionalized MWCNTs were prepared by sonicating 4 mg of inactive MWCNTs in a 1:3 mixture of HNO3 and H2SO4 for 2 hours. View evidence ↗
- The glassy carbon electrode was modified by applying an optimized volume of 15 µL of the f-MWCNT suspension and drying it at room temperature. View evidence ↗
What they found
- The modified electrode (f-MWCNT-Nafion/GCE) shifted the oxidation peak of melphalan to a lower potential of 0.821 V compared to 0.866 V for the bare GCE. View evidence ↗
- Modification increased the effective surface area of the electrode from 0.0541 cm² (bare GCE) to 0.0982 cm² (f-MWCNT-Nafion/GCE). View evidence ↗
- The optimal pH for the voltammetric study was determined to be 7.2, where the peak current and sharpness reached their maximum. View evidence ↗
- The method demonstrated high accuracy with a mean recovery of 99.96 ± 0.0027% for bulk melphalan. View evidence ↗
- The method is specific, as 100-fold excess concentrations of common excipients like starch, glucose, and NaCl did not interfere with the signal. View evidence ↗
What it means
- The authors conclude that this simple and economical method is a viable alternative for melphalan determination in pharmacokinetic studies and quality control laboratories. View evidence ↗
Visual summary
3 visualsIllustrations explain the paper; charts are replotted from the paper's own table values.
Electrode Modification Concept
AI-generated conceptual illustration (glassy carbon electrode modified with multi-walled carbon nanotubes and Nafion polymer). It explains the idea and does not show study data.
View source evidence ↗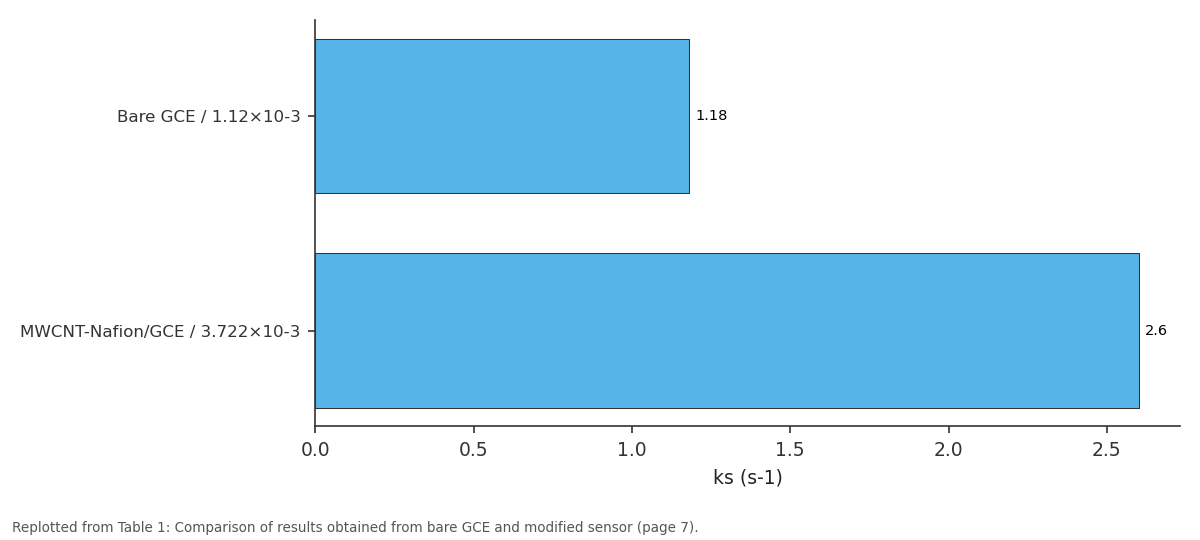
ks (s-1): Bare GCE / 1.12×10⁻³ vs MWCNT-Nafion/GCE /...
Replotted from Table 1 (page 7) of the original paper. Every bar is the paper's own table value.
View source evidence ↗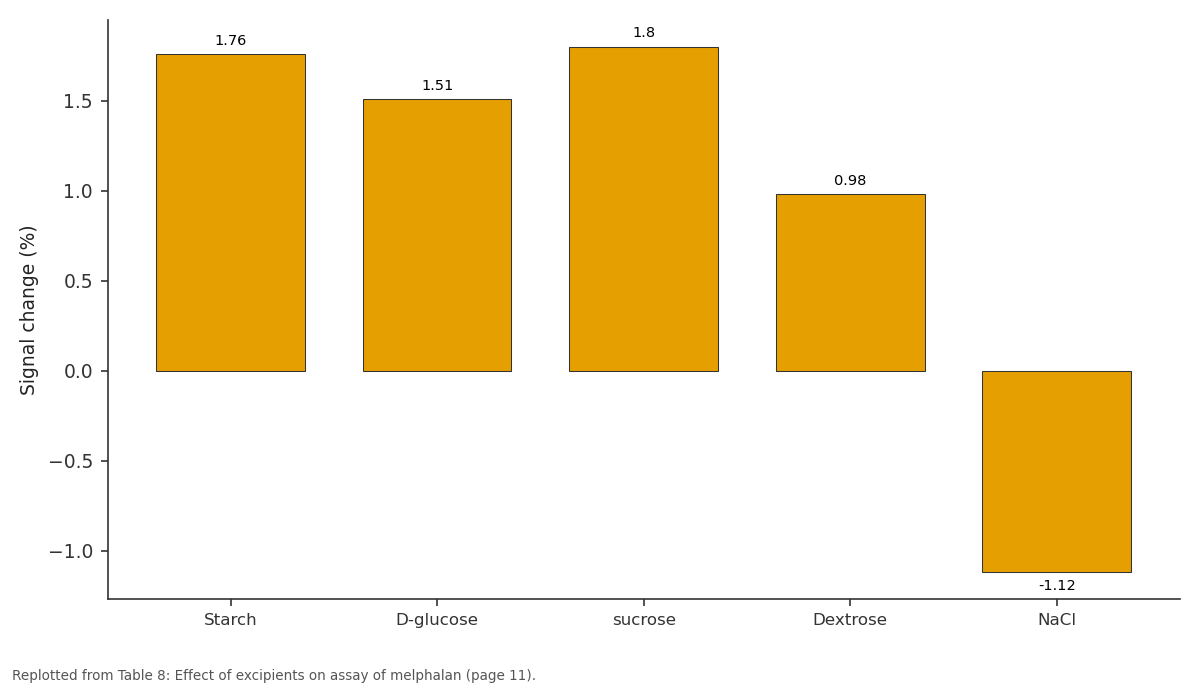
Signal change (%): Starch vs D-glucose vs sucrose vs Dextrose vs NaCl
Replotted from Table 8 (page 11) of the original paper. Every bar is the paper's own table value.
View source evidence ↗Figures & tables
From the original paper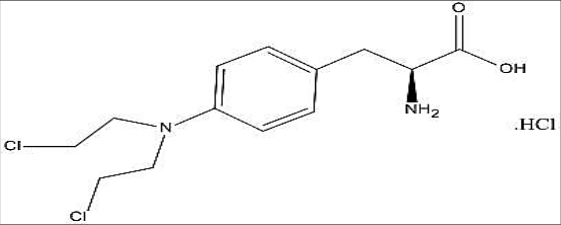 Figure 1Page 1
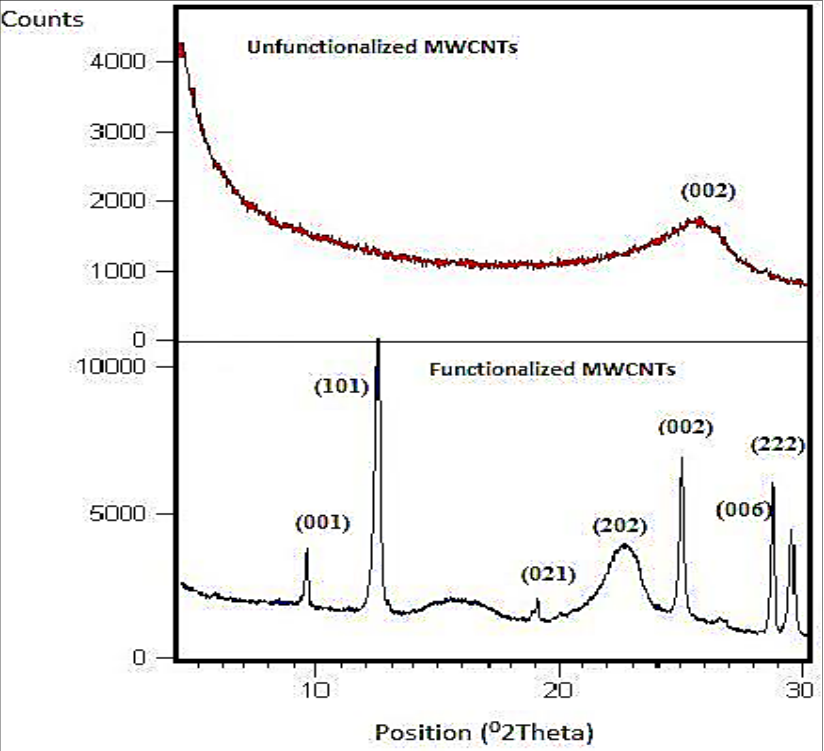 Figure 2Page 3
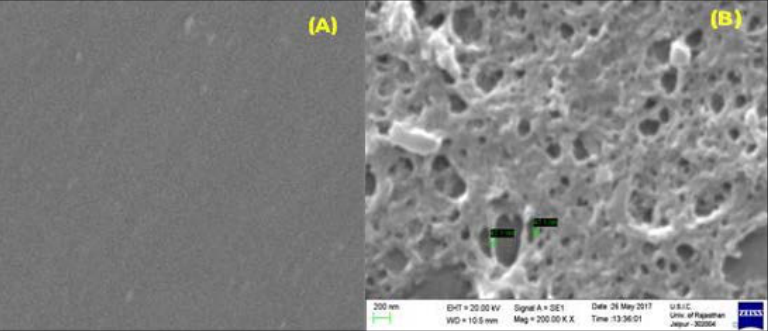 Figure 3Page 4
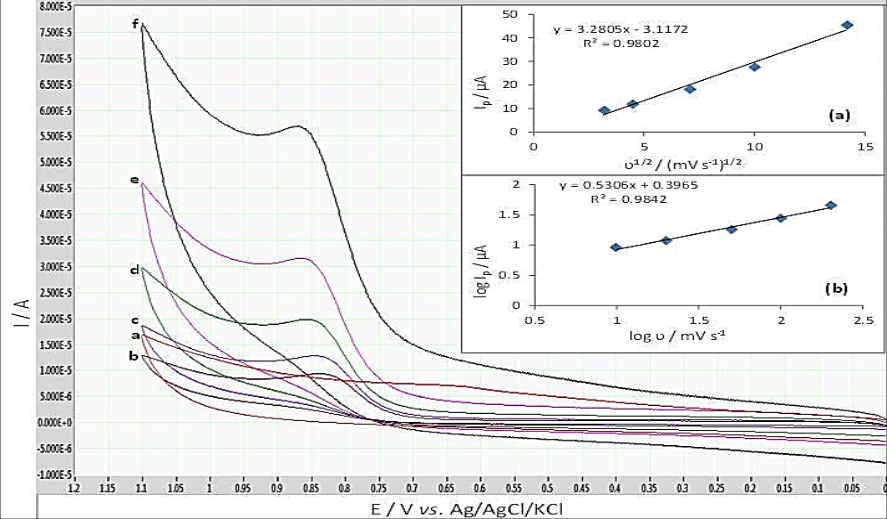 Figure 4Page 4
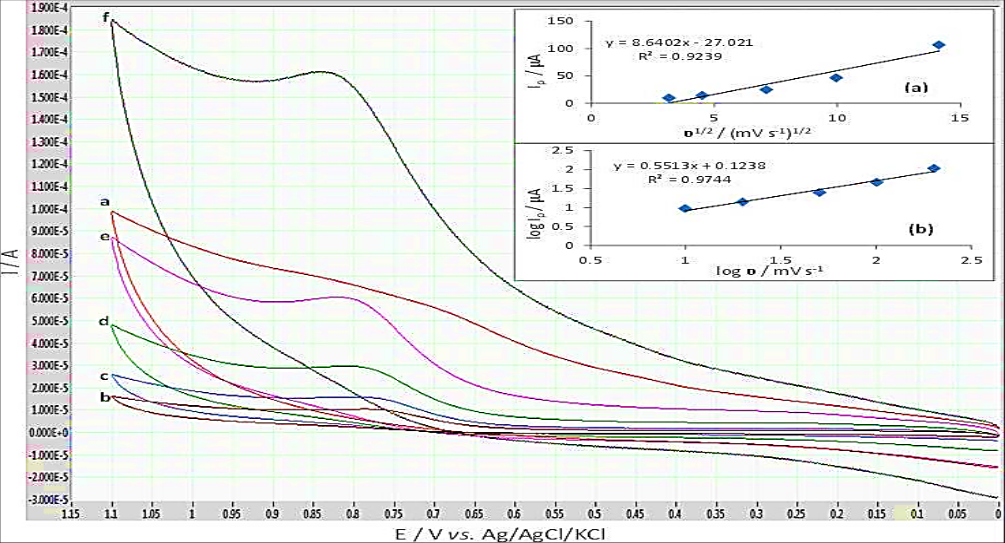 Figure 5Page 5
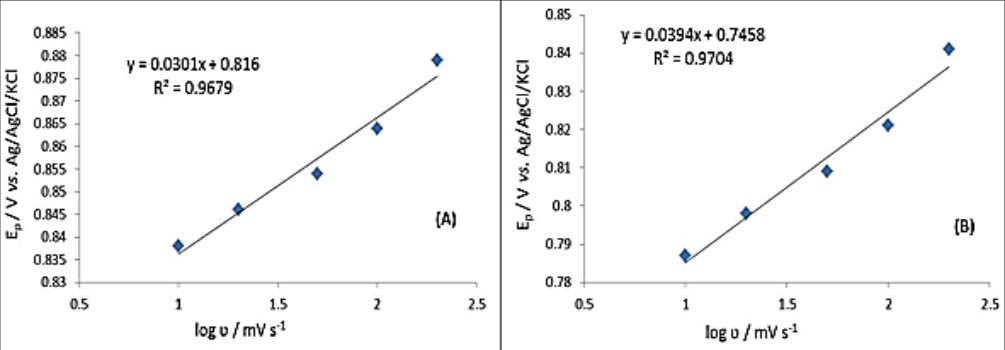 Figure 6Page 6
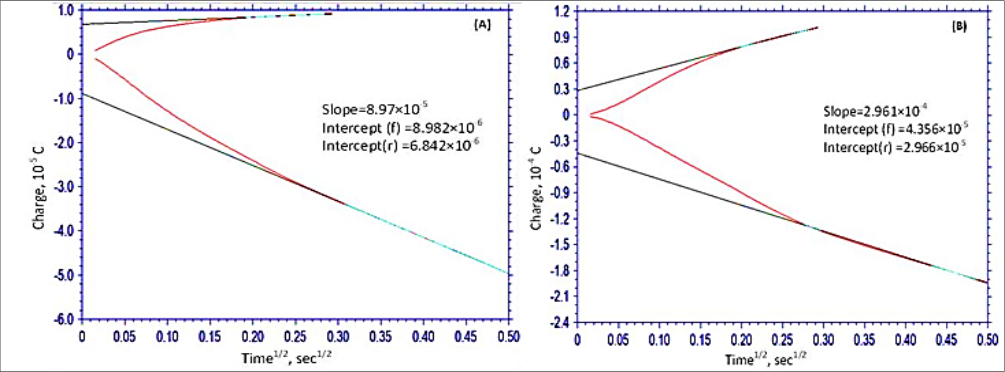 Figure 7Page 6
 Table 1Page 7
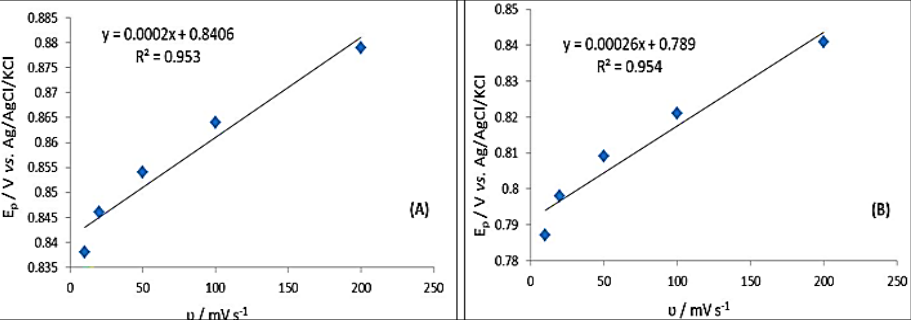 Figure 8Page 7
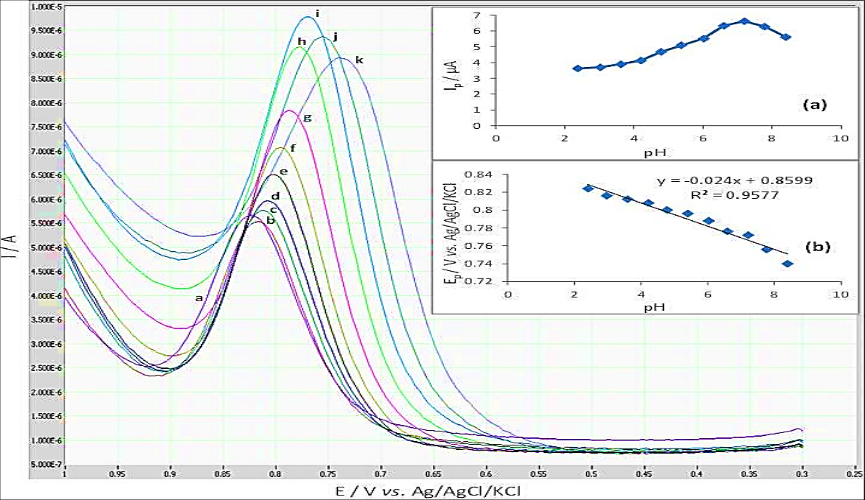 Figure 9Page 7
 Table 2Page 9
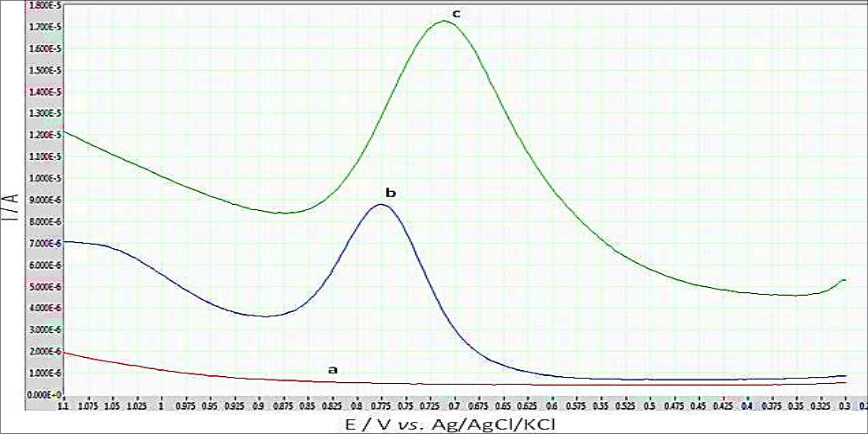 Figure 10Page 9
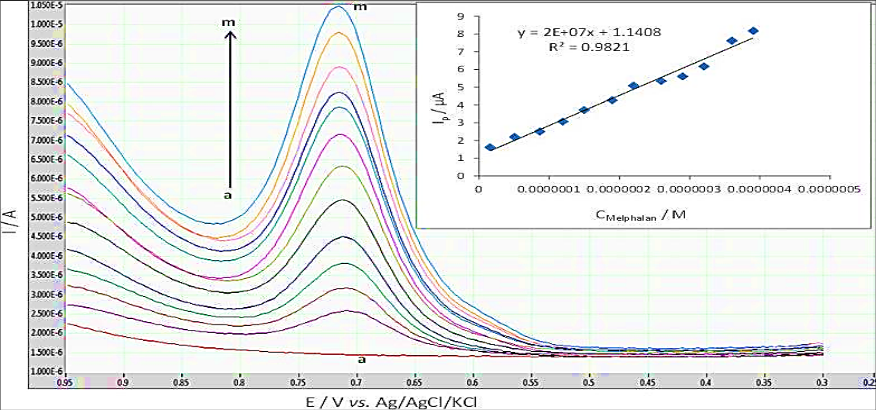 Figure 11Page 9
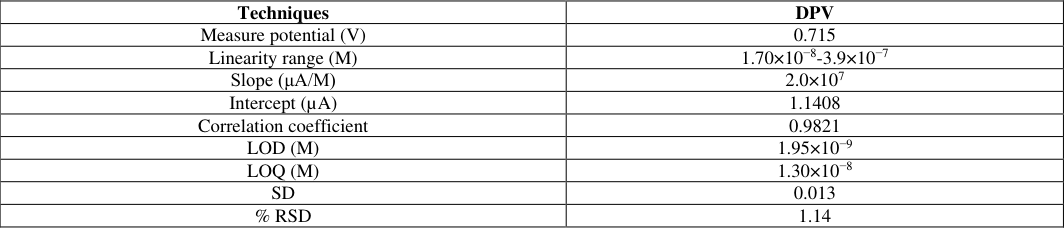 Table 3Page 10
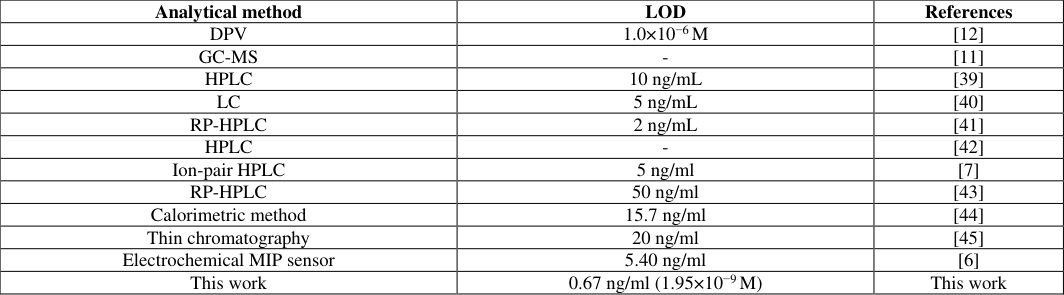 Table 4Page 10
 Table 5Page 10
 Table 6Page 11
 Table 7Page 11
 Table 8Page 11
 Table 9Page 11
 Table 10Page 11
 Table 11Page 11
Introduction
Melphalan, chemically 4-{bis (2-chloro ethyl) amino}-L-phenyl alanine (Figure 1), is a phenylalanine derivative of mechlorethamine and belongs to the class of nitrogen mustard [1] . It is an antineoplastic and alkylating agent. It is used mainly in the treatment of multiple myeloma and carcinoma of breast and ovary [2,3] . An alkylating agent inserts an alkyl group (C n H 2n-1 ) to DNA. Melphalan have the bis (2-chloroethyl) amine group, which forms aziridinium by intramolecular displacement of chloride by the nitrogen. The aziridinium group nonspecifically alkylates at N 7 position of the guanine bases to form interstrand crosslinks in Deoxyribonucleic Acid (DNA) and thus blocks DNA replication and transcription which leads to the death of cancerous cell [4,5] .
In literature, few analytical methods have been reported viz. QCM (quartz crystal microbalance) sensing of melphalan via electropolymerized molecularly imprinted polythiophene films [6] ion-pair high performance liquid chromatography, [7] reverse phase high performance liquid chromatography, [8] liquid chromatography, [9] thin layer chromatography, [10] gas chromatography-mass spectrometry [11] etc. These methods are tedious, relatively expensive and involve time consuming separation and extraction processes prior to the determination of drug. In literature only one research paper was found which deals with differential pulse voltammetric determination of melphalan at glassy carbon disk electrode [12] . But, as per the extensive literature survey, there is no voltammetric study of melphalan on functionalized multiwalled carbon nanotubes-Nafion modified glassy carbon electrode (f-MWCNT-Nafion/GCE). So, in present paper differential pulse voltammetric (DPV) technique, based on f-MWCNT-Nafion/GCE, is developed as a fast, sensitive, selective, low cost and validated technique for determination of melphalan in bulk form, pharmaceutical form and serum as biological sample. This paper also deals with the detailed electrochemical study, electrode kinetics and oxidation mechanism of melphalan under optimized pH and buffer conditions.
Experimental 2.1 Apparatus
All voltammograms were recorded using a model Dy 2000 series multi-channel potentiostat (Digi-Ivy, Inc., P.O. Box 200334, Austin, TX 78720-0334, USA). Chronocoulometry was performed on model 1230 A [SR 400] (CHI instrument, Bee Cave, T X, USA) electrochemical analyzer. Controlled potential coulometric experiments were carried out using the model 760 electrochemical workstation (CHI instrument). A three electrode cell assembly (fitted with glassy carbon as a working electrode, a platinum wire as an auxiliary electrode and Ag/AgCl as reference electrode) was employed for all voltammetric measurements. A calibrated CHINO digital pH meter, equipped with a glass electrode, was used for all pH-metric measurements. All experiments were performed at a standard temperature of 25 o C. XRD (X-ray diffraction) studies were carried out using XRD X'Pert PRO instrument model DY2006 of PANalytical.
Materials
Melphalan hydrochloride (99% purity) was obtained as a gift from Emcure Pharmaceuticals Ltd. and used without further purification. A stock solution of 2.5×10 -3 M of melphalan (bulk) was prepared by dissolving its precisely weighed amount in double distilled ethanol. Britton-Robinson (BR) buffer was prepared and pH adjustments were carried out using 1 M HCl and 1 M NaOH. KCl solution (1 M) was used as supporting electrolyte. MEGVAL-50mg vials containing 50 mg melphalan hydrochloride were purchased from commercial sources for pharmaceutical analysis. All chemicals were purchased from Sigma-Aldrich and were of analytical reagent grade. Double distilled deionized water, obtained from laboratory distillation assembly, was used for preparing solutions and for washings throughout the experiment. All solutions were protected from sunlight, stored at 4 o C in a refrigerator and used within 24 hours to avoid decomposition. However, electrochemical responses did not show any significant changes even after 72 hours.
Methods
Methods
Pharmaceutical sample preparation
A quantity of 17.1 mg of melphalan hydrochloride was accurately weighed and dissolved in 20 mL of ethanol followed by sonication for 2 minutes to get homogenous standard stock solution of 2.5×10 -3 M concentration. To record voltammetric measurements, working solutions were prepared by diluting aliquot (appropriate volume) of the standard stock solution of drug with BR buffer and 1 M KCl solution in the voltammetric cell. Effective concentration (E.C.) of the solution in the electrochemical cell was calculated using the formula (E.C = Conc. (M) of stock drug solution × Volume (ml) of stock drug solution added in the cell/Total volume (ml) of solution in the cell). Throughout research paper concentration terms were expressed in terms of E.C.
Spiked serum sample preparation
Drug-free human blood sample, collected from a healthy volunteer after written consent, was centrifuged in Labspin TC 450 D centrifuge machine at 4000 rpm for 30 minutes at room temperature and stored frozen until assay. The supernatant (serum) was collected and treated with acetonitrile (in the ratio of 1.2 ml acetonitrile for 2 ml serum sample) as serum denaturalizing and precipitating agent. After vortexing for 1 minute, serum sample was centrifuged for 10 minutes at 5000 rpm to eliminate serum protein residues followed by fortification with melphalan hydrochloride in ethanol to get final concentration of 2.5×10 -3 M. Now appropriate volumes of this spiked serum sample were transferred into electrochemical cell containing BR buffer of pH 7.2 and 1 M KCl solution to get final concentration of melphalan hydrochloride as 30 µg/L (8.8×10 -8 M) for analysis. The analyzed concentration of melphalan hydrochloride laid within the linearity range of the developed technique.
Pretreatment of Glassy Carbon Electrode (GCE)
To furnish reproducible electrode surface and to improve sensitivity and resolution of voltammetric peaks GCE was mechanically polished, just before each voltammetric measurement, with aqueous slurry of alumina powder (0.08 µm). Then GCE surface was washed with water followed by sonication for 45 seconds to remove any alumina particle if remained on its surface. Now, GCE was dried in an oven at 40 o C for 2 minutes. Before each voltammetric measurement, a continuous stream of nitrogen gas (Instrumental Grade; 99.999% pure) was passed through solution in electrochemical cell for 10 minutes to get oxygen free environment.
Preparation of f-MWCNT suspension and XRD spectrum of functionalized MWCNTs
An amount of 4 mg of inactive MWCNTs was acidified with 4 mL of acid solution (HNO3 and H 2 SO 4 in 1:3 respectively) by sonication for 2 hr. Now, acidified MWCNTs were washed with double distilled water, until water gave pH 7.0, and allowed to dry in incubator. This chemical attack caused rupture of CNTs' wall and generation of functional groups due to oxidation. This was verified by XRD spectra of both inactive and activated CNTs. The radiation used was Cu-Kα2 with a wavelength of 0.1544nm to provide the estimate of atomic spacings in crystalline substances based on Bragg's law. The diffraction angle (2θ) ranged from 0 to 30 0 .
XRD study revealed that inactive and activated CNTs both showed one peak at around diffraction angle of 26 o corresponding to its graphitized arrangement of carbon atoms. The 2θ of 26 o could be indexed as the reflection from (002) Miller plane with an interplanar spacing (d) of approximate 0.348 nm which was lesser than 0.376 nm (interplanar spacing for graphite). This could be attributed to the curvature present in the walls of MWCNTs [13] . The acid attack caused rupture of walls of MWCNTs and generation of oxidized products at its surface. All prominent peaks from the reflection planes in the oxidized form of MWCNTs were obtained as (Miller plane Moreover, interplanar spacing of 0.353 nm {plane (002) and 2θ = 25.22 o } corresponding to the graphitized structure in f-MWCNTs was higher than that of unfunctionalized one (0.348 nm) and diffraction angle shifted from 26 o to 25.22 o with a stronger peak than that of unfunctionalized MWCNTs. The reason for these changes could be attributed to the introduction of surface oxide products into the opened tips of f-MWCNTs causing an expansion in its interplanar spacing while acid attack caused shifting in diffraction angle by increasing its degree of graphitization via transformation of amorphous carbon respectively (Figure 2) [14,16] . Hence, XRD analysis well differentiated functionalized MWCNTs from unfunctionalized one. Literature supports the generation of -COOH as functional group upon oxidation of MWCNTS by means of acid mixture attack [16] . Hence -COOH group was considered as prime functional group to be present at the modified electrode's surface. Dried and functionalized MWCNTs were poured in a mixture of 2 mL N, N-dimethylformamide and 0.2 mL Nafion {a conducting polymer (0.5% in ethanol)}. Now, solution was made up to 30 mL with double distilled water followed by hot sonication for 3 hr to get homogeneous suspension.
Modification of GCE
The optimised volume of 15 µL of f-MWCNT suspension was placed on the surface of pretreated GCE with the help of a micropipette and allowed to dry at room temperature.
Results and Discussion
Results and Discussion
Surface characterization of f-MWCNT-Nafion/ GCE
Morphology of bare and f-MWCNT-Nafion modified GCE was studied by taking SEM (scanning electron microscope) images of both bare GCE (Figure 3A) and f-MWCNT-Nafion modified GCE (Figure 3B) using a ZEISS-EV018 instrument from University Science and Instrumentation Centre (University of Rajasthan, Jaipur). Modification of bare GCE with f-MWCNT-Nafion significantly increased peak responses which were attributed to the increased surface area and increased electron transfer rate between electrode and electrolyte interface due to modification.
Cyclic voltammetric behaviour
Cyclic voltammogram was recorded in the potential range of 0.0 V to 1.1 V vs. Ag/AgCl reference electrode in BR buffer of pH 7.2 at 100 mV s -1 scan rate. A well-defined oxidation peak was obtained at 0.866 V and 0.821 V using bare GCE and f-MWCNT-Nafion/GCE respectively in anodic direction but there was no corresponding cathodic peak which indicated about irreversible nature of oxidation process.
Effect of scan rate
Effect of scan rate on peak current (Ip) and peak potential (E p ) was examined under above mentioned conditions. As the scan rate was increased from 10 to 200 mV s -1 for both bare GCE (Figure 4) and f-MWCNT-Nafion/GCE (Figure 5) at 2.27×10 -4 M concentration of melphalan, peak potential shifted towards more positive values with increase in peak current confirming the irreversible nature of the oxidation process [17,18] . A linear Randles-Sevcik plot (I p vs. ʋ 1/2 ) was obtained for both bare GCE and f-MWCNT-Nafion/GCE (Inset a of Figure 4 and 5 respectively), which indicated about diffusion controlled mass transport in rate determining step of oxidation process [19,20] . Corresponding linear regression equations were expressed as: I p (μA) = 3.2805 υ 1/2 (mV s -1 ) -3.1172 (R 2 = 0.9802) (Bare GCE) (1) I p (μA) = 8.6402 υ 1/2 (mV s -1 ) -27.021 (R 2 = 0.9239) (f-MWCNT-Nafion/GCE) (2) Slope values of log I p vs. log ʋ plot for bare and modified electrodes were 0.5306 and 0.5513 respectively (eq. 3 and 4 respectively) which were in close agreement with theoretical slope value of 0.5 for pure diffusion controlled process [21] .
Determination of surface area of bare GCE and MWCNT-Nafion/GCE:
To determine effective surface area of electrodes, cyclic voltammograms of 1 mM K 3 [Fe(CN) 6 ] solution were recorded at different scan rates using both bare GCE and f-MWCNT-Nafion/GCE. KCl solution of 0.1 M concentration was used as the supporting electrolyte. Peak potentials for reversible redox couple [Fe(CN) 6 ] 3-/ [Fe(CN) 6 ] 4-were 0.156/0.283 V and 0.151/0.275 V at bare GCE and f-MWCNT-Nafion/GCE respectively at 100mV s -1 scan rate. Now, a plot of I p vs. ʋ 1/2 was obtained according to the following equation:
Where, I p is peak current in Ampere, A is electrode surface area in cm 2 , F is Faraday's constant (96,485 C/mol) and R is the universal gas constant (8.314 J/mol K). For 1 mM K 3 [Fe(CN) 6 ] diffusion coefficient (D o ) = 7.6 × 10 -6 cm 2 /s and total number of electrons (n) equal = 1, C is concentration in M and ʋ is the scan rate in V s -1 . Effective surface areas of bare GCE and f-MWCNT-Nafion/GCE were calculated from the slope of I p vs. ʋ 1/2 plot and were found as 0.0541 cm 2 and 0.0982 cm 2 respectively. [22] Thus, modification increased surface area of bare electrode by 0.0441 cm 2 which is 81.52% of bare one resulting in improved peak response towards the oxidation of drug moiety.
Oxidation kinetics of melphalan Hydrochloride
Oxidation kinetics of melphalan Hydrochloride
Determination of parameter [αn´]
To calculate value of αn´, for diffusion controlled process, Ep vs. log ʋ graph was plotted for both bare GCE (Figure 6A) and modified GCE (Figure 6B). According to the following equation given by Nicholson and Shain: [23,24] (6)
Where E p is peak potential (V), E o is formal potential (V), α is the anodic electron transfer coefficient, n´ is number of electrons involved in slowest step, k s is electrochemical heterogeneous rate constant, D o is diffusion coefficient (cm 2 /s) and rest parameters have their usual meanings. Now, value of αn´ was calculated by comparing slope value from Figure 6A and Figure 6B with eq. ( 6) which came out equal to 0.982 and 0.75 for bare GCE and modified GCE respectively.
Determination of total number of electrons
Controlled potential coulometry (CPC) technique was performed to determine total number of electrons (n) involved in oxidation process. Number of Transferred electrons (n) was calculated from charge consumed by desired concentration of Melphalan hydrochloride. For this purpose 5 ml of 4 mg/ml solution of melphalan hydrochloride was taken in an electrochemical cell and electrolyzed at constant potential of 0.867 V vs. Ag/AgCl reference electrode. During electrolysis, solution was kept stirred and a continuous stream of instrumental grade nitrogen gas was allowed to pass through it to get oxygen free environment. Using equation Q = nFN, (where, Q is charge in coulombs, F is Faraday's constant and N is number of moles of substrate) total number of electrons participated (n) was calculated as 2 [25] .
Determination of diffusion coefficient (Do)
Double potential step chronocoulometry technique was performed to determine the value of diffusion coefficient using both bare and modified electrode. In this technique charge (Q) vs. square root of time (t 1/2 ) plot (Anson plot) was recorded which was linear for both bare GCE (Figure 7A) and modified GCE (Figure 7B). Diffusion coefficient (D o ) was calculated by comparing slope value, obtained from Anson plot, with corresponding parameters of Anson equation (eq. 7). [26] Diffusion coefficients were found to be 1.12×10 -3 cm 2 /s and 3.722×10 - 3 cm 2 s -1 for bare GCE and modified GCE respectively.
Where Q d is charge due to electrolysis of diffusing species (coulomb), n is number of electrons transferred per ion or molecule, D o is diffusion coefficient (cm 2 s -1 ) and t is time (sec) rest parameters have their usual meanings.
Determination of heterogeneous electrochemical rate constant (Ks)
Rate constant for oxidation process of melphalan was calculated from the intercept of E p vs. log ʋ plot from equation (6) given by Nicholson and Sain if the value of E o was known. To calculate the value of E o , line of E p vs. ʋ plot (Figure 8A and Figure 8B for bare GCE and modified GCE respectively) was extrapolated till ʋ falls to 0 and the intercept value, thus obtained, was used as E o [27][28][29] . Calculated value of heterogeneous rate constant (k s ) was 1.18 s -1 and 2.60 s -1 with E o values of 0.841 V and 0.789 V for bare GCE and f-MWCNT-Nafion/GCE respectively Increased values of rate constant and diffusion coefficient prove that modification catalyses electron transfer and oxidation process by providing large electroactive surface area. Comparative data were shown in Table 1.
| Parameters | Bare GCE | MWCNT-Nafion/GCE |
|---|---|---|
| Do (cm2 s-1) | 1.12×10⁻³ | 3.722×10⁻³ |
| ks (s-1) | 1.18 | 2.60 |
Table text extracted from the original PDF; superscript letters are shown inline. The original table image is below.
View original table image
Effect of pH
Effect of pH on electrochemical response of melphalan hydrochloride, with effective concentration of 2.27×10 -4 M, was studied in the pH range of 2-12 of BR buffer using DPV technique. Sharp oxidation peaks were obtained only in the pH range of 2.4-8.4 (Figure 9) and after that sharp oxidation peaks were disappeared. As the pH was increased peak current (I p ) and sharpness were firstly increased, attained maxima at pH 7.2 and then decreased (Inset a of Figure 9) hence on the basis of peak height (I p ) and peak sharpness pH value of 7.2 was selected for the whole voltammetric studies. In the pH range of 2.4-8.4, peak potential (E p ) vs. pH plot was nearly linear which clearly indicated about the participation of proton in the oxidation mechanism of melphalan (Inset b of Figure 9) [30] . Linearity of E p vs. pH plot was expressed by the following linear regression equation:
Furthermore, slope of E p vs. pH plot should be equal to 2.303δRT/nF according to following the equation:
Where, δ = number of protons and rest parameters have their usual meanings. Slope of E p vs. pH plot was 24 mV/pH, which is very far from theoretical value of 59 mV/pH for 1H + /1e -participation [31] . Furthermore, comparison of slope of equations ( 8) and ( 9) gave the value of δ/n equals to 0.41 which may be taken as 0.5. Since, CPC indicated participation of 2e -in oxidation so it might be concluded as 1H + /2e -oxidation process.
Proposed oxidation mechanism
Based on CV, CPC and pH studies, Scheme 1 was proposed for the oxidation of melphalan where removal of one proton and two electrons take place in electrochemical step.
Literature also supports such mechanism [32,34] .
Scheme 1: Reaction mechanism for oxidation of melphalan.
Electroanalytical determination of melphalan
The electroanalytical techniques are quite effective and rapid for analytical purposes. Especially, DPV technique is quite sensitive to the measurement of very low amount of numerous organic compounds. The developed f-MWCNT-Nafion/GCE sensor showed a greater peak current in comparison to the bare GCE (Figure 10). So, in the present paper DPV was optimized for determination of melphalan in pharmaceutical formulations, bulk form and serum as biological sample.
Optimisation of operational parameters
Differential pulse voltammetric response depends on various operational parameters such as scan increment (ΔS), pulse width, pulse period, pulse amplitude etc. So prior to record the differential pulse voltammograms of melphalan solutions aforementioned parameters were optimized and are tabulated in Table 2. Volume of f-MWCNT-Nafion suspension, to be drop down on GCE, was also optimized on the basis of peak shape and peak height of differential pulse voltammograms. Volume of 15 μL of f-MWCNT-Nafion suspension was optimised to modify bare GCE.
| DPV | — |
|---|---|
| Scan increment (mV) | 04 |
| Pulse amplitude (mV) | 50 |
| Pulse width (s) | 0.02 |
| Pulse period (s) | 0.5 |
Table text extracted from the original PDF; superscript letters are shown inline. The original table image is below.
View original table image
Effect of Concentration:
Effect of concentration of melphalan on peak current (Ip) was studied in the working concentration range of 9.99×10 -10 M to 5.19×10 -7 M using DPV method at f-MWCNT-Nafion/GCE. Peak current (I p ) was found to be increased linearly with melphalan concentration over the range of 1.7×10 -8 to 3.9×10 -7 M (Figure 11). For quantification of melphalan calibration curve was obtained by plotting peak current (I p ) against melphalan concentration (Inset of Figure 6) which was expressed by the following linear regression equation: I p (µA) = 2×10 7 C Melphalan (M) + 1.1408 (R 2 = 0.9821) (10)
Validation of the developed analytical method
To validate the proposed method, for quantification of melphalan, various validation characteristics were evaluated such as limit of detection (LOD), limit of quantification (LOQ), accuracy, precision (in terms of repeatability and reproducibility) and percentage recovery [35,38] .
Detection and quantification limit
The limit of detection (LOD) and limit of quantification (LOQ) were calculated using the following relationships:
Where, s and m are standard deviation of intercept and slope respectively of peak current vs. concentration plot. Analytical parameters, LOD, LOQ and% RSD are listed in Table 3. 1.14 LOD of the developed method was also compared with other reported methods in literature as shown in Table 4 [6] .
| Analytical method | LOD | References |
|---|---|---|
| DPV | 1.0×10⁻⁶ M | [12] |
| GC-MS | - | [11] |
| HPLC | 10 ng/mL | [39] |
| LC | 5 ng/mL | [40] |
| RP-HPLC | 2 ng/mL | [41] |
| HPLC | - | [42] |
| Ion-pair HPLC | 5 ng/ml | [7] |
| RP-HPLC | 50 ng/ml | [43] |
| Calorimetric method | 15.7 ng/ml | [44] |
| Thin chromatography | 20 ng/ml | [45] |
| Electrochemical MIP sensor | 5.40 ng/ml | [6] |
| This work | 0.67 ng/ml (1.95×10⁻⁹ M) | This work |
Table text extracted from the original PDF; superscript letters are shown inline. The original table image is below.
View original table image
| Techniques | DPV |
|---|---|
| Measure potential (V) | 0.715 |
| Linearity range (M) | 1.70×10⁻⁸-3.9×10⁻⁷ |
| Slope (μA/M) | 2.0×10⁷ |
| Intercept (µA) | 1.1408 |
| Correlation coefficient | 0.9821 |
| LOD (M) | 1.95×10⁻⁹ |
| LOQ (M) | 1.30×10⁻⁸ |
| SD | 0.013 |
| % RSD | 1.14 |
Table text extracted from the original PDF; superscript letters are shown inline. The original table image is below.
View original table image
Accuracy and% recovery
To determine the accuracy and% recovery of the developed method a certain amount of melphalan sample was added in an appropriate amount of BR buffer solution. Now, the concentration of melphalan was determined using standard addition method. The error between amount added and amount found was expressed in terms of mean accuracy (n=5) whereas mean% recovery was expressed in terms of mean±SD and was found equal to 99.96±0.0027. Accuracy and% recovery data was abridged in Table 5.
| Amount added (μg/L) | Mean amount found* (μg/L) | Mean Accuracy/ Error* | Mean% recovery* | SD | % RSD |
|---|---|---|---|---|---|
| 10.0 | 9.996 | 0.004 | 99.86 | 0.0026 | 0.026 |
| 20.0 | 19.995 | 0.005 | 99.92 | 0.0012 | 0.006 |
| 30.0 | 30.009 | 0.009 | 100.1 | 0.0042 | 0.014 |
| Mean ± SD = 99.96±0.0027 | |||||
| *mean of five replicate readings (n=5) |
Table text extracted from the original PDF; superscript letters are shown inline. The original table image is below.
View original table image
Precision
To estimate the precision of the proposed method intraday precision (repeatability) and interday precision (reproducibility) were calculated using DPV technique. For intraday precision three test melphalan solutions of concentration 10 µg/L, 20 µg/L and 30 µg/L were analysed for three times (n=3) at an equal time interval of 0 hr, 2 hr and 4 hr whereas for interday precision aforementioned three test melphalan solutions were analysed for three times (n=3) at an equal time interval of 24 hr for three days. Results of intraday precision and interday precision were abridged in Table 6 and Table 7 respectively. Low values of% RSD as 0.016 and 0.14 for repeatability and reproducibility respectively confirmed good precision of the developed procedure for the determination of melphalan.
| Conc. added (μg/L) | Concentration found (μg/L) | — | — | Mean ± SD | % RSD |
|---|---|---|---|---|---|
| D1* | D2* | D3* | |||
| 10.0 | 9.986 | 9.978 | 9.959 | 9.974 ± 0.028 | 0.28 |
| 20.0 | 20.004 | 19.985 | 19.961 | 19.983 ± 0.021 | 0.11 |
| 30.0 | 30.002 | 29.992 | 29.985 | 29.993 ± 0.011 | 0.037 |
| Mean% RSD = 0.14 | |||||
| *mean of three replicate readings (n=3) |
Table text extracted from the original PDF; superscript letters are shown inline. The original table image is below.
View original table image
| Conc. added (μg/L) | Peak current (μA) | — | — | Conc. Found (μg/L) | — | — | Mean*±SD | % RSD |
|---|---|---|---|---|---|---|---|---|
| 0 hr | 2 hr | 4 hr | 0 hr | 2 hr | 4 hr | |||
| 10.0 | 1.994 | 1.982 | 1.975 | 9.998 | 9.982 | 9.969 | 9.983±0.0032 | 0.032 |
| 20.0 | 2.288 | 2.275 | 2.262 | 19.996 | 19.982 | 19.965 | 19.981±0.0024 | 0.012 |
| 30.0 | 2.642 | 2.635 | 2.621 | 30.009 | 29.992 | 29.979 | 29.993±0.0010 | 0.0033 |
| Mean% RSD = 0.016 | ||||||||
| *mean of three replicate readings (n=3) |
Table text extracted from the original PDF; superscript letters are shown inline. The original table image is below.
View original table image
Interference studies:
The tolerance limit was defined as maximum concentration of interferent that causes an error of less than ±5% for determination of melphalan. For interference studies effect of some commonly used interferents in pharmaceutical preparations was evaluated on DPV response of 2.27×10 -4 M melphalan solution as a standard. Obtained results (Table 8) showed that 100-fold excess concentration of starch, D-glucose, sucrose, dextrose and NaCl did not interfere with the DPV signal of melphalan which justified that the developed method can be considered as specific.
| Interferent | Concentration (M) | Signal change (%) |
|---|---|---|
| Starch | 0.02 | +1.76 |
| D-glucose | 0.02 | +1.51 |
| sucrose | 0.02 | +1.80 |
| Dextrose | 0.02 | +0.98 |
| NaCl | 0.02 | -1.12 |
Table text extracted from the original PDF; superscript letters are shown inline. The original table image is below.
View original table image
Determination of melphalan in pharmaceutical formulation and spiked serum sample:
To validate the proposed method for practical applications, quantification of melphalan was carried out in pharmaceutical formulation and spiked serum sample using standard addition method. Procedure for pharmaceutical and spiked serum analysis was adopted from sections pharmaceutical sample preparation and spiked serum sample preparation respectively. Obtained results for spiked serum sample were listed in Table 9 and Table 10 while results of pharmaceutical formulation were tabulated in Table 11. Good recovery of melphalan indicated that proposed method can be successfully applied for direct determination in pharmaceutical formulation and spiked serum sample.
Conclusions
In this work, detailed oxidation behaviour of melphalan, including determination of different kinetic parameters, was studied at both bare GCE and f-MWCNT-Nafion modified GCE in BR buffer at pH 7.2. Comparative studies at both bare GCE and f-MWCNT-Nafion/GCE clearly showed that f-MWCNT-Nafion positively catalyzed the electron transfer rate between electrode and electrolyte interface in the oxidation process of melphalan. Improved electron transfer increased rate constant and peak current of voltammetric response whereas decreased peak potential that is required for oxidation process. Oxidation process was diffusion controlled and involved two electrons and one proton. A possible oxidation mechanism of melphalan was also proposed based on the experimental observations. Furthermore, a fast, cost effective and reliable differential pulse voltammetric (DPV) method was developed using f-MWCNT-Nafion/GCE based sensor and successfully applied for the determination of melphalan in bulk formulation, pharmaceutical formulation and serum as a biological sample. Good sensitivity, selectivity as well as good accuracy and precision validated the developed method for the determination of melphalan. Already reported methods often require pre-treatment or derivatization of melphalan to remove matrix effect and were not economical as well as time effective. But owing to simple and economical nature the developed method can be a good alternative to the already proposed methods in literature for quality control laboratories and pharmacokinetic studies.
Figures and tables from the paper
References
45 in the original paper- Sweetman SC, editor. Martindale: the complete drug reference. 36th ed. London: Pharmaceutical Press; 2009. p. 742.
- Pinguet F, Culine S, Bressolle F, Astre C, Serre M, Chevillard C, Fabbro M. A phase I and pharmacokinetic study of melphalan using a 24-hour continuous infusion in patients with advanced malignancies. Clinical Cancer Research. 2000;6:57-63.
- Barek J, Castegnaro M, Malaveille C, Brouet I, Zima J. A method for the efficient degradation of melphalan into nonmutagenic products. Microchemical Journal. 1987;36:192-197.
- Xie H. Occurrence, ecotoxicology, and treatment of anticancer agents as water contaminants. Journal of Environmental & Analytical Toxicology. 2012;2:1-11.
- Chen Q, Van Sluis PC, Boulware D, Hazlehurst LA, Dalton WS. The FA/BRCA pathway is involved in melphalan-induced DNA interstrand cross-link repair and accounts for melphalan resistance in multiple myeloma cells. Blood. 2005;106:698-705.
- Singh AK, Singh M. QCM sensing of melphalan via electropolymerized molecularly imprinted polythiophene films. Biosensors and Bioelectronics. 2015;74:711-717.
- Adair CG, Burns DT, Crockard AD, Desai ZR, Harriott M. Modified extraction and chromatography for the measurement of plasma melphalan by ion-pair highperformance liquid chromatography. Journal of Chromatography B: Biomedical Sciences and Applications. 1984;336:429-433.
- Kumar KK, Nadh RV. A validated RP-HPLC method for the estimation of melphalan in tablet dosage forms. Rasayan Journal of Chemistry. 2011;4:863-867.
- Malecki F, Langleben A, Crawhall JC. Liquid chromatographic analysis of plasma melphalan with amperometric detection in a patient with breast cancer. Journal of Liquid Chromatography. 1990;13:37733784.
- Taha IAK, Ahmad RAJ, Rogers HJ. Melphalan estimation by quantitative thin-layer chromatography. Cancer Chemotherapy and Pharmacology. 1981;5:181184.
- De Boeck G, Van Cauwenberghe K, Eggermont AMM, Van Oosterom AT, De Bruijn EAD. Determination of melphalan and hydrolysis products in body fluids by GC-MS. Journal of High Resolution Chromatography. 1997;20:697-700.
- Barek J, Berka A, Zima J. Determination of melphalan using differential pulse voltammetry. Analytical Letters. 1985;18:2581-2589.
- Chiang YC, Lee CC, Lee CY. Surface characterization of acid-oxidized multi-walled carbon nanotubes. Toxicological & Environmental Chemistry. 2009;91:1413-1427.
- Chiang YC, Lin WH, Chang YC. The influence of treatment duration on multi-walled carbon nanotubes functionalized by H₂SO₄/HNO₃ oxidation. Applied Surface Science. 2011;257:2401-2410.
- Rao CNR, Govindaraj A, Satishkumar BC. Functionalised carbon nanotubes from solutions. Chemical Communications. 1996;(13):1525-1526.
- Ovejero G, Sotelo JL, Romero MD, Rodríguez A, Ocana MA, Rodríguez G, Garcia J. Multiwalled carbon nanotubes for liquid-phase oxidation: Functionalization, characterization, and catalytic activity. Industrial and Engineering Chemistry Research. 2006;45:2206-2212.
- Nicholson RS. Theory and application of cyclic voltammetry for measurement of electrode reaction kinetics. Analytical Chemistry. 1965;37:1351-1355.
- Nicholson RS, Shain I. Theory of stationary electrode polarography. Single scan and cyclic methods applied to reversible, irreversible, and kinetic systems. Analytical Chemistry. 1964;36:706-723.
- Jain R, Rather JA. Stripping voltammetry of tinidazole in solubilized system and biological fluids. Colloids and Surfaces A: Physicochemical and Engineering Aspects. 2011;378:27-33.
- Tasdemir IH, Akay MA, Erk N, Kılıç E. Voltammetric behavior of telmisartan and cathodic adsorptive stripping voltammetric method for its assay in pharmaceutical dosage forms and biological fluids. Electroanalysis. 2010;22:2101-2109.
- Jain R, Gupta VK, Jadon N, Radhapyari K. Adsorptive stripping voltammetric determination of pyridostigmine bromide in bulk, pharmaceutical formulations and biological fluid. Journal of Electroanalytical Chemistry. 2010;648:20-27.
- Goyal RN, Rana AR, Aziz MA, Oyama M. Effect of gold nanoparticle attached multi-walled carbon nanotube-layered indium tin oxide in monitoring the effect of paracetamol on the release of epinephrine. Analytica Chimica Acta. 2011;693:35-40.
- Niu X, Yan L, Wen Z, Li X, Niu Y, Lu Y, et al. Voltammetric determination of metol on a gold nanoparticle modified carbon molecular wire electrode. Analytical Letters. 2017;50:325-335.
- Guidelli R, Compton RG, Feliu JM, Gileadi E, Lipkowski J, Schmickler W, et al. Defining the transfer coefficient in electrochemistry: An assessment (IUPAC Technical Report). Pure and Applied Chemistry. 2014;86:245-258.
- Jain R, Rather JA. Stripping voltammetry of tinidazole in solubilized system and biological fluids. Colloids and Surfaces A: Physicochemical and Engineering Aspects. 2011;378:27-33.
- Kissinger PT, Heineman WR, editors. Laboratory techniques in electroanalytical chemistry. 2nd ed. New York: Marcel Dekker; 1996. p. 61-64.
- Zahn R, Coullerez G, Vörös J, Zambelli T. Effect of polyelectrolyte interdiffusion on electron transport in redox-active polyelectrolyte multilayers. Journal of Materials Chemistry. 2012;22:11073-11078.
- Joumani ME, Bououd S, Abbassi ZE, Saidi F, Kafih A, Hourch AE, et al. Electrochemical oxidation of vanadyl ions in phosphoric acid solution. Journal of Materials and Environmental Science. 2017;8:188-194.
- Hong J, Zhao YX, Xiao BL, Moosavi-Movahedi AA, Ghourchian H, Sheibani N. Direct electrochemistry of hemoglobin immobilized on a functionalized multiwalled carbon nanotubes and gold nanoparticles nanocomplex-modified glassy carbon electrode. Sensors. 2013;13:8595-8611.
- Kacar C, Durmus Z, Kilic E. Electrochemical behavior of trazodone at mercury and glassy carbon electrodes and voltammetric methods for its determination. Asian Journal of Chemistry. 2014;26:1931-1937.
- Tasdemir IH, Akay MA, Erk N, Kilic E. Voltammetric behavior of telmisartan and cathodic adsorptive stripping voltammetric method for its assay in pharmaceutical dosage forms and biological fluids. Electroanalysis. 2010;22:2101-2109.
- Paxton J, editor. Topics on drug metabolism. United Kingdom: InTech; 2012. p. 232.
- Baizer MM, editor. Organic electrochemistry: an introduction and a guide. New York: Marcel Dekker Inc.; 1973. p. 511.
- Weinberg NL, Weinberg HR. Electrochemical oxidation of organic compounds. Chemical Reviews. 1968;68:449-523.
- Miller JN, Miller JC. Statistics for analytical chemistry. 2nd ed. Chichester (UK): Wiley; 1988. p. 121.
- Sharma DK, Mourya GL, Jhankal KK, Jones LA, Bhargava SK. Electrochemical behaviour and validated determination of the anticancer drug tamoxifen. Der Pharmacia Lettre. 2012;4:1599-1606.
- Kul D, Doğan-Topal B, Özkan SA, Uslu B. Differential pulse voltammetric determination of Fulvestrant in pharmaceutical dosage forms and serum samples. International Journal of Electrochemistry. 2011;2011:17.
- Jain R, Sharma R. Voltammetric quantification of antihepatitis drug Adefovir in biological matrix and pharmaceutical formulation. Journal of Pharmaceutical Analysis. 2012;2:98-104.
- Sweeney DJ, Greig NH, Rapoport SI. Highperformance liquid chromatographic analysis of melphalan in plasma, brain and peripheral tissue by ophthalaldehyde derivatization and fluorescence detection. Journal of Chromatography B: Biomedical Sciences and Applications. 1985;339:434-439.
- Ehrsson H, Eksborg S, Lindfors A. Quantitative determination of melphalan in plasma by liquid chromatography after derivatization with Nacetylcysteine. Journal of Chromatography B: Biomedical Sciences and Applications. 1986;380:222228.
- Silvestro L, Viano I, Baiocchi C, Saini G, Marmont F, Ferro R. Quantitation of melphalan in plasma of patients by reversed-phase high-performance liquid chromatography with electrochemical detection. Journal of Chromatography B: Biomedical Sciences and Applications. 1991;563:443-450.
- Brightman R, Finlay G, Jarvis I, Knowlton T, Manktelow CT. A stability-indicating method for the determination of melphalan and related impurity content by gradient HPLC. Journal of Pharmaceutical and Biomedical Analysis. 1999;20:439-447.
- Veni PRK, Sharmila N, Babu BH. An efficient RPHPLC method for the estimation of melphalan in pharmaceutical formulations. Research Journal of Pharmaceutical, Biological and Chemical Sciences. 2012;3:346-353.
- Krishnaveni G, Sailaja O, Reddy KL. Simple, sensitive, specific and validated colorimetric method development for the quantitative estimation of melphalan hydrochloride in bulk and pharmaceutical dosage forms. South Pacific Journal of Pharma and Bio Science. 2014;2:110-117.
- Taha IAK, Ahmad RAJ, Rogers HJ. Melphalan estimation by quantitative thin-layer chromatography. Cancer Chemotherapy and Pharmacology. 1981;5:181184.