
Research article · 2026 · Full text
International Journal of Geography Geology and EnvironmentAnalysing the role of Dwarka Expressway in alleviating congestion on the Delhi-Gurgaon Expressway using YOLOv11 and counterfactual modelling
Volume 8(6) · Pages 117–126 · DOI: 10.22271/27067483.2026.v8.i6b.792 ↗
Research areasTransportation Planning and OptimizationTraffic Prediction and Management TechniquesTraffic control and management
Abstract
Author-writtenExtremely high demand for vehicular movement, minimal inter-connectivity via public transportation and lack of new thoroughfare expansion on the Delhi-Gurgaon Expressway has been a recurrent problem since its inauguration in 2008, failing to cater to the explosive demand. 18 years since then, this problem has only increased, overloading the link between both the megalopolises. To transfer this increasing load of vehicular movement and cater to an expanding Gurgaon, the Dwarka Expressway was constructed offering a second entry point into the city from South West Delhi allowing vehicles an alternate route with the motive to reduce congestion on Delhi-Gurgaon Expressway. Through YOLO computer vision model-based traffic analysis in a counterfactual framework, this study aims to identify whether Dwarka Expressway has led to reduced traffic on the Delhi-Gurgaon Expressway or not. Counterfactual modelling allows projected values of the expressway congestion in absence of Dwarka Expressway to be synthesised and compared with actual figures of Aug-Sept 2025 and Dec-Jan 2025. A difference-in-difference and deviation analysis shows that only the Gurgaon section of Delhi-Gurgaon Expressway has experienced some congestion relief as four wheelers and heavy motor vehicles have deviated to Dwarka Expressway, leaving the Delhi section of the expressway mostly untouched.
Summary
Source-checkedPlain-language reading of the full paper, prepared with AI and checked against the text. Each point links to the authors' own words.
Why it matters
- The Delhi-Gurgaon Expressway has suffered from chronic congestion since 2008 due to high vehicle demand, poor public transport connectivity, and a lack of road expansion. View evidence ↗
- The Dwarka Expressway was built as an alternative route from South West Delhi to Gurgaon to alleviate the traffic load on the original Delhi-Gurgaon Expressway. View evidence ↗
- Based on NHAI growth rates, estimated vehicle movement by 2025 was projected to reach between 275,540 and 480,000 Passenger Car Units (PCUs) per day in the Gurgaon and Delhi sections respectively. View evidence ↗
The question
- The study aims to determine if the opening of the Dwarka Expressway actually reduced traffic volumes on the Delhi-Gurgaon Expressway. View evidence ↗
What they did
- Traffic footage was collected from five locations: two on the Delhi-Gurgaon Expressway (Shankar Vihar and Gurgaon Sector-18) and three on the Dwarka Expressway (Dwarka Sector 21-22, Bharatal Underpass, and Gurgaon Sector-99). View evidence ↗
- The researchers used the YOLOv11 computer vision model to count vehicles across five categories: cars, trucks, buses, motorcycles, and bicycles. View evidence ↗
- The analysis compared actual PCU values from August-September 2025 and December-January 2025-26 against counterfactual projections provided by the NHAI. View evidence ↗
- Landsat 8 satellite imagery was used to create a Land Use Land Cover (LULC) map to confirm that no other new roads or developments caused the observed traffic changes. View evidence ↗
What they found
- Between August-September and December-January, total daily flow on the Delhi-Gurgaon Expressway increased in the Delhi section (417,908 to 453,971 PCUs) but decreased in the Gurgaon section (435,460 to 415,475 PCUs). View evidence ↗
- The Dwarka Expressway saw sharp increases in total daily PCUs across all survey sites from August-September to December-January, with the highest growth at Bharatal (119,589 to 246,152 PCUs). View evidence ↗
- In the Gurgaon sections, the Delhi-Gurgaon Expressway saw a decline of 3,000 Car PCUs and nearly 20,000 total PCUs, while the Dwarka Expressway grew by 31,000 Car PCUs and 67,000 total PCUs. View evidence ↗
- Difference-in-Differences (DiD) analysis for the Delhi-Dwarka sections showed a total PCU deviation of -18,168 and a Car PCU deviation of -41,223, suggesting private vehicles were more responsive to the new route than overall traffic. View evidence ↗
- A DiD value of -87,979 PCUs for total flow in the Gurgaon sections indicates that traffic shifted significantly from the Delhi-Gurgaon Expressway (NH-48) to the Dwarka Expressway (NH-244BB). View evidence ↗
What it means
- The authors conclude that substantial congestion relief on the Delhi-Gurgaon Expressway occurred only in the Gurgaon section and primarily for heavy vehicles. View evidence ↗
- The authors found that car traffic on the Delhi-Gurgaon Expressway remained largely unaffected, showing only minimal decreases. View evidence ↗
- A limitation of the study is the reliance on NHAI projected traffic volumes due to a lack of comprehensive recorded ground-level data for the Delhi-Gurgaon Expressway. View evidence ↗
- The authors state that using more frequent data points instead of a six-month gap would improve the validity and reliability of the results. View evidence ↗
Visual summary
2 visualsIllustrations explain the paper; charts are replotted from the paper's own table values.
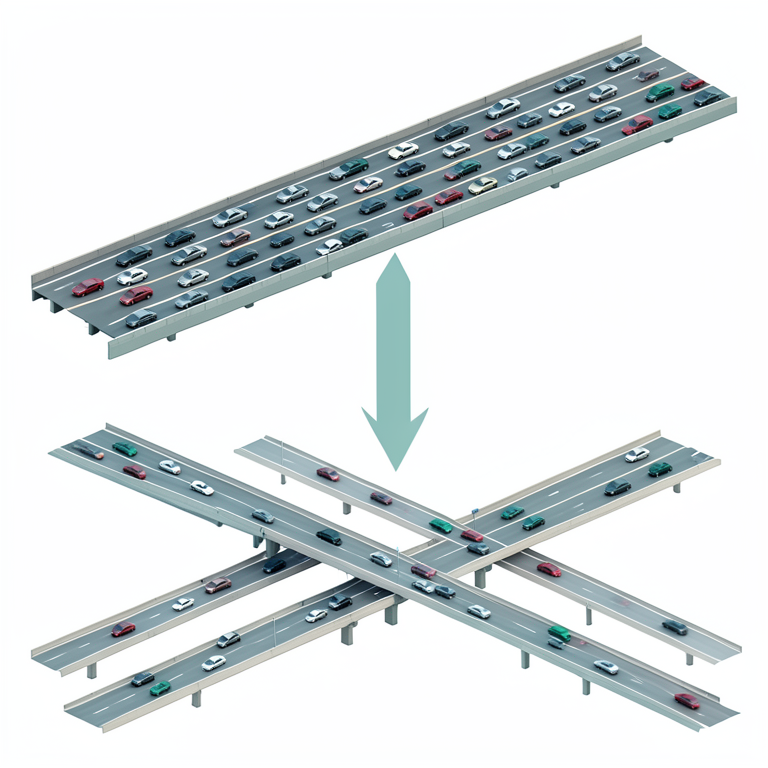
Counterfactual Analysis Concept
AI-generated conceptual illustration (Multi-lane urban expressways with vehicular traffic). It explains the idea and does not show study data.
View source evidence ↗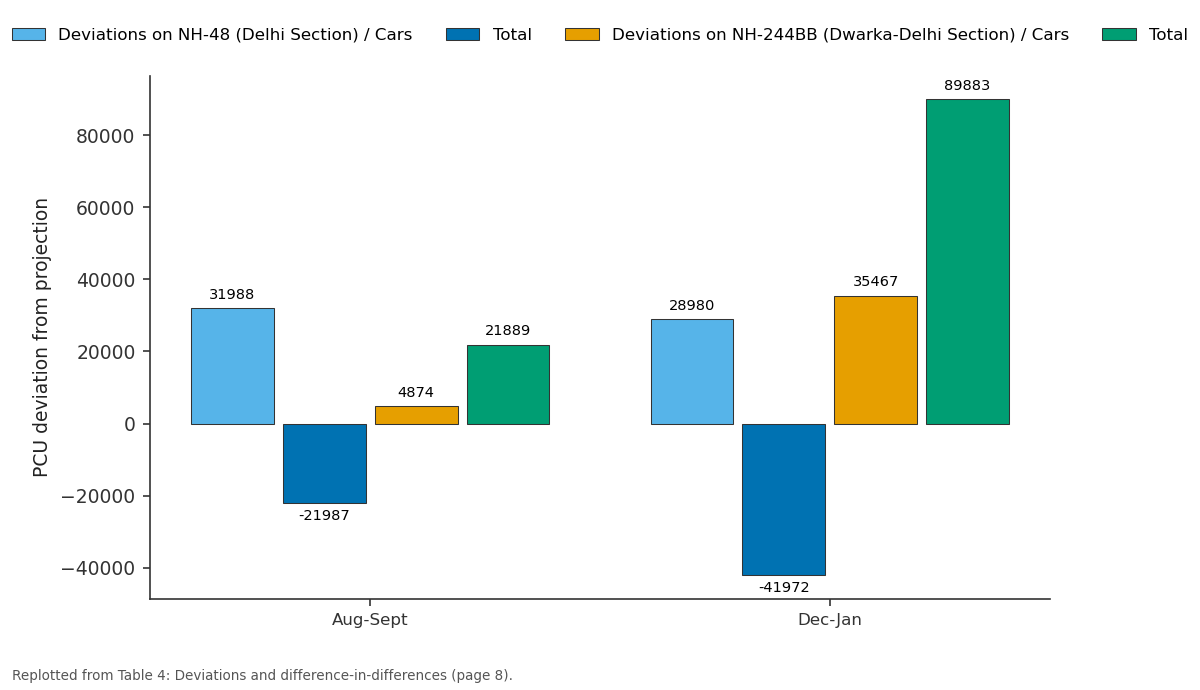
Deviations on NH-48 (Delhi Section) / Cars and Total and more: Aug-Sept vs Dec-Jan
Replotted from Table 4 (page 8) of the original paper. Every bar is the paper's own table value.
View source evidence ↗Figures & tables
From the original paper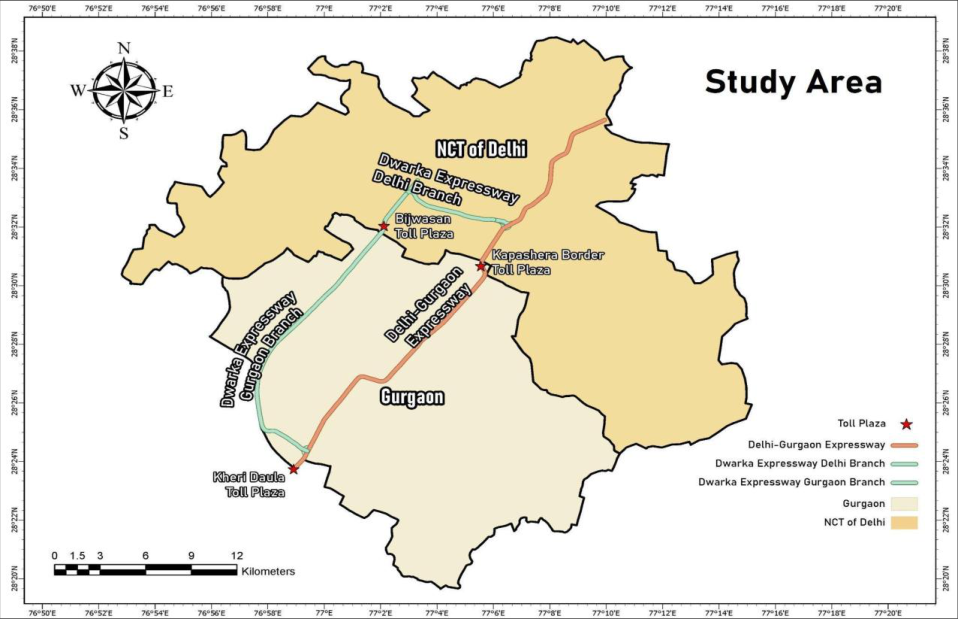 Figure 1
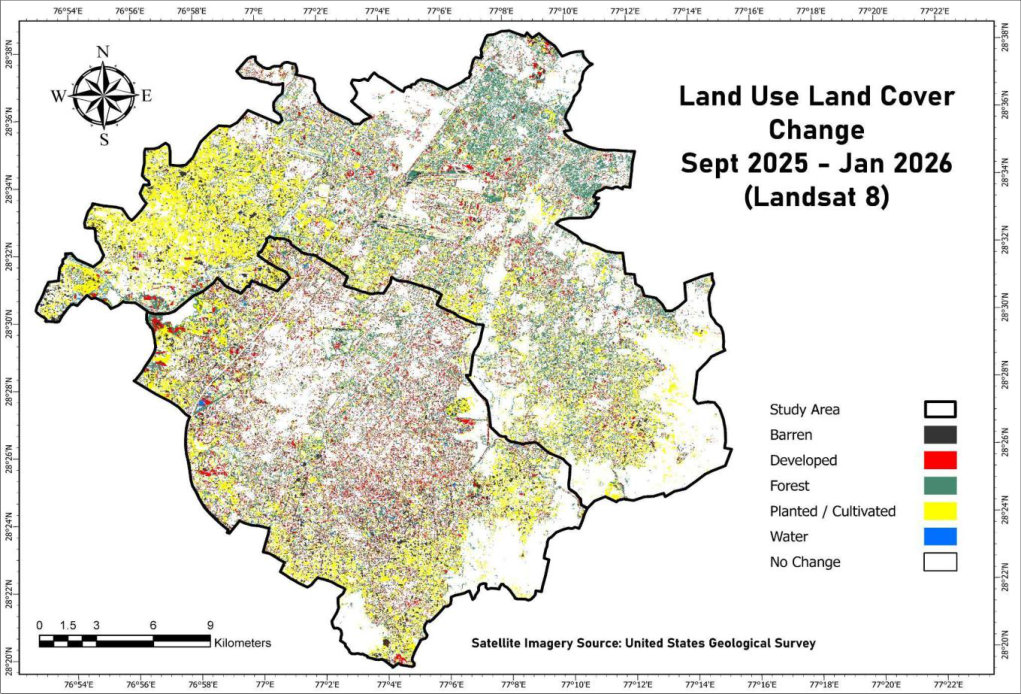 Figure 2
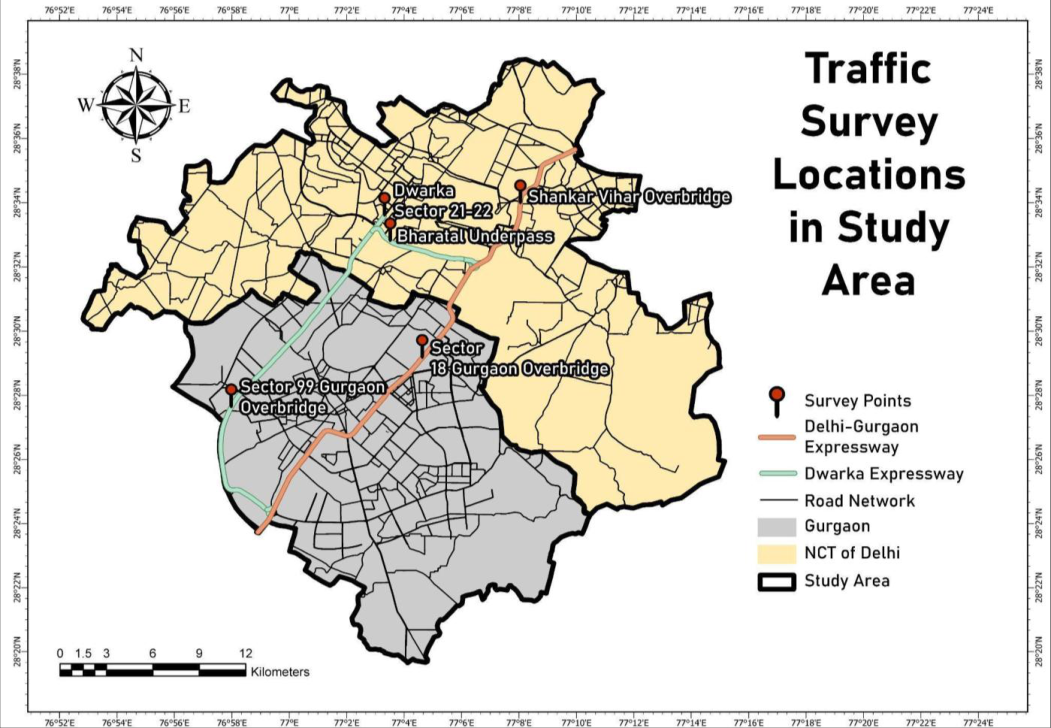 Figure 3
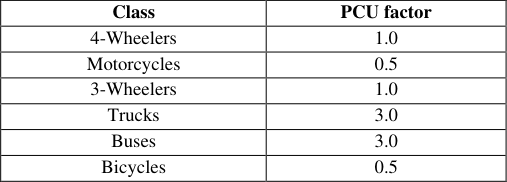 Table 1
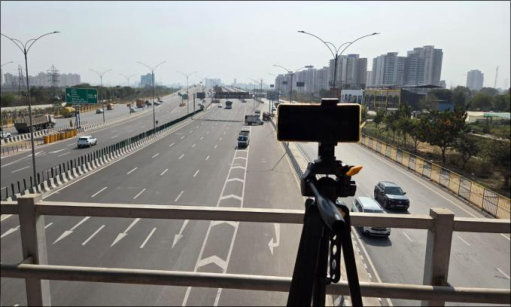 Figure 4
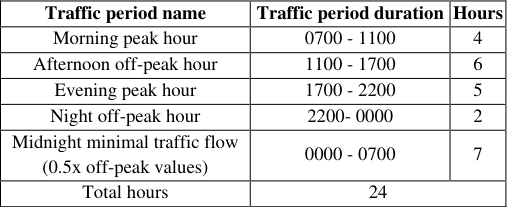 Table 2
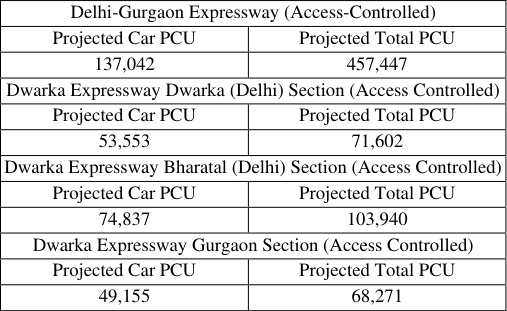 Table 3
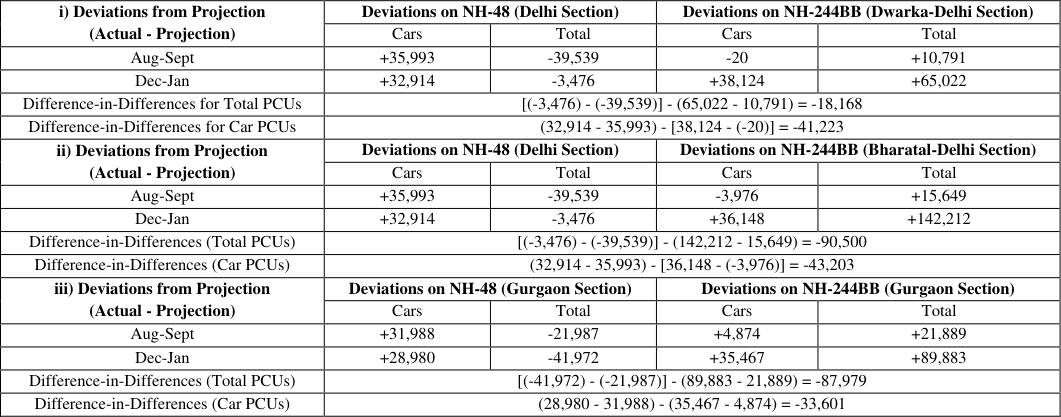 Table 4
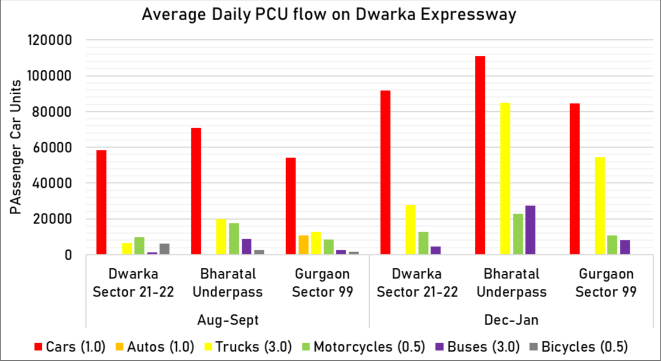 Figure 5
Introduction
Gurgaon, originally a small agricultural village started on its path to development in the 1970s when the Haryana Urban Development Authority was created (1977), Gurgaon was split away from Faridabad administratively (1979), Development and Regulation of Urban Areas Act of 1975 made land acquisition easier, Delhi Lease and Finance (DLF) started buying up agricultural wasteland to develop townships (1979) and most notably, when the Maruti-Suzuki joint venture led to the setting up of an automobile plant in Gurgaon (1982). (Rajagopalan & Tabarrok, 2014). The inflow of factories and ancillary industries coupled with the strict zoning policies set up by the Delhi Development Authority led to the large-scale relocation of offices and people to Gurgaon in search for affordable housing and employment starting in the 1980s. To travel between Delhi and Gurgaon, one used the now called Old Delhi-Gurgaon Road and the MG Road (NH 148A). This network connects Kapashera in Delhi to Mahavir Chowk in Old Gurgaon, falling right where the Maruti-Suzuki factory is situated and Mehrauli to New Gurgaon. It was only in 1997, when the existing National Highway 8 (Now NH-48) was sanctioned to be widened and converted into an access-controlled section between Delhi's Dhaula Kuan and Gurgaon's Kherki Daula. Growing traffic between the two cities and the overall rising volume of traffic as between the metros of Delhi, Mumbai, Chennai and Kolkata facilitated this decision and led to the creation of the Golden Quadrilateral, within it the Delhi-Gurgaon Expressway on NH-48 (National Highways Authority of India & RITES, 2001) [14] . The national highway initially fell on the outskirts of Gurgaon (now Old Gurgaon) and lacked the importance it has today. Land acquisition and construction of office complexes, malls, residences, the golf course etc. over the years gave it the centre position as the primary road network between the two megalopolises. The project would cater to the high passenger car volume that moves between Delhi and Gurgaon while also supporting freight that needs to reach the ports of Mumbai from Delhi.
Close to 150,000 cars (Singh, 2010) [20] were using the expressway daily in 2010 compared to the 97,000 motorised vehicles which entered the highway from Delhi during the detailed-project report traffic survey in 2000 (National Highways Authority of India & RITES, 2001) [14] . It was determined that the initial traffic surveys vastly underestimated the traffic flow through toll gates, which were now causing congestion issues. Problems of toll operations, highway maintenance also propped up due to several legal battles between the construction companies Jaiprakash Industries, DS Constructions and NHAI. (Singh, 2010; Garg, S., & Mahapatra, D. 2017) [20,7] . Only two years after the red ribbon was cut, the time taken to cross Delhi-Gurgaon Expressway doubled to 40 minutes with crossing the toll taking as long as fifteen minutes (Das, 2003) [3] . Using the annual traffic growth rates given by NHAI in 2001, we conclude the estimated vehicle movement to be somewhere between 275,540 PCUs per day in Gurgaon and 480,000 PCUs per day in Delhi as of 2025. The same highway which accommodated roughly 100,000 PCUs in 2000 before its upgradation and 160,000 PCUs in 2010 now carries close to five times that amount. It is safe to say that the strain on the Delhi-Gurgaon Expressway has only surged and will continue to do so without interventions. In 2006, in an effort to alleviate this long-standing issue of congestion on the Delhi-Gurgaon Expressway and offer another viable entry into Gurgaon, the Dwarka Expressway also known as the Northern Peripheral Road was planned (National Highways Authority of India & AECOM, 2017; Dutta, 2018) [13,6] as an access-controlled expressway connecting the sub-city of Dwarka, Old Gurgaon and NH-48 altogether. This expressway starts from Dwarka Sector 21 in Delhi with one branch connecting the Delhi-Gurgaon Expressway in Shiv Murti whilst another branch joining the Southern Peripheral Road near Sector 74A Gurgaon (National Highways Authority of India & AECOM, 2017) [13] . After several delays with construction and most notably land acquisition (Dutta, 2018; Som, 2025; Kumar, 2012) [6,21,10] , the Dwarka Expressway opened to the public in March 2024 while the section in Delhi opened in August 2025. However, it remains to be seen whether the construction of Dwarka Expressway has truly reduced the burden on the Delhi-Gurgaon Expressway or not. To find this out, the study goes on to compare two sets of traffic data on both expressways within a counterfactual framework, to interpret whether traffic has been diverted from one road to another since the Dwarka Expressway's complete inauguration in August of 2025. Together with the projected counterfactuals and real data sets, an inference can be made as to whether traffic diversion has taken place from the former to the latter or not.
Study area
Note: This map represents the Kapashera, Dwarka, Delhi Cantt, Vasant Vihar, Mehrauli and Saket Tehsils situated inside South West, New Delhi and South Delhi Districts. Within Gurgaon district, the area depicted is one that falls under the Gurgaon Municipal Corporation Area The study area (Figure 1) extends from 28.611726° N, 77.042488° E in Dwarka, Delhi to 28.395917° N, 76.982194° E near the Kherki Daula Toll Plaza in Gurgaon, encompassing a significant stretch of the Delhi-Gurgaon corridor. Gurgaon, officially referred to as the Municipal Corporation of Gurgaon together with its outgrowth areas, lies in the south-eastern part of the state of Haryana and falls administratively under the Gurgaon tehsil. Portions of its urban boundary also extend into the adjoining tehsils of Badshahpur, Wazirabad, Harsaru and Kadipur within Gurgaon district (Department of Revenue & Disaster Management, Government of Haryana, 2021) [5] . The city shares its northern boundary with the National Capital Territory of Delhi, forming one of the most economically significant inter-state urban borders in India.
The Delhi segment of the study area consists of narrow territorial strips belonging to the South West, New Delhi and South districts. Within these districts, the study area specifically includes the localities and tehsils of Kapashera, Dwarka, Vasant Vihar, Delhi Cantonment, Mehrauli and Saket. However, since the demographic and administrative datasets used in this study are drawn from the 2011 Census, some of these jurisdictions were recorded under their earlier tehsil names, namely Najafgarh, Vasant Vihar, Hauz Khas and Kalkaji. The boundary belt separating Delhi from Gurgaon primarily comprises green zones, vacant government land and small, dispersed village settlements, creating a peri-urban landscape (Delhi Development Authority, 2021) [4] .
Methodology
Note: Map prepared using Level-2 satellite imagery from Landsat 9 (September 2025 and January 2026), obtained from the U.S. Geological Survey (USGS) The study aims to understand whether traffic has been diverted from Delhi-Gurgaon Expressway to Dwarka Expressway following its opening by comparing passenger car unit (PCU) values from Aug-Sept 2025 and Dec-Jan 2025-26 to their counterfactuals i.e. the projected values of traffic estimated by NHAI during their construction. To establish causation, a LULC change map has also been constructed using Landsat 8 satellite imagery, shown in Figure 2 proving that no significant developments or creation of road networks have taken place during this time redirecting flow from Delhi-Gurgaon Expressway or Dwarka Expressway. The majority of change observed in this period is in planted area and forest/vegetation cover which shifts periodically as cropping seasons begin and end. Minor change in built-up area increasing/decreasing can be attributed to classification errors as the spatial resolution and spectral range of the imagery remains limited. Large deviations from counterfactuals indicate that the expressway is under-performing (negative deviation) or overburdened (positive deviation) whereas variations in values between Aug-Sept and Dec-Jan will show whether traffic has been diverted or not. Lastly, a difference-in-differences analysis is performed on the deviations to mathematically understand how much of excess demand has Dwarka Expressway catered to and how much relief has Delhi-Gurgaon Expressway experienced.
Data collection and extraction
Note: Map adapted from OpenStreetMap road network data downloaded from GeoFabrik (Northern Zone, India). © OpenStreetMap contributors After collection of footage, vehicular counts were calculated using the YOLOv11 model. A pre-trained computer-vision model, YOLO specialises in object detection and tracking, with the ability to count anything from objects like plants and telephones to different types of vehicles. The v11 model was chosen for its improved backbone and neck architecture, optimised training pipelines, higher mean Average Precision (mAP) on the COCO dataset (Ultralytics, 2026) [22] making it computationally efficient without majorly compromising accuracy. YOLOv11 also works flawlessly on NVIDIA GPUs, the hardware used for this study.
To run the YOLO model on the footage, a Python based script was developed where vehicles would be each given an ID and counted when it crossed a demarcated line on the video. This line was drawn differently for each video by choosing specific x and y values denoting the line's beginning and end.
For the purpose of this study the classes 'Cars', 'Trucks', 'Buses', 'Motorcycles' and 'Bicycles' were chosen. Since the COCO dataset on which YOLOv11 is trained on does not have a 3-wheeler category, the auto rickshaws recorded were categorised under the 'Cars' class observed during processing, later separated by calculating ratios. Data of both the main expressway and service lanes were collected but only the figures obtained of the access-controlled sections were used to maintain consistency with projections made by NHAI. To do so, the total figures recorded were divided by total number of lanes and multiplied by four i.e. the number of lanes in the access-controlled section. adapted from Consultancy services for project preparation for converting dual highway from km 14.3 to km 42.0 of NH-8 (Delhi-Gurgaon section) into an access-controlled highway (National Highways Authority of India & RITES, 2001) [14] This value was then multiplied by the classes' respective PCU factor as determined by NHAI in their original detailed project reports (RITES Ltd. & NHAI, 2001) [14] given in Table 1. The resultant data became the hourly PCU values of each survey location of each direction in morning peak hours and afternoon off-peak hours. To compare these values to their projected figures, a daily average PCU flow of each location was to be determined. To obtain figures for the whole day from hourly peak and off-peak values, the values of each location (both directions) were multiplied by the number of hours such a period exists during the day, mentioned in Table 2. For the sake of accuracy, a third period of 'Minimal Traffic Flow' was created equating to 0.5x the traffic seen during off-peak hours imitating midnight usage of the expressways. The time periods chosen for peak and offpeak hours represent the densely populated area of Delhi and Gurgaon where evening rush hours can last up to 10pm at night from common observation.
| Traffic period name | Traffic period duration | Hours |
|---|---|---|
| Morning peak hour | 0700 - 1100 | 4 |
| Afternoon off-peak hour | 1100 - 1700 | 6 |
| Evening peak hour | 1700 - 2200 | 5 |
| Night off-peak hour | 2200- 0000 | 2 |
| Midnight minimal traffic flow (0.5x off-peak values) | 0000 - 0700 | 7 |
| Total hours | 24 |
Table text extracted from the original PDF; superscript letters are shown inline. The original table image is below.
View original table image
| Class | PCU factor |
|---|---|
| 4-Wheelers | 1.0 |
| Motorcycles | 0.5 |
| 3-Wheelers | 1.0 |
| Trucks | 3.0 |
| Buses | 3.0 |
| Bicycles | 0.5 |
Table text extracted from the original PDF; superscript letters are shown inline. The original table image is below.
View original table image
Calculating deviations from counterfactual values in both time periods
The next step is creating the projected traffic values for 2025 using growth rates and estimates provided by NHAI in their official project reports. These projected values act as the counterfactual baselines, which denote the traffic on Delhi-Gurgaon Expressway if Dwarka Expressway did not exist, as no provisions were made for this new expressway while the calculations were done. Counterfactual modelling has been used instead of taking another expressway as a control group or simply using Delhi-Gurgaon Expressway's real PCU figures due to time constraints and lack of necessary data. A counterfactual or baseline has also been used for Dwarka Expressway to simply observe whether traffic growth has been above or below the expected values. [13] and Consultancy services for project preparation for converting dual highway from km 14.3 to km 42.0 of NH-8 (Delhi-Gurgaon section) into an access-controlled highway (National Highways Authority of India & RITES, 2001) [14] The counterfactual Car PCU and Total PCU values for Delhi-Gurgaon Expressway, mentioned in Table 3 were estimated by NHAI in their project report, given till the year 2023 (from 2000). However, since Covid-19 from 2020-2021 led to complete travel restrictions, the values from those years and the growth witnessed would not represent the real situation. Therefore, the projected values of 2020 and 2021 have been adjusted to 2022 and 2023, allowing the values of 2022 and 2023 to act as substitutes till 2025. We assume traffic growth during 2020-21 remained 0 (if not negative) and continued to rise again from 2022. For Dwarka Expressway, projections are decadal starting from 2017, 2020, 2025, 2030 and so on. Total PCU flow projections were given and Car PCU flows were calculated on the basis of that. A ratio of number of cars per total vehicular flow was calculated from the traffic survey values given in the project report, which was multiplied to the total decadal projections yielding us the projected values for Car PCU flow for 2025. Actual values of Car PCUs and Total PCUs for Aug-Sept and Dec-Jan period are then subtracted from the projected values leading to the deviations. Deviations below projected figures indicate deviation of traffic from Delhi-Gurgaon Expressway or underperformance of the expressway, in the case of Dwarka Expressway. Vice versa, positive deviations represent an overburdened Delhi-Gurgaon expressway or above-expected performance on the Dwarka Expressway. Since traffic figures were collected at five different locations, three counterfactual analyses have been performed: 1) Comparing traffic in Delhi-Gurgaon Expressway's Delhi section and Dwarka Expressway's Dwarka (Delhi) section to their respective counterfactuals 2) Comparing traffic in Delhi-Gurgaon Expressway's Delhi section and Dwarka Expressway's Bharatal (Delhi) section to their respective counterfactuals 3) Comparing traffic in Delhi-Gurgaon Expressway's Gurgaon section and Dwarka Expressway's Gurgaon section to their respective counterfactuals
| Delhi-Gurgaon Expressway (Access-Controlled) | — |
|---|---|
| Projected Car PCU | Projected Total PCU |
| 137,042 | 457,447 |
| Dwarka Expressway Dwarka (Delhi) Section (Access Controlled) | |
| Projected Car PCU | Projected Total PCU |
| 53,553 | 71,602 |
| Dwarka Expressway Bharatal (Delhi) Section (Access Controlled) | |
| Projected Car PCU | Projected Total PCU |
| 74,837 | 103,940 |
| Dwarka Expressway Gurgaon Section (Access Controlled) | |
| Projected Car PCU | Projected Total PCU |
| 49,155 | 68,271 |
Table text extracted from the original PDF; superscript letters are shown inline. The original table image is below.
View original table image
The three different analyses allow us to better understand if Dwarka Expressway has led to traffic deviation in any of the three locations. Counterfactuals exist for each of the three survey points on Dwarka Expressway; however, a common counterfactual has been used for both Delhi-Gurgaon Expressway survey locations as Gurgaon's projection was made on the outskirts of the city, which will be an inappropriate estimate for the study. Based on deviations from projected traffic volumes, a complete difference-indifferences analysis is performed to assess how traffic on the Delhi-Gurgaon Expressway changed relative to the growth observed on the Dwarka Expressway after its opening, allowing for a comparative evaluation of traffic redistribution and induced demand across the two corridors.
Calculation for Difference-in-Differences:
where, 𝛥𝛼 = Total deviation on Delhi-Gurgaon Expressway 𝛥𝛽 = Total deviation on Dwarka Expressway 𝛥X 1 = Deviation from projection in Dec-Jan period 𝛥X 0 = Deviation from projection in Aug-Sept period (X is either 𝛼 or 𝛽) post-opening redistribution of traffic from the Delhi-Gurgaon Expressway to the Dwarka Expressway. While absolute traffic volumes on the Delhi-Gurgaon Expressway did not decline, its growth significantly underperformed relative to projections when compared to the rapid growth observed on the new corridor. The larger magnitude of total PCU DiD suggests systemwide diversion, while the negative Car PCU DiD confirms that private vehicle users were more responsive to the new capacity. This outcome is consistent with corridor substitution combined with induced demand on the Dwarka Expressway rather than pure congestion elimination. In the last case of Gurgaon sections of both expressways, Car PCUs declined by 3,000 and total PCUs by almost 20,000 on the Delhi-Gurgaon Expressway. Dwarka Expressway sees a massive growth of about 31,000 Car PCUs and 67,000 PCUs in total. Thus, a significant deviation of trucks and buses, which can also be seen from Figure 4. PCUs are seen in this part of the expressway. A Difference-in-Differences value of -87,979 PCUs for total flow indicates that, following the opening of the Dwarka Expressway, traffic on NH-48 fell substantially below projected levels while traffic on NH-244BB rose substantially above projections. The negative DiD and individual deviation analysis reflects a post-opening divergence in heavy vehicles along with allowing induced demand to act.
Results and Discussion
Results and Discussion
Deviations and difference in difference analyses
Deviations and difference in difference analyses
Conclusion
DiD analysis and deviation comparisons through three different counterfactual analyses has shown that substantial congestion relief on the Delhi-Gurgaon Expressway has only occurred in the Gurgaon section for heavy vehicles. Car PCU values remain unaffected with very minimal decreases and Dwarka Expressway mostly catering to new trips being generated from Najafgarh, Dwarka, Palam Vihar, Gurgaon sectors 90-120 etc. The Land Use and Land Cover (LULC) change analysis carried out for the study area further supports a causal relationship between the observed changes on NH-48 and the inauguration of the Dwarka Expressway. No new road networks or major development activities were recorded within the study period, strengthening the attribution of observed traffic changes to the opening of the expressway. This absence of parallel infrastructural or land development interventions reinforces the validity of the findings and confirms that the changes in traffic dynamics along NH-48 are a direct consequence of the Dwarka Expressway becoming operational.
Limitations of the study
Due to the absence of comprehensive and reliable recorded traffic data for the Delhi-Gurgaon Expressway, the study relies on projected traffic volumes provided by NHAI. While these projections are based on systematic modelling and incorporate anticipated future growth, the availability of ground-level traffic data at a finer, more disaggregated level would have significantly strengthened the analysis. Such data would have enabled more precise estimation of deviation values and allowed the analysis to be extended to additional vehicle categories, including trucks, buses, and motorcycles, which could not be examined in the present study. Similarly, frequent data points rather than a six-month gap will also improve the validity and reliability of the results discussed. The study also uses the projected figures as the counterfactual instead of a control expressway due to lack of available data which can be improved upon, strengthening causal inference.
Conflict of interests
The author whose name is listed certifies that they have NO affiliation with or involvement with any organisation or entity with any financial interest (such as grants or employment) or non-financial interest (such as personal relationship or affiliation) in the subject matter or materials discussed in this manuscript.
Figures and tables from the paper
| i) Deviations from Projection (Actual - Projection) | Deviations on NH-48 (Delhi Section) | — | Deviations on NH-244BB (Dwarka-Delhi Section) | — |
|---|---|---|---|---|
| Cars | Total | Cars | Total | |
| Aug-Sept | +35,993 | -39,539 | -20 | +10,791 |
| Dec-Jan | +32,914 | -3,476 | +38,124 | +65,022 |
| Difference-in-Differences for Total PCUs | [(-3,476) - (-39,539)] - (65,022 - 10,791) = -18,168 | |||
| Difference-in-Differences for Car PCUs | (32,914 - 35,993) - [38,124 - (-20)] = -41,223 | |||
| ii) Deviations from Projection (Actual - Projection) | Deviations on NH-48 (Delhi Section) | Deviations on NH-244BB (Bharatal-Delhi Section) | ||
| Cars | Total | Cars | Total | |
| Aug-Sept | +35,993 | -39,539 | -3,976 | +15,649 |
| Dec-Jan | +32,914 | -3,476 | +36,148 | +142,212 |
| Difference-in-Differences (Total PCUs) | [(-3,476) - (-39,539)] - (142,212 - 15,649) = -90,500 | |||
| Difference-in-Differences (Car PCUs) | (32,914 - 35,993) - [36,148 - (-3,976)] = -43,203 | |||
| iii) Deviations from Projection (Actual - Projection) | Deviations on NH-48 (Gurgaon Section) | Deviations on NH-244BB (Gurgaon Section) | ||
| Cars | Total | Cars | Total | |
| Aug-Sept | +31,988 | -21,987 | +4,874 | +21,889 |
| Dec-Jan | +28,980 | -41,972 | +35,467 | +89,883 |
| Difference-in-Differences (Total PCUs) | [(-41,972) - (-21,987)] - (89,883 - 21,889) = -87,979 | |||
| Difference-in-Differences (Car PCUs) | (28,980 - 31,988) - (35,467 - 4,874) = -33,601 |
Table text extracted from the original PDF; superscript letters are shown inline. The original table image is below.
View original table image
References
23 in the original paper- Bakirci M. Utilizing YOLOv8 for enhanced traffic monitoring in intelligent transportation systems (ITS) applications. Digit Signal Process. 2024;152:104594. DOI:10.1016/j.dsp.2024.104594.
- Chandra S, Gangopadhyay S, Velmurugan S, Ravinder K. Indian highway capacity manual (Indo-HCM). New Delhi: Central Road Research Institute; 2017.
- Das AK. Delhi-Gurgaon highway: Road to nowhere. The Times of India; 2003 Mar 13. Available from: https://timesofindia.indiatimes.com/delhi-times/delhigurgaon-highway-road-tonowhere/articleshow/40106061.cms
- Delhi Development Authority. Draft land use plan for Delhi 2041. 1 st ed. New Delhi: Delhi Development Authority; 2021.
- Department of Revenue & Disaster Management, Government of Haryana. Flood control order: District Gurugram. Chandigarh: Government of Haryana; 2021.
- Dutta A. PM's office may step in to resolve delays in Dwarka Expressway project. Hindustan Times; 2018 Nov 20. Available from: https://www.hindustantimes.com/delhi-news/pm-soffice-may-step-in-to-resolve-delays-in-dwarkaexpressway-project/story4YcA59KRIomL0Nw5Gb3FrN.htm
- GeoFabrik. OpenStreetMap data for Northern Zone, India. Karlsruhe: GeoFabrik; 2026. Available from: https://download.geofabrik.de/asia/india/northernzone.html
- Goldstein SR. Planning the millennium city: The politics of place-making in Gurgaon, India. Int Area Stud Rev. 2016;19(1):12-27. DOI:10.1177/2233865916628798.
- Kumar A. Delay in work on Northern Peripheral Road adds to commuter's woes on Delhi-Gurgaon expressway. India Today. 2012 Oct 3. Available from: https://www.indiatoday.in/india/north/story/delhigurgaon-expressway-northern-peripheral-road-delaycommuter-woes-117611-2012-10-02
- Kunekar P, Narule Y, Mahajan R, Mandlapure S, Mehendale E, Meshram Y. Traffic management system using YOLO algorithm. Eng Proc. 2023;59(1):210. DOI:10.3390/engproc2023059210.
- Kurle S, Behara KN, Prasad JR, Arkatkar S, Sarkar AK. Study of lane utilization on Delhi-Gurgaon Expressway. Transp Res Procedia. 2016;17:674-684. DOI:10.1016/j.trpro.2016.11.122.
- National Highways Authority of India, AECOM. Draft feasibility report including schedules to the concession agreement: Dwarka Expressway (NH 248-BB). New Delhi: National Highways Authority of India; 2017.
- National Highways Authority of India, RITES. Consultancy services for project preparation for converting dual highway from km 14.3 to km 42.0 of NH-8 (Delhi-Gurgaon section) into an access-controlled highway. New Delhi: National Highways Authority of India; 2001.
- Pathak AN, Pardeep, Yusuf, Kumar N. Traffic and volume study of Gurugram, Haryana. Int J Manag IT Eng. 2020;10(5).
- Puvvala R, Ponnu B, Arkatkar S, Velmurugan S. Estimating capacity for eight-lane divided urban expressway under mixed-traffic conditions using computer simulation. Int J Adv Eng Sci Appl Math. 2013;5(2-3):177-194. DOI:10.1007/s12572-013-0089-z.
- Rajagopalan S, Tabarrok AT. Lessons from Gurgaon, India's private city. Research Paper No. 14-32. Fairfax (VA): George Mason University, Department of Economics; 2014 Oct 24. DOI:10.2139/ssrn.2514652.
- Sachdev A. Gurugram: Massive traffic jam stalls Delhi suburb as rains wreak havoc. BBC News; 2025 Sep 2. Available from: https://www.bbc.com/news/articles/c5yeyg5n08jo
- Saxena A, Choudhury B. Internalising the externalities of urban private transport: A case of Gurugram, National Capital Region, India. Case Stud Transp Policy. 2022;10(3):1885-1897. DOI:10.1016/j.cstp.2022.08.002.
- Singh R. Gurgaon expressway: A project gone haywire. The Economic Times; 2010 Aug 27. Available from: https://economictimes.indiatimes.com/news/economy/i nfrastructure/gurgaon-expressway-a-project-gonehaywire/articleshow/6442946.cms
- Som V. NDTV report: Can Dwarka Expressway end Delhi-Gurugram traffic nightmares? NDTV. 2025 Aug 19. Available from: https://www.ndtv.com/indianews/ndtv-report-can-dwarka-expressway-end-delhigurugram-traffic-nightmares-9113520
- Ultralytics. Ultralytics YOLO11. Ultralytics YOLO Docs; 2026 Jan 20. Available from: https://docs.ultralytics.com/models/yolo11/
- U.S. Geological Survey. Landsat 9 Level-2 data. Reston (VA): U.S. Geological Survey; 2026. Available from: https://www.usgs.gov/landsat-missions/landsat-9
- Yasmoon Z, Saud A. Urban flood disasters and mitigation practices: Cases of Srinagar, Gurugram and Chennai; 2025. Available from: https://www.academia.edu/33585369