
Research article · 2026 · Full text
International Journal of Geography Geology and EnvironmentSpatial analysis of spring water resources and village water security in Devalgarh Nyaya Panchayat of Khirsu Block, Pauri Garhwal, Uttarakhand
Volume 8(6) · Pages 109–116 · DOI: 10.22271/27067483.2026.v8.i6b.791 ↗
Research areasWater Resource Management and QualityGroundwater and Watershed AnalysisWater resources management and optimization
Abstract
Author-writtenSprings are the primary source of drinking water and domestic water supply for Himalayan Mountain communities, yet many are declining due to climate variability, land-use change, and reduced recharge. This study presents a comprehensive spring inventory and water budget assessment for 25 villages in Devalgarh Nyaya Panchayat, Khirsu block, Pauri Garhwal district, Uttarakhand. Field surveys were conducted during the pre-monsoon season. Village-level water demand was estimated using Jal Jeevan Mission standards and compared with measured spring discharge to evaluate water availability. Results revealed significant spatial variation. GIS-based mapping highlighted the uneven distribution of spring resources and the dependence of several villages on external piped supply, which remains unreliable during lean seasons. Household surveys further underscored the socio-economic burden of water scarcity, particularly on women and elderly members. The findings provide baseline data for local water security planning and sustainable management of spring-fed systems. The methodology offers a replicable framework for decentralised water resource assessment in other Himalayan regions.
Summary
Source-checkedPlain-language reading of the full paper, prepared with AI and checked against the text. Each point links to the authors' own words.
Why it matters
- Springs are the main source of domestic and drinking water for communities in the Himalayas, but they are currently declining because of land-use changes, reduced recharge, and climate variability. View evidence ↗
- Approximately 60% of Himalayan residents rely on spring water, but half of the perennial springs have become seasonal or dried up, causing severe water shortages. View evidence ↗
- Measuring the amount of water flowing from springs is essential for understanding water availability in rural areas and creating sustainable management plans. View evidence ↗
What they did
- The research was conducted across 25 villages in the Devalgarh Nyaya Panchayat, which had a population of 1,737 people according to 2011 census data. View evidence ↗
- Spring discharge was measured using a volumetric method, where the time to fill a one-litre container was recorded three times per spring to calculate an average. View evidence ↗
- Domestic water demand was calculated using the Indian Government's Jal Jeevan Mission standard of 55 litres per person per day. View evidence ↗
- The water budget for each village was determined by subtracting the estimated domestic water demand from the total available spring discharge. View evidence ↗
What they found
- Out of the 25 villages studied, the researchers identified 12 active springs and 6 dry springs. View evidence ↗
- Ten villages (Sankholi, Ratura, Toulyu, Gawad, Reitpur, Katakholi, Gairu, Rampur, Badarpur, and Bugani) have no springs and rely entirely on external pipelines. View evidence ↗
- The measured discharge rates for active springs ranged from a minimum of 0.63 to a maximum of 15.77 litres per minute. View evidence ↗
- The highest water discharge was found in Balodi village, while the lowest was recorded in Maroda village. View evidence ↗
- During the pre-monsoon period, seven villages (Kanda, Mallimandoli, Mundoli, Maletha, Gawana, Balodi, and Jhala) had a water surplus, while five (Maroda, Jogdi, Koltha, Bhenskot, and Markhoda) had a deficit. View evidence ↗
- There is no consistent relationship between elevation and spring discharge; for instance, Bhenskot and Markhoda have low discharge despite their elevations of 1368m and 1401m. View evidence ↗
- Household surveys revealed that irregular water supply places a significant socio-economic burden on women and elderly family members who must fetch water. View evidence ↗
What it means
- The presence of dry springs suggests that groundwater resources are under pressure from land-use changes and reduced recharge, highlighting the need for ongoing monitoring. View evidence ↗
- The authors conclude that their methodology can be used in other Himalayan villages to help with decentralized water planning and sustainable management. View evidence ↗
- Future work is needed to monitor discharge across all seasons, assess the water quality of all active springs, and use GIS for spring shed delineation. View evidence ↗
Visual summary
3 visualsIllustrations explain the paper; charts are replotted from the paper's own table values.
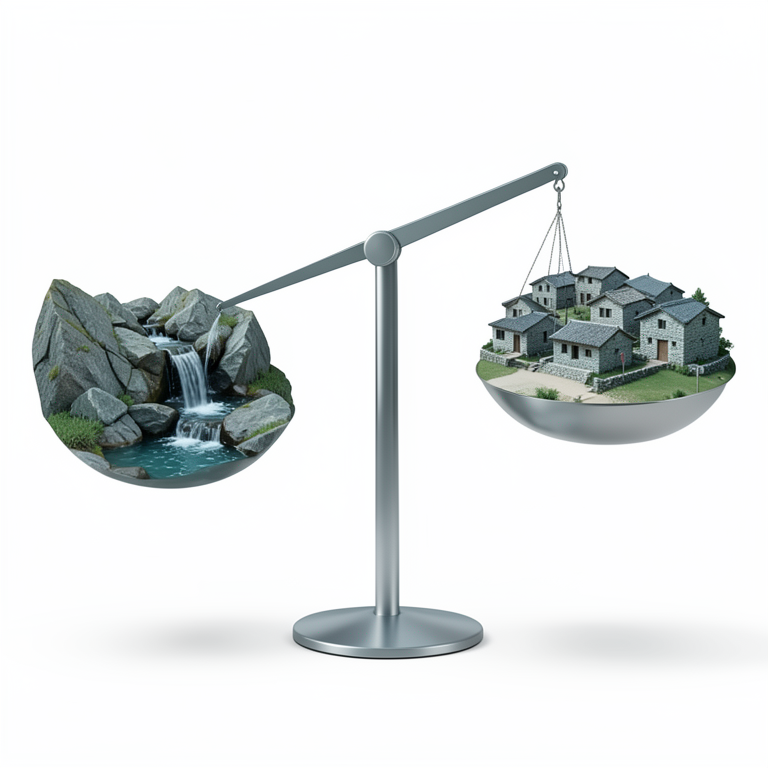
Water Budget Concept
AI-generated conceptual illustration (Himalayan mountain village with natural springs). It explains the idea and does not show study data.
View source evidence ↗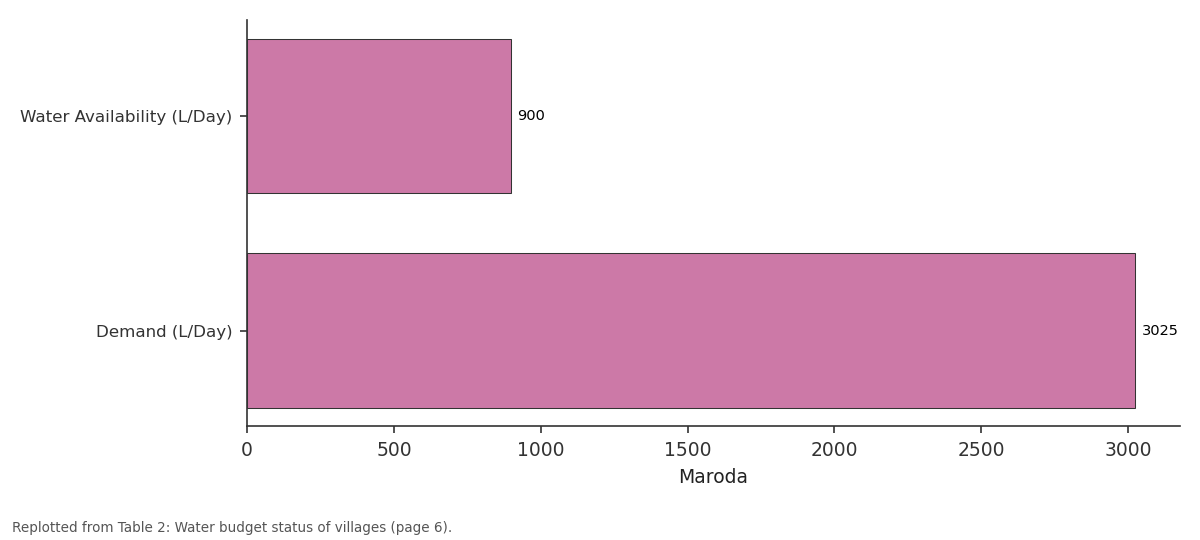
Maroda: Water Availability... vs Demand (L/Day)
Replotted from Table 2 (page 6) of the original paper. Every bar is the paper's own table value.
View source evidence ↗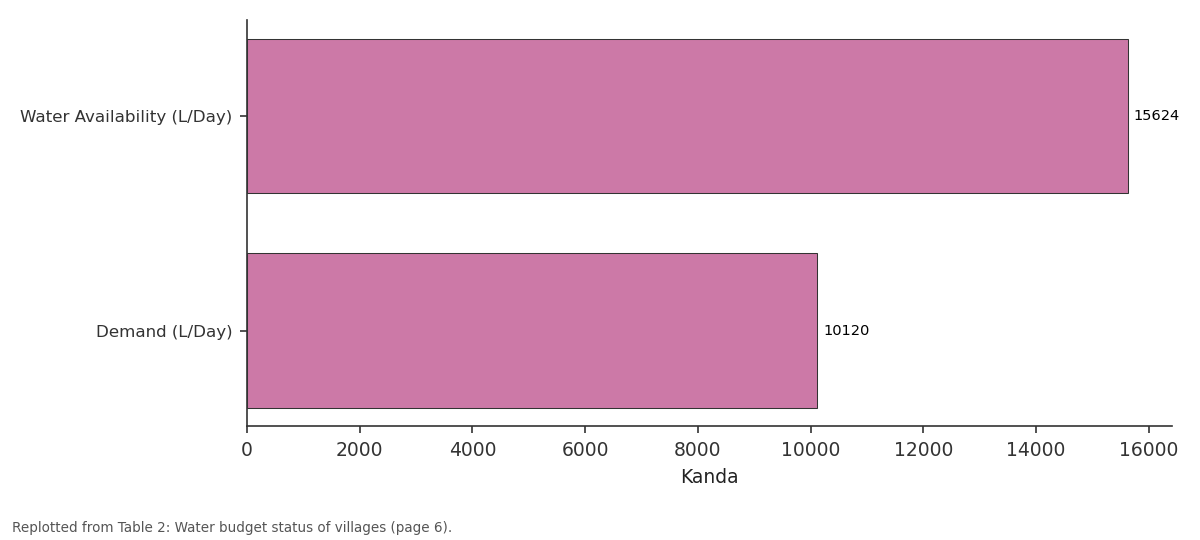
Kanda: Water Availability... vs Demand (L/Day)
Replotted from Table 2 (page 6) of the original paper. Every bar is the paper's own table value.
View source evidence ↗Figures & tables
From the original paper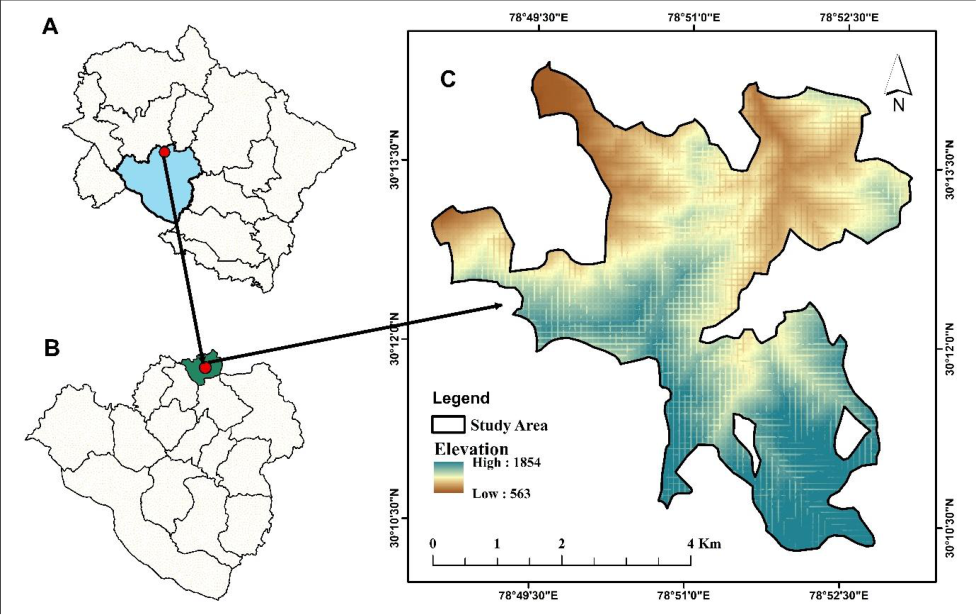 Figure 1
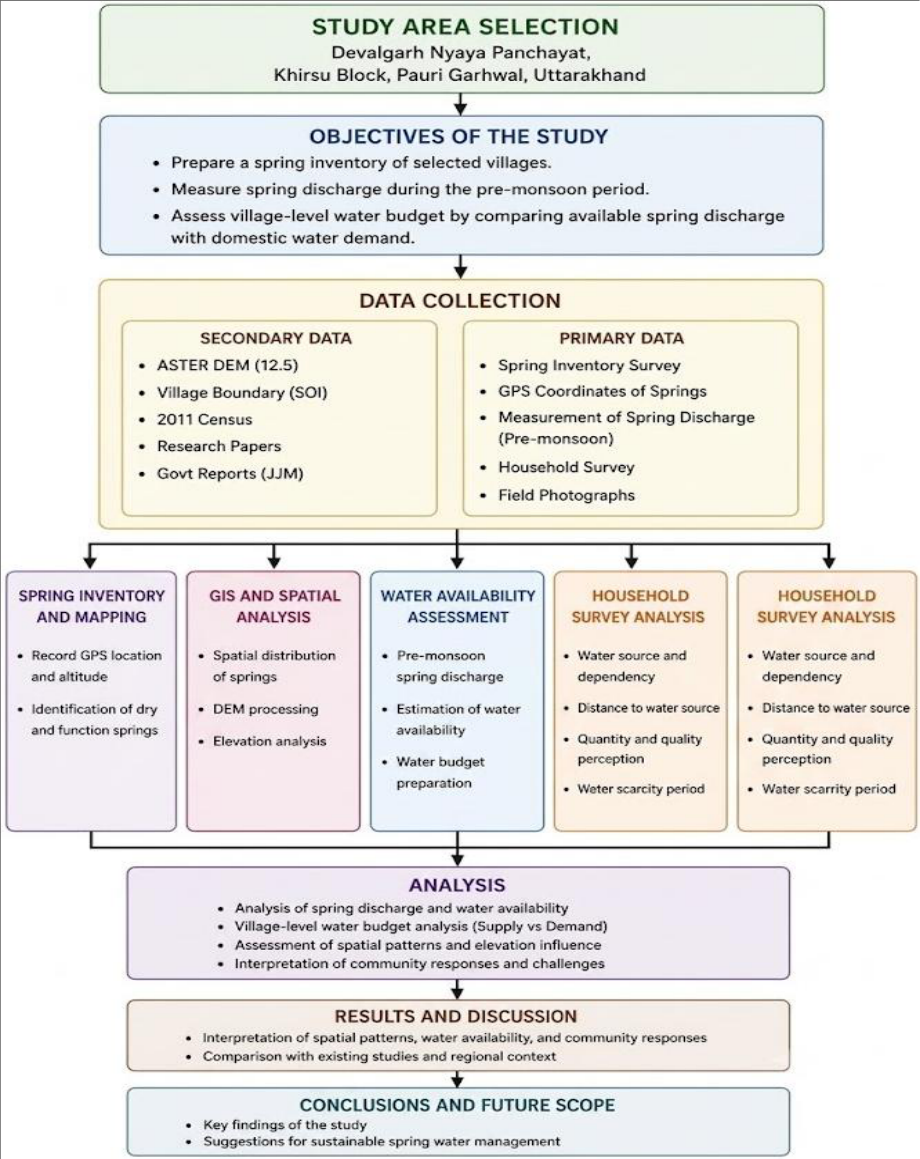 Figure 2
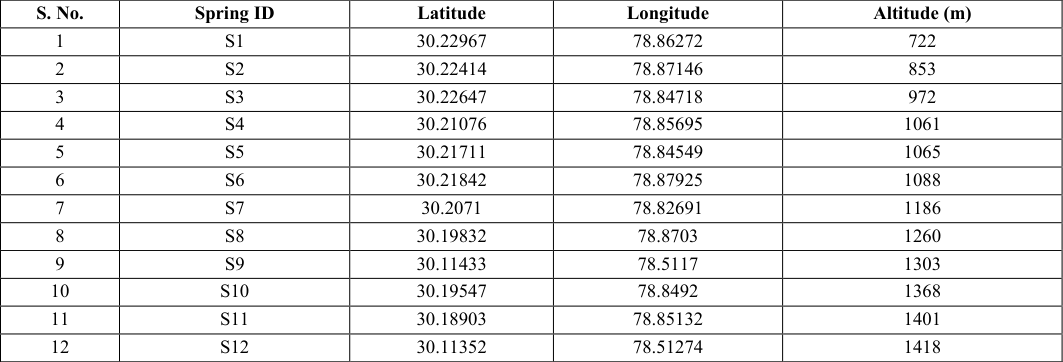 Table 1
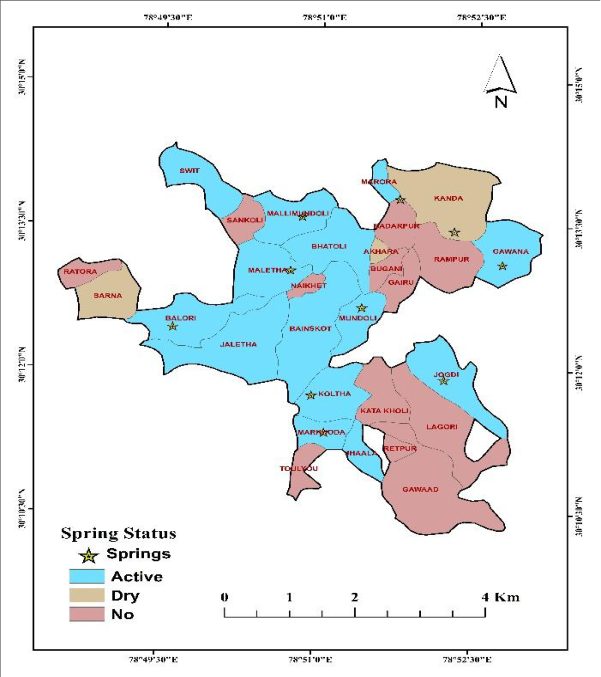 Figure 3
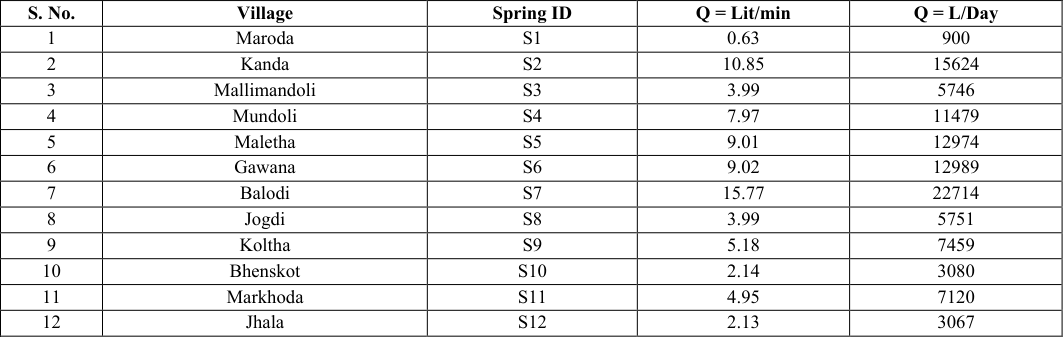 Table 2
 Table 1
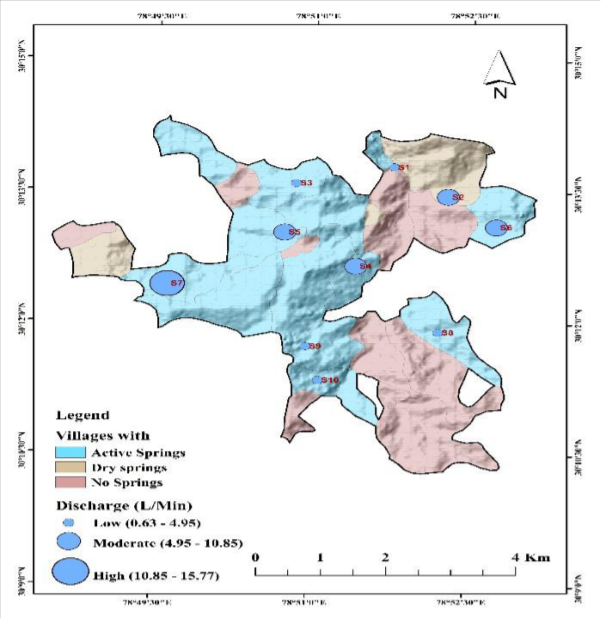 Figure 4
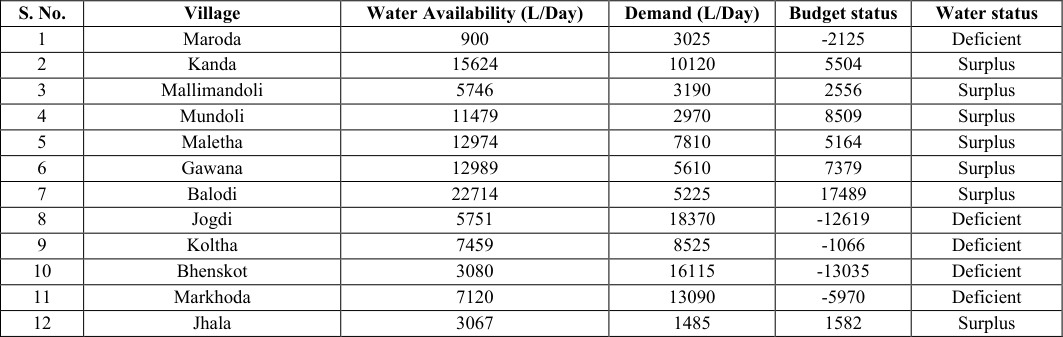 Table 2
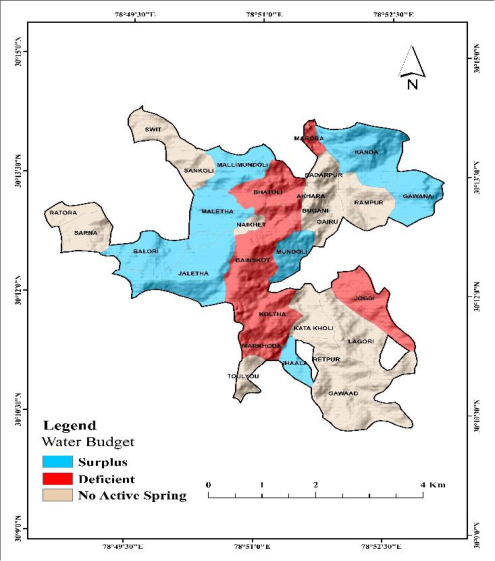 Figure 5
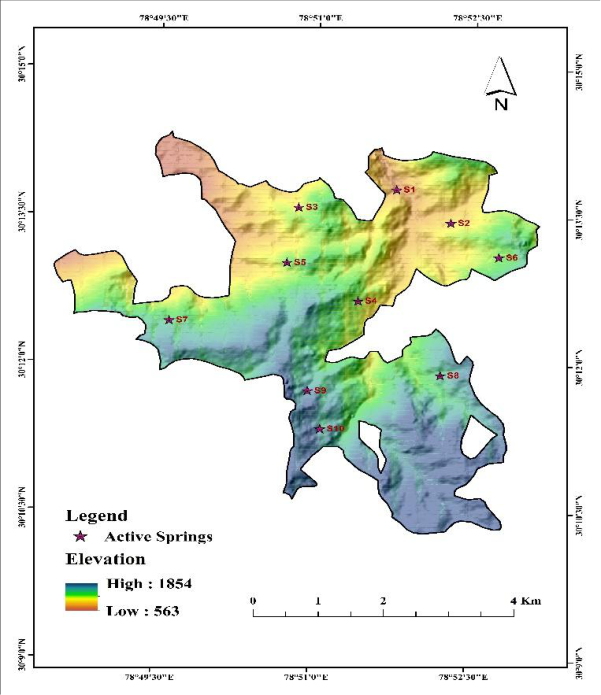 Figure 6
Introduction
Springs are the naturally occurring primary water source for drinking, domestic, and agricultural use for the mountain communities. They are groundwater discharge points where the stratified zone of the aquifer intersects the surface and water seeps from rock pores, fissures, fractures, or depressions (Akhtar, N., Syakir, M. I., Anees, M. T., Qadir, A., & Yusuff, M. S. 2020) [1] . Mountain springs are the primary source of water for rural households in the Himalayan region. For many communities, springs are the sole source of drinking water, irrigation, and livestock needs. Early in the 60% of residents in the Himalayas depend on spring water, yet surveys show that half of the perennial springs have already dried up or become seasonal, leading to acute water shortages across thousands of villages (Bishwadeep Ghose, Arghyam Shri Vinod Kothari, Tata Trusts et al., 2018) [2] . These springs are at risk of drying up or diminishing during the lean season due to climate variability, climate change, and land-use changes across the catchment (Singh Thapa Chitra, 2023) [3] . The historical origins of springs are familiar to local inhabitants. They refer to them as Khals, Chal, Gharats, and Naulas. According to Srivastava et al. (2025) [4] , in Indian Himalayan communities, between 60% and 70% of the population depends directly on springs for domestic and livelihood needs. Additionally, springs are highly valued in these communities for cultural and religious reasons. The quantitative assessment of spring discharge is fundamental for characterising water availability in rural settlements and for formulating sustainable water resources management strategies (Daniel et al., 2021) [5] . Systematic spring inventory investigations yield critical information on the spatial distribution, discharge dynamics, utilisation, and socio-economic relevance of springs. These data are indispensable for determining the extent to which existing spring-fed water resources can meet local communities' domestic water demands. Water budgeting is an important tool for assessing the balance between water availability and water demand within a settlement. By comparing spring discharge with the prescribed domestic water requirement, potential water surplus or deficit conditions can be identified. The integration of spring discharge measurements with village population data, therefore, provides a scientific basis for evaluating water security and planning future interventions (Kim et al., 2021) [6] . Basically, this study provides details on the pre-monsoon season, which is the most critical period for springs because groundwater recharge from the monsoon has diminished. Thus, discharge measurements during this time provide a realistic estimate of water availability under stressed conditions. The Indian Meteorological Department classifies the pre-monsoon season as the period from March to May, characterised by increased temperature and reduced water availability in the May Himalayan regions. This study aims to 1) Prepare a spring inventory of selected villages, 2) Measure spring discharge during the pre-monsoon period, and 3) Assess village-level water budget by comparing available spring discharge with domestic water demand.
The findings are expected to contribute to sustainable water resource planning and spring conservation in the study area.
Study area
This study was conducted in Devalgarh Nyaya Panchayat, located at a longitude of 87.52'30E to 78.49'30" E and a latitude of 30.10'30" N to 30.13'30" N within the Khirsu Community Development Block of Pauri Garhwal district, Uttarakhand, India. Pauri Garhwal is one of the hilly districts of the Garhwal Division of Uttarakhand, covering an area of 5,230 sq km, which is nearly 10.7% of the state's total geographical area. According to the 2011 population census, Devalgarh Nyaya Panchayat has a total population of 1,737 persons distributed across 25 villages. This region is characterised by a subtropical to temperate climate, with seasonal variation in rainfall and temperature influencing water availability.
Discharge measurement
Spring discharge was measured in March and April, which represent the period of minimum water availability. The volumetric method was employed to estimate the discharge.
A container volume of one litre was filled directly from the spring outlet, and the time required to fill the container was recorded using a stopwatch. Three observations were taken at each spring for the average time discharge calculation.
The discharge rate was calculated as: Q = V/T, where Q is the discharge rate in litres per second, V is the volume of the container in litres, and T is the time taken to fill the container.
The resulting discharge values were subsequently converted into litres per minute (L/min) and litres per day (L/Day).
Water budget analysis
The village water budget was assessed by comparing the total available spring discharge with the estimated domestic water demand. In villages having more than one spring, the discharge of all springs was summed to determine total water availability.
Village Water Budget = Water availability -Water demand A positive value indicates water surplus, while a negative value indicates water deficit.
GIS mapping and spatial analysis
The spatial distribution of the springs was mapped in ArcGIS by converting marked locations to point features using geographic coordinates. Village boundaries were downloaded from the Survey of India Portal. Elevation and the other data were integrated into a GIS environment. Graduated symbols were prepared to represent variation in each spring discharge. Spatial interpolation techniques were also used to visualise the distribution of discharge across the study area.
Result and Discussion
This assessed the existing water availability in the area. The primary focus of this study was to locate and map existing spring sources and their status in terms of water discharge and water budget for villages during the premonsoon period in Devalgarh Nyaya Panchayat. 1). One spring in the village of Sarna and Akhara has dried up, while 3 springs in the village of Kanda have also dried up. While 10 villages named Sankholi, Ratura, Toulyu, Gawad, Reitpur, Katakholi, Gairu, Rampur, Badarpur, and Bugani do not have any springs. They totally depend on the pipeline connected to springs in another village or to the Srinagar town, primarily serving the surrounding villages through the PM Jal Yojna. But during the lean season, all the villages faced severe water scarcity. 2). The highest discharge was recorded at Balodi (S7) village, whereas the lowest discharge was observed at spring ID S1 at village Maroda. This variation in discharge may be attributed to differences in the slope characteristics, vegetation cover, and groundwater storage capacity. Conversely, Balodi and Kanda show higher discharge rates.
The shows that the concentration of active springs within the low-and moderate-elevation zones has good hydrogeological conditions for groundwater energy.
Challenges faced by villagers
The author conducted an intensive household survey to document the issues faced by local communities. Five household respondents from each village reported irregular water supply, which relies on a distant water source and increases the time required for daily water collection. But some villages don't even have a tap water supply, and there is severe water scarcity, particularly in the pre-monsoon lean season. The major problem is that the increased burden on women and elderly family members, who are primarily responsible for fetching water. Villages like Ratura, Akhara, Badarpur, and Sarna depend on tanks during periods of acute scarcity. An example of inadequate spring management was observed in Bhainskot village, where a spring-fed water supply system connected to the Naulli, but the structure was poorly designed and maintained. As a result, spring water was partially exposed, leading to increased turbidity and deteriorating water quality over time, yet people had to use this water for domestic purposes. All this information highlights that spring degradation is not only a hydrological issue but also a socioeconomic challenge. Water quality assessment of all active springs. Spring shed delineation using GIS so that planning and execution can be done for already dry springs and for the springs that are reducing with time.
Figures and tables from the paper
| S. No. | Spring ID | Latitude | Longitude | Altitude (m) |
|---|---|---|---|---|
| 1 | S1 | 30.22967 | 78.86272 | 722 |
| 2 | S2 | 30.22414 | 78.87146 | 853 |
| 3 | S3 | 30.22647 | 78.84718 | 972 |
| 4 | S4 | 30.21076 | 78.85695 | 1061 |
| 5 | S5 | 30.21711 | 78.84549 | 1065 |
| 6 | S6 | 30.21842 | 78.87925 | 1088 |
| 7 | S7 | 30.2071 | 78.82691 | 1186 |
| 8 | S8 | 30.19832 | 78.8703 | 1260 |
| 9 | S9 | 30.11433 | 78.5117 | 1303 |
| 10 | S10 | 30.19547 | 78.8492 | 1368 |
| 11 | S11 | 30.18903 | 78.85132 | 1401 |
| 12 | S12 | 30.11352 | 78.51274 | 1418 |
Table text extracted from the original PDF; superscript letters are shown inline. The original table image is below.
View original table image
| S. No. | Village | Spring ID | Q = Lit/min | Q = L/Day |
|---|---|---|---|---|
| 1 | Maroda | S1 | 0.63 | 900 |
| 2 | Kanda | S2 | 10.85 | 15624 |
| 3 | Mallimandoli | S3 | 3.99 | 5746 |
| 4 | Mundoli | S4 | 7.97 | 11479 |
| 5 | Maletha | S5 | 9.01 | 12974 |
| 6 | Gawana | S6 | 9.02 | 12989 |
| 7 | Balodi | S7 | 15.77 | 22714 |
| 8 | Jogdi | S8 | 3.99 | 5751 |
| 9 | Koltha | S9 | 5.18 | 7459 |
| 10 | Bhenskot | S10 | 2.14 | 3080 |
| 11 | Markhoda | S11 | 4.95 | 7120 |
| 12 | Jhala | S12 | 2.13 | 3067 |
Table text extracted from the original PDF; superscript letters are shown inline. The original table image is below.
View original table image
| S. No. | Village | Population | Water availability (L/Day) | Demand (L/Day) |
|---|---|---|---|---|
| 1 | Maroda | 55 | 900 | 3025 |
| 2 | Kanda | 184 | 15624 | 10120 |
Table text extracted from the original PDF; superscript letters are shown inline. The original table image is below.
View original table image
| S. No. | Village | Water Availability (L/Day) | Demand (L/Day) | Budget status | Water status |
|---|---|---|---|---|---|
| 1 | Maroda | 900 | 3025 | -2125 | Deficient |
| 2 | Kanda | 15624 | 10120 | 5504 | Surplus |
| 3 | Mallimandoli | 5746 | 3190 | 2556 | Surplus |
| 4 | Mundoli | 11479 | 2970 | 8509 | Surplus |
| 5 | Maletha | 12974 | 7810 | 5164 | Surplus |
| 6 | Gawana | 12989 | 5610 | 7379 | Surplus |
| 7 | Balodi | 22714 | 5225 | 17489 | Surplus |
| 8 | Jogdi | 5751 | 18370 | -12619 | Deficient |
| 9 | Koltha | 7459 | 8525 | -1066 | Deficient |
| 10 | Bhenskot | 3080 | 16115 | -13035 | Deficient |
| 11 | Markhoda | 7120 | 13090 | -5970 | Deficient |
| 12 | Jhala | 3067 | 1485 | 1582 | Surplus |
Table text extracted from the original PDF; superscript letters are shown inline. The original table image is below.
View original table image
References
6 in the original paper- Akhtar N, Syakir MI, Anees MT, Qadir A, Yusuff MS. Characteristics and assessment of groundwater. In: Groundwater management and resources. London: IntechOpen; 2020.
- NITI Aayog. Inventory and revival of springs in the Himalayas for water security. New Delhi: Department of Science and Technology, Government of India; 2017.
- Singh Thapa Chitra R. The implication of hydrogeological mapping and recharge structures to revive drying springs in hilly region of Nepal. Int J Sci Res (IJSR). 2023;12(5):2026-2032. DOI:10.21275/SR23522075701.
- Srivastava P, Dubey S, Singh S. Sustaining Himalayan springs amidst the emerging water crisis. 2025;13:5.
- Daniel D, Anandhi A, Sen S. Conceptual model for the vulnerability assessment of springs in the Indian Himalayas. Climate. 2021;9(8). DOI:10.3390/cli9080121.
- Kim GB, Hwang CI, Choi MR. Assessment of the need and potential for groundwater artificial recharge based on the water supply, water demand, and aquifer properties in a water shortage region of South Korea. Environ Earth Sci. 2021;80(3). DOI:10.1007/s12665021-09445-5.