
Research article · 2026 · Full text
International Journal of Biology SciencesAssessment of consumption patterns of High-Fat, Salt and Sugar (HFSS) foods and their nutritional implications among adolescent girls aged 18–21 years in Dhanbad district, Jharkhand
Volume 8(6) · Pages 187–191 · DOI: 10.33545/26649926.2026.v8.i6c.881 ↗
Research areasNutrition, Health and Food BehaviorConsumer Attitudes and Food LabelingObesity, Physical Activity, Diet
Abstract
Author-writtenBackground: High Fat, Salt, and Sugar (HFSS) foods are increasingly replacing traditional and nutritionally balanced diets among adolescents due to urbanization, modernization, changing food environments, peer influence, and extensive marketing of processed foods. Excessive consumption of HFSS foods is associated with poor dietary quality, overweight, obesity, and an increased risk of non-communicable diseases. Objective: The study aimed to assess the consumption pattern of HFSS foods and evaluate their nutritional implications among adolescent girls aged 18–21 years in Dhanbad district, Jharkhand. Methods: A cross-sectional descriptive study was conducted among 220 adolescent girls selected from colleges and urban communities. Data were collected using a pre-tested semi-structured questionnaire, Food Frequency Questionnaire (FFQ), anthropometric measurements, and lifestyle assessment schedules. Consumption frequencies of high-fat, high-sugar, high-salt, and ultra-processed foods were assessed and analyzed using descriptive statistics and chi-square analysis. Results: The findings revealed a high prevalence of HFSS food consumption among the participants. Ultra-processed foods showed the highest mean consumption score (2.54 ± 0.67), followed by high-salt foods (2.30 ± 0.64), high-sugar foods (2.15 ± 0.73), and high-fat foods (2.08 ± 0.69). The overall HFSS consumption score was 2.27 ± 0.54, indicating moderate-to-high intake levels. A statistically significant difference was observed in consumption frequencies across HFSS food categories (χ² = 28.74, df = 6, p < 0.001). Frequent HFSS food intake was associated with sedentary lifestyle, increased screen time, irregular meal patterns, and a higher prevalence of malnutrition. Conclusion: HFSS food consumption is highly prevalent among adolescent girls and poses significant nutritional and public health concerns. Nutrition education, promotion of indigenous and traditional healthy foods, and behavior-change interventions are needed to encourage healthier dietary choices and improve nutritional well-being.
Summary
Source-checkedPlain-language reading of the full paper, prepared with AI and checked against the text. Each point links to the authors' own words.
Why it matters
- Traditional, balanced diets in adolescents are being replaced by High Fat, Salt, and Sugar (HFSS) foods due to factors like urbanization and marketing. View evidence ↗
- Eating too many HFSS foods is linked to poor diet quality, obesity, and a higher risk of non-communicable diseases. View evidence ↗
- Girls aged 18–21 are especially susceptible to unhealthy eating habits because of academic stress and a reliance on outside food. View evidence ↗
The question
- The study sought to determine how adolescent girls (18–21 years) in Dhanbad, Jharkhand, consume HFSS foods and what the nutritional consequences are. View evidence ↗
What they did
- The researchers used a cross-sectional descriptive design involving 220 adolescent girls from urban communities and colleges. View evidence ↗
- Data collection tools included a semi-structured questionnaire, a Food Frequency Questionnaire (FFQ), lifestyle assessments, and anthropometric measurements. View evidence ↗
- The study analyzed the frequency of consumption for high-fat, high-sugar, high-salt, and ultra-processed foods using chi-square analysis and descriptive statistics. View evidence ↗
What they found
- Ultra-processed foods were consumed most frequently (mean score 2.54 ± 0.67), followed by high-salt (2.30 ± 0.64), high-sugar (2.15 ± 0.73), and high-fat foods (2.08 ± 0.69). View evidence ↗
- The overall mean consumption score for HFSS foods was 2.27 ± 0.54, which indicates a moderate-to-high level of intake. View evidence ↗
- Breakfast was the most common meal skipped (45.9%), compared to lunch (11.8%) and dinner (5.0%). View evidence ↗
- Overweight and obesity rates rose as HFSS consumption increased, climbing from 20.0% in low consumers to 82.0% in high consumers. View evidence ↗
- HFSS food consumption was significantly associated with high social media influence, peer pressure, increased screen time, and shorter sleep duration. View evidence ↗
- Positive correlations were found between social media influence and HFSS intake (r=0.42) and screen time and BMI (r=0.38), while sleep duration was negatively correlated with BMI (r=-0.29). View evidence ↗
What it means
- The authors conclude that it is necessary to reduce HFSS food intake and promote nutritious, traditional, and home-cooked meals to improve adolescent health. View evidence ↗
- The authors recommend using nutrition education, school programs, parental guidance, and active lifestyles to improve dietary behaviors. View evidence ↗
Visual summary
1 visualsIllustrations explain the paper; charts are replotted from the paper's own table values.
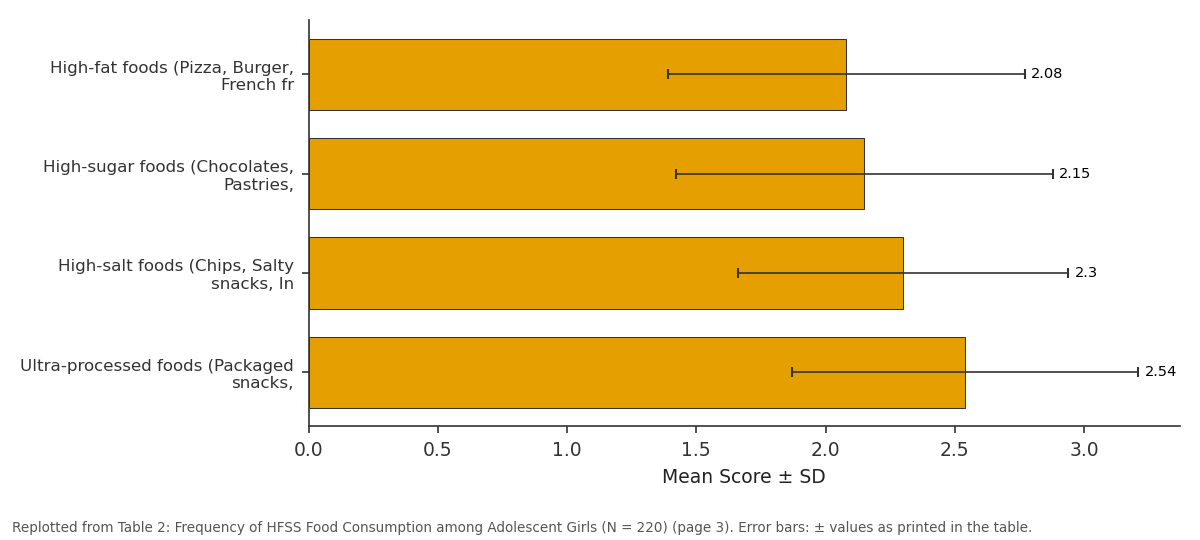
Mean Score ± SD: High-fat foods (Pizza... vs High-sugar foods... vs High-salt foods (Chips... vs Ultra-processed foods...
Replotted from Table 2 (page 3) of the original paper. Every bar is the paper's own table value.
View source evidence ↗Figures & tables
From the original paper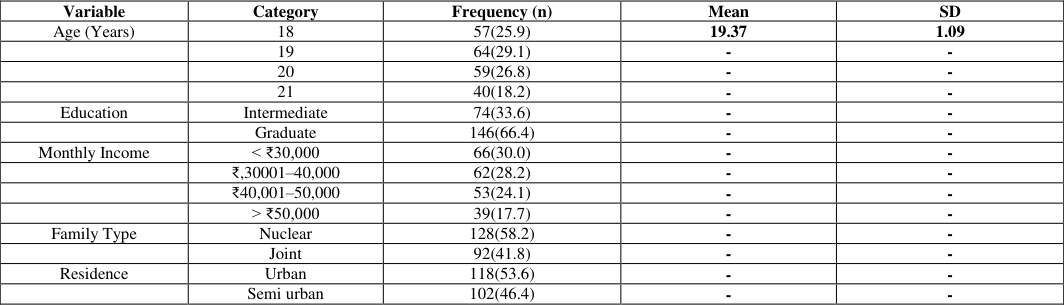 Table 1
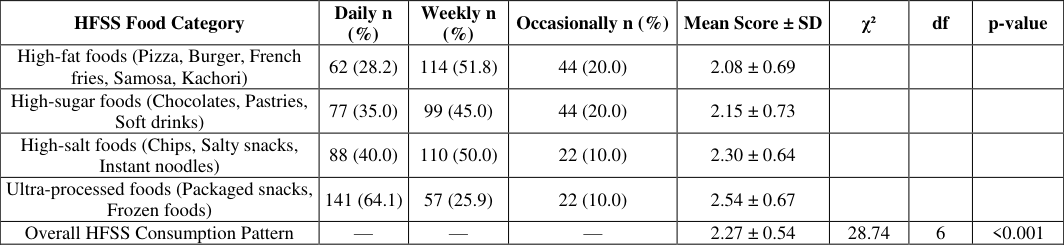 Table 2
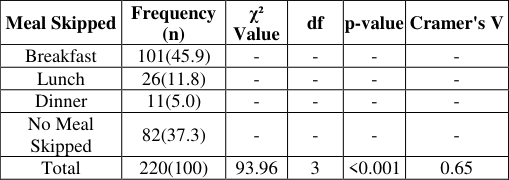 Table 3
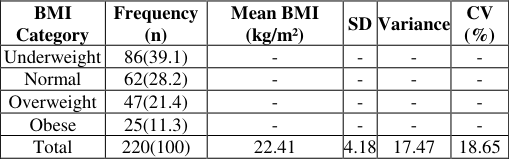 Table 4
 Table 5
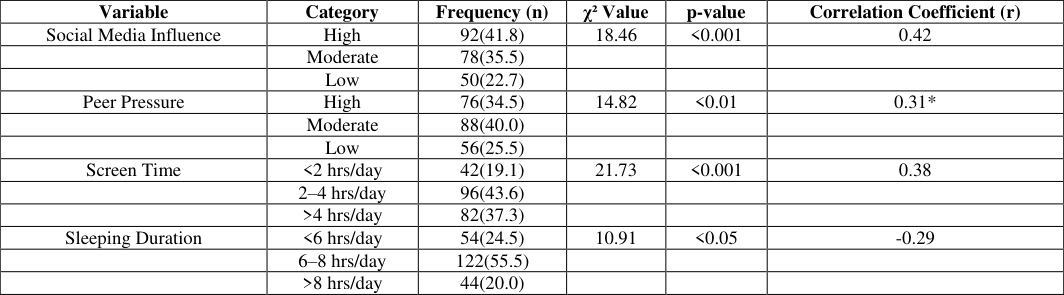 Table 6
Introduction
Adolescence is a crucial phase of growth and development characterized by rapid physical, physiological, psychological, and emotional changes. Adequate nutrition during this period is essential for proper growth, reproductive health, cognitive development, and prevention of chronic diseases in later life. However, rapid urbanization, westernization of diets, and changing lifestyles have led to increased consumption of High Fat, Salt and Sugar (HFSS) foods among adolescents. HFSS foods are rich in saturated fats, trans fats, salt, and added sugars while being poor in essential nutrients such as vitamins, minerals, fiber, and protein.
Common examples include burgers, pizzas, instant noodles, fried snacks, chips, sugary beverages, chocolates, candies, pastries, and processed packaged foods. The aggressive marketing of processed foods, increased screen exposure, sedentary lifestyle, peer influence, and easy availability of junk foods have contributed significantly to unhealthy eating habits among adolescents. Girls in the age group of 18-21 years are particularly vulnerable due to academic stress, irregular meal patterns, body image concerns, and increased dependence on outside foods. Excessive consumption of HFSS foods contributes to obesity, hypertension, diabetes, cardiovascular diseases, micronutrient deficiencies, anemia, and metabolic disorders. Excessive consumption of such foods contributes to overweight, obesity, hypertension, insulin resistance, dyslipidemia, cardiovascular diseases, and type-2 diabetes mellitus. Furthermore, frequent HFSS intake can lead to micronutrient deficiencies, poor gut health, reduced immunity, and impaired academic performance among adolescents. Since adolescent girls are future mothers, poor dietary habits may affect maternal and child health outcomes in future generations. Popkin (2020) [11] reported that increasing urbanization and dietary transition have led to greater intake of processed and HFSS foods among adolescents. A study by Arya and Dubey (2024) [1] found that frequent fast-food consumption among Indian adolescents contributed to overweight, obesity, and poor dietary quality. Similarly, Kalita et al. (2024) [7] observed that adolescents from higher socioeconomic groups consumed more HFSS foods such as fried snacks, sweets, and aerated drinks, which were associated with increased obesity and cardiovascular risk biomarkers. Kamboj and Toteja (2019) [8] reported that taste preference, peer influence, affordability, and easy availability significantly influenced the frequency of HFSS food consumption among adolescents in urban India. A study conducted in Lucknow by researchers in 2024 revealed that adolescents had inadequate intake of proteins, fruits, and micronutrients, whereas fat intake was significantly higher than the recommended dietary allowances. Rathi et al. (2017) [12] also documented that urban Indian adolescents increasingly replaced traditional home-cooked meals with processed and ready-to-eat foods, leading to poor dietary diversity and higher risk of chronic diseases. Therefore, the present study was undertaken to assess HFSS food consumption patterns and evaluate their nutritional implications among adolescent girls aged 18-21 years. Several studies have reported increasing consumption of fast foods and processed foods among adolescents. Research conducted among Indian adolescents revealed high intake of sugary beverages, fried snacks, and bakery products, along with low consumption of fruits and vegetables. Studies have shown that adolescents consuming HFSS foods frequently are more likely to develop overweight and obesity due to excess calorie intake and reduced physical activity. Frequent consumption of soft drinks and sugary snacks is also associated with insulin resistance and metabolic syndrome. Research among college-going girls found that meal skipping, especially breakfast skipping, is positively associated with increased consumption of junk foods and sugary beverages. Emotional eating, stress, peer pressure, and social media influence further contribute to unhealthy eating habits. Existing literature indicates a strong relationship between HFSS food intake and poor dietary quality among adolescents, emphasizing the need for nutritional awareness and dietary modifications.
Objectives
• To assess the HFSS food consumption pattern.
• To evaluate the nutritional implications in adolescent girls.
Materials and Methods
Study Design: A cross-sectional descriptive research design was adopted to assess HFSS food consumption pattern, related factors and their impact on nutritional status of adolescent girls.
Study Area
The study was carried out in Dhanbad, Jharkhand. The district was selected due to its urban and semi urban population, diverse socioeconomic characteristics, and changing dietary practices among adolescents. Dhanbad is located in the north-eastern part of the state between 23.795399° N latitude and 86.427040° E longitude. The district covers an area of 2,886 sq. km and comprises 10 administrative blocks and 1,209 villages. According to the Census 2011, Dhanbad has a population of 2,846,954, including 1,498,305 males and 1,348,649 females, with a population density of 1,300 persons per sq. km. Owing to its urban-industrial environment, diverse socio-economic characteristics, and large adolescent population, Dhanbad provides a suitable setting for studying HFSS food consumption patterns and nutritional status among adolescent girls.
Study Population
The study population comprised adolescent girls aged 18-21 years residing in the selected areas of Dhanbad district during the study period. The respondents were selected by Purposive random sampling technique.
Sample Size
A total of 220 adolescent girls were included in the study. The sample size was considered adequate to assess HFSS food consumption patterns and related nutritional outcomes among the target population.
Sampling Technique
A simple random sampling technique was employed for the selection of respondents. IN the first stage selected urban and semi urban localities of Dhanbad district were identified. In the second stage, households having eligible adolescent girls aged 18-21 years were listed.
Data collection
Data were collected using a pretested semi-structured questionnaire covering socio-demographic characteristics, HFSS food consumption frequency, meal skipping behaviour, Social media influences, peer pressure, Lifestyle assessment, Anthropometric measurements including height and weight were recorded using standard procedures for assessment of nutritional status. The table shows the majority of respondents were 19 years old (29.1%), followed by 20 years (26.8%), indicating that late adolescence constituted the largest proportion of the study population. Nearly half of the respondents (44.1%) had education up to the school level, while only 24.1% were graduates. Regarding family income, 58.2% belonged to families earning less than ₹20,000 per month, reflecting a predominantly lower-middle socioeconomic background. More than half of the respondents resided in urban areas (53.6%), whereas 46.4% belonged to semi urban areas.
Inclusion Criteria
The findings suggest that adolescent girls from urban and economically better-off households are more likely to be exposed to commercially available HFSS foods through markets, educational institutions, and digital media. Previous studies have also reported that urbanization and socioeconomic transitions influence food preferences and increase the accessibility of processed and energy-dense foods among adolescents. Therefore, socio-demographic factors may play an important role in shaping dietary behavior and food choices. Urban residence was slightly higher (53.6%), indicating greater exposure to HFSS foods and media influences. The findings indicate a high prevalence of HFSS food consumption among adolescent girls. Ultra-processed foods recorded the highest mean consumption score (2.54 ± 0.67), followed by high-salt foods (2.30 ± 0.64), high-sugar foods (2.15 ± 0.73), and high-fat foods (2.08 ± 0.69). The overall HFSS consumption score was 2.27 ± 0.54, reflecting moderate-to-high intake levels. The chi-square test revealed a statistically significant difference in consumption frequencies across HFSS categories (χ² = 28.74, df = 6, p < 0.001), suggesting a strong preference for processed and convenience foods among adolescents. Frequent consumption of these foods may increase the risk of overweight, obesity, poor dietary quality, and future noncommunicable diseases, highlighting the need for nutrition education and promotion of healthier indigenous and traditional food choices. Among the 220 adolescent girls, 45.9% reported skipping breakfast, making it the most frequently skipped meal, followed by lunch (11.8%) and dinner (5.0%). Approximately 37.3% of respondents reported not skipping any meal. The chi-square test demonstrated a highly significant difference in meal-skipping patterns (χ² = 93.96, df = 3, p < 0.001), indicating that breakfast skipping was substantially more prevalent than skipping other meals. The large effect size (Cramer's V = 0.65) suggests a strong pattern of meal omission among respondents. Frequent breakfast skipping may adversely affect dietary quality and contribute to increased consumption of HFSS foods later in the day. A statistically significant association was observed between HFSS food consumption and BMI status among adolescent girls (χ² = 31.42, df = 2, p < 0.001). The prevalence of overweight/obesity increased progressively with HFSS food consumption, from 20.0% among low consumers to 82.0% among high consumers. Conversely, the proportion of girls with normal BMI decreased from 80.0% in the lowconsumption group to 18.0% in the high-consumption group. The Cramer's V value of 0.38 indicates a moderate association between HFSS food intake and BMI status. The findings suggest that frequent consumption of HFSS foods is significantly associated with increased overweight and obesity among adolescent girls. Girls reporting high HFSS intake were considerably more likely to be overweight or obese compared with those consuming such foods less frequently. The moderate effect size indicates that HFSS food consumption is an important contributor to BMI variation in this population. These results support existing evidence that regular intake of energy-dense, nutrient-poor processed foods promotes excessive calorie intake, weight gain, and adiposity during adolescence. Overall the respondents, 41.8% reported high social media influence, while 34.5% experienced high peer pressure. Nearly 37.3% spent more than four hours daily on screens and 24.5% slept less than six hours per day. Significant associations were observed between HFSS food consumption and social media influence (χ²=18.46, p<0.001), peer pressure (χ²=14.82, p<0.01), screen time (χ²=21.73, p<0.001), and sleeping duration (χ²=10.91, p<0.05). Correlation analysis showed positive relationships between social media influence and HFSS food intake (r=0.42) and between screen time and BMI (r=0.38), whereas sleeping duration was negatively correlated with BMI (r=-0.29). The findings suggest that psychosocial and lifestyle factors significantly influence dietary behavior among adolescent girls. Greater exposure to social media increased attraction toward advertised HFSS foods, while peer pressure encouraged frequent consumption HFSS foods in social settings. Higher screen time is associated with sedentary behavior and increased energy intake, thereby contributing to elevated BMI. Conversely, shorter sleep duration appears to be linked with higher BMI, possibly through hormonal changes affecting appetite regulation and food preferences.
Conclusion
The present study showed that HFSS (high-fat, salt, and sugar) foods are widely consumed among adolescent girls, with ultra-processed foods being the most frequently consumed category. Frequent consumption of these foods was associated with unhealthy lifestyle practices such as meal skipping, prolonged screen time, inadequate sleep, and lower physical activity. Both undernutrition and overweight/obesity were observed among the respondents, indicating the presence of a double burden of malnutrition. The findings emphasize the need to encourage healthy eating habits among adolescents by reducing the intake of HFSS foods and increasing the consumption of nutritious home-cooked, indigenous, and traditional foods. Nutrition education, parental guidance, school-based awareness programs, and promotion of active lifestyles can help improve dietary behaviors and nutritional status. Adopting healthier food choices during adolescence is essential for preventing future health problems and ensuring overall wellbeing.
Acknowledgement
AcknowledgmentsThe author sincerely thank all the adolescent girls who participated in this study and shared valuable information. I am also grateful to the educational institutions and Parents for their cooperation and support during the research work.
Figures and tables from the paper
| Variable | Category | Frequency (n) | Mean | SD |
|---|---|---|---|---|
| Age (Years) | 18 | 57(25.9) | 19.37 | 1.09 |
| 19 | 64(29.1) | - | - | |
| 20 | 59(26.8) | - | - | |
| 21 | 40(18.2) | - | - | |
| Education | Intermediate | 74(33.6) | - | - |
| Graduate | 146(66.4) | - | - | |
| Monthly Income | < ₹30,000 | 66(30.0) | - | - |
| ₹,30001–40,000 | 62(28.2) | - | - | |
| ₹40,001–50,000 | 53(24.1) | - | - | |
| > ₹50,000 | 39(17.7) | - | - | |
| Family Type | Nuclear | 128(58.2) | - | - |
| Joint | 92(41.8) | - | - | |
| Residence | Urban | 118(53.6) | - | - |
| Semi urban | 102(46.4) | - | - |
Table text extracted from the original PDF; superscript letters are shown inline. The original table image is below.
View original table image
| HFSS Food Category | Daily n (%) | Weekly n (%) | Occasionally n (%) | Mean Score ± SD | χ² | df | p-value |
|---|---|---|---|---|---|---|---|
| High-fat foods (Pizza, Burger, French fries, Samosa, Kachori) | 62 (28.2) | 114 (51.8) | 44 (20.0) | 2.08 ± 0.69 | |||
| High-sugar foods (Chocolates, Pastries, Soft drinks) | 77 (35.0) | 99 (45.0) | 44 (20.0) | 2.15 ± 0.73 | |||
| High-salt foods (Chips, Salty snacks, Instant noodles) | 88 (40.0) | 110 (50.0) | 22 (10.0) | 2.30 ± 0.64 | |||
| Ultra-processed foods (Packaged snacks, Frozen foods) | 141 (64.1) | 57 (25.9) | 22 (10.0) | 2.54 ± 0.67 | |||
| Overall HFSS Consumption Pattern | — | — | — | 2.27 ± 0.54 | 28.74 | 6 | <0.001 |
Table text extracted from the original PDF; superscript letters are shown inline. The original table image is below.
View original table image
| Meal Skipped | Frequency (n) | χ² Value | df | p-value | Cramer's V |
|---|---|---|---|---|---|
| Breakfast | 101(45.9) | - | - | - | - |
| Lunch | 26(11.8) | - | - | - | - |
| Dinner | 11(5.0) | - | - | - | - |
| No Meal Skipped | 82(37.3) | - | - | - | - |
| Total | 220(100) | 93.96 | 3 | <0.001 | 0.65 |
Table text extracted from the original PDF; superscript letters are shown inline. The original table image is below.
View original table image
| BMI Category | Frequency (n) | Mean BMI (kg/m²) | SD | Variance | CV (%) |
|---|---|---|---|---|---|
| Underweight | 86(39.1) | - | - | - | - |
| Normal | 62(28.2) | - | - | - | - |
| Overweight | 47(21.4) | - | - | - | - |
| Obese | 25(11.3) | - | - | - | - |
| Total | 220(100) | 22.41 | 4.18 | 17.47 | 18.65 |
Table text extracted from the original PDF; superscript letters are shown inline. The original table image is below.
View original table image
| HFSS Consumption Level | Normal BMI n (%) | Overweight/Obese n (%) | Total (n) | χ² Value | df | p-value | Cramer's V |
|---|---|---|---|---|---|---|---|
| Low | 48 (80.0) | 12 (20.0) | 60 | - | - | - | - |
| Moderate | 40 (66.7) | 20 (33.3) | 60 | - | - | - | - |
| High | 18 (18.0) | 82 (82.0) | 80 | - | - | - | - |
| Total | 106( 48.2) | 114(51.8) | 220 | 31.42 | 2 | <0.001 | 0.38 |
Table text extracted from the original PDF; superscript letters are shown inline. The original table image is below.
View original table image
| Variable | Category | Frequency (n) | χ² Value | p-value | Correlation Coefficient (r) |
|---|---|---|---|---|---|
| Social Media Influence | High | 92(41.8) | 18.46 | <0.001 | 0.42 |
| Moderate | 78(35.5) | ||||
| Low | 50(22.7) | ||||
| Peer Pressure | High | 76(34.5) | 14.82 | <0.01 | 0.31* |
| Moderate | 88(40.0) | ||||
| Low | 56(25.5) | ||||
| Screen Time | <2 hrs/day | 42(19.1) | 21.73 | <0.001 | 0.38 |
| 2–4 hrs/day | 96(43.6) | ||||
| >4 hrs/day | 82(37.3) | ||||
| Sleeping Duration | <6 hrs/day | 54(24.5) | 10.91 | <0.05 | -0.29 |
| 6–8 hrs/day | 122(55.5) | ||||
| >8 hrs/day | 44(20.0) |
Table text extracted from the original PDF; superscript letters are shown inline. The original table image is below.
View original table image
References
13 in the original paper- Arya S, Dubey R. Fast food consumption and nutritional implications among Indian adolescents. Indian J Community Health. 2024;36(2):145-152.
- Census of India. Primary census abstract: Jharkhand. New Delhi: Office of the Registrar General and Census Commissioner, Government of India; 2011.
- Goyal A, Singh NP. Consumer perception about fast food in India: an exploratory study. Br Food J. 2007;109(2):182-195. doi:10.1108/00070700710725536.
- Gupta N, Goel K, Shah P, Misra A. Childhood obesity in developing countries: epidemiology, determinants, and prevention. Endocr Rev. 2012;33(1):48-70. doi:10.1210/er.2010-0028.
- Jharkhand Government. Dhanbad district profile. Dhanbad: District Administration Dhanbad, Government of Jharkhand; 2024.
- Kalita P, Sharma M, Das R. Socioeconomic determinants of HFSS food consumption among adolescents in urban India. J Nutr Health Sci. 2024;11(1):25-34.
- Kamboj P, Toteja GS. Dietary habits and junk food consumption patterns among urban adolescents in India. Indian J Public Health Res Dev. 2019;10(5):438-444.
- Ministry of Health and Family Welfare. National Family Health Survey (NFHS-5): India report. New Delhi: Government of India; 2023.
- Mishra S, Subhadra M, Sharma N. High fat, sugar and salt food consumption among adolescent girls residing in Mumbai city. Int J Home Sci. 2021;7(3):112-118.
- Popkin BM. Nutrition transition and the global rise of ultra-processed foods. World Obes. 2020;21(1):1-8.
- Rathi N, Riddell L, Worsley A. Food consumption patterns of adolescents aged 14-16 years in Kolkata, India. Nutr J. 2017;16(50):1-12. doi:10.1186/s12937017-0272-3.
- World Health Organization. Adolescent nutrition: a review of the situation in selected South-East Asian countries. Geneva: World Health Organization; 2022.
- World Health Organization. Healthy diet fact sheet. Geneva: World Health Organization; 2024.