
Research article · 2026 · Full text
International Journal of Agriculture and NutritionEffect of front-line demonstrations on foliar nutrition in enhancing cotton yield in Kalaburagi district, Karnataka, India
Volume 8(6) · Pages 66–68 · DOI: 10.33545/26646064.2026.v8.i6a.656 ↗
Research areasAgricultural Science and FertilizationAgricultural Development and ManagementResearch in Cotton Cultivation
Abstract
Author-writtenCotton is a vital cash crop in India, contributing significantly to the Indian agricultural economy. However, its productivity is often limited by the non-adoption of recommended fertilizer doses and application schedules. To address this issue, Krishi Vigyan Kendra (KVK), Kalaburagi-II (Raddewadagi), UAS Raichur, conducted frontline demonstrations (FLDs) on foliar nutrient management in the Kalaburagi district of Karnataka. These demonstrations were carried out during the Kharif seasons of 2023-24 and 2024-25 at selected farmers' fields in villages such as Ullandigera, Ladlapura, Sonna, Kallahangarga and Wasthare villages of Kalaburagi district. The FLD plots employed a balanced nutrient management approach based on university package of practice incorporating major and micronutrients. Farmers applied the recommended fertilizer dose of 100:50:50 NPK kg/ha along with MgSO₄ + 19:19:19 @ 1% spray each and two time spraying of Potassium nitrate @ 1% and EDTA Zn, Fe and Mn @ 0.5%. This resulted in a significantly higher average seed cotton yield of 22.55 q/ha compared to 19.85 q/ha under traditional practices (150:25:25 NPK kg/ha). The FLD plots recorded a 12.00% yield increase over farmers' practices. Despite this improvement, a mean technological gap of 7.44 q/ha, an extension gap of 2.70 q/ha, and a technology index of 24.78%.
Summary
Source-checkedPlain-language reading of the full paper, prepared with AI and checked against the text. Each point links to the authors' own words.
Why it matters
- Cotton is a critical cash crop that provides significant contributions to India's agricultural economy. View evidence ↗
- The productivity of cotton is frequently hindered because farmers do not adopt recommended fertilizer doses or application schedules. View evidence ↗
- Frontline demonstrations (FLDs) serve as educational tools to show farmers the effectiveness of new agricultural technologies directly in their fields. View evidence ↗
The question
- The study aimed to analyze the costs and returns of improved cotton technology, identify yield gaps, and evaluate the adoption of these technologies. View evidence ↗
What they did
- Ten FLDs, each covering 0.4 ha, were conducted across five villages in the Kalaburagi district during the 2023-24 and 2024-25 Kharif seasons. View evidence ↗
- The recommended treatment consisted of 100:50:50 NPK kg/ha and specific foliar sprays of MgSO₄ + 19:19:19, Potassium nitrate, and EDTA micronutrients (Zn, Fe, Mn) at various growth stages. View evidence ↗
- The recommended practice was compared against traditional farmer practices, which used 150:25:25 NPK kg/ha and no micronutrient foliar sprays. View evidence ↗
- The researchers used established formulas to calculate the technology gap, extension gap, and technology index. View evidence ↗
What they found
- The recommended foliar nutrition led to a significantly higher average seed cotton yield of 22.55 q/ha compared to 19.85 q/ha under traditional practices. View evidence ↗
- The FLD plots achieved a 12.00% increase in yield over the practices used by farmers. View evidence ↗
- Across the 10 demonstrations, the mean technology gap was found to be 7.44 q/ha. View evidence ↗
- The extension gap ranged from a low of 2.60 q/ha in 2023-24 to a high of 2.81 q/ha in 2024-25. View evidence ↗
- The technology index was 24.78%, which the authors interpret as indicating high suitability of the recommended technology for the district. View evidence ↗
- Demonstration fields provided a higher average net return of ₹118,616/ha compared to ₹101,683/ha from farmer practices. View evidence ↗
- The mean benefit-cost ratio was higher for demonstration plots (3.78) than for farmer practices (3.43). View evidence ↗
What it means
- The authors conclude that improved cotton technology has substantial potential to increase the income and livelihoods of farmers in the Kalaburagi district. View evidence ↗
- The authors state that location-specific recommendations are needed to further minimize the gap between potential and demonstration yields. View evidence ↗
Visual summary
3 visualsIllustrations explain the paper; charts are replotted from the paper's own table values.
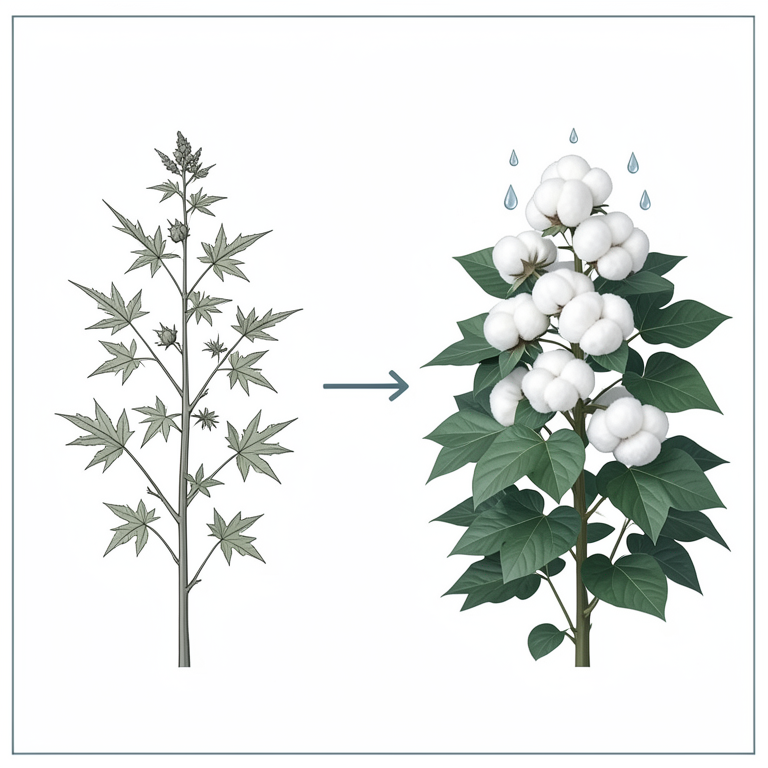
Comparison of Nutrient Management
AI-generated conceptual illustration (cotton plants). It explains the idea and does not show study data.
View source evidence ↗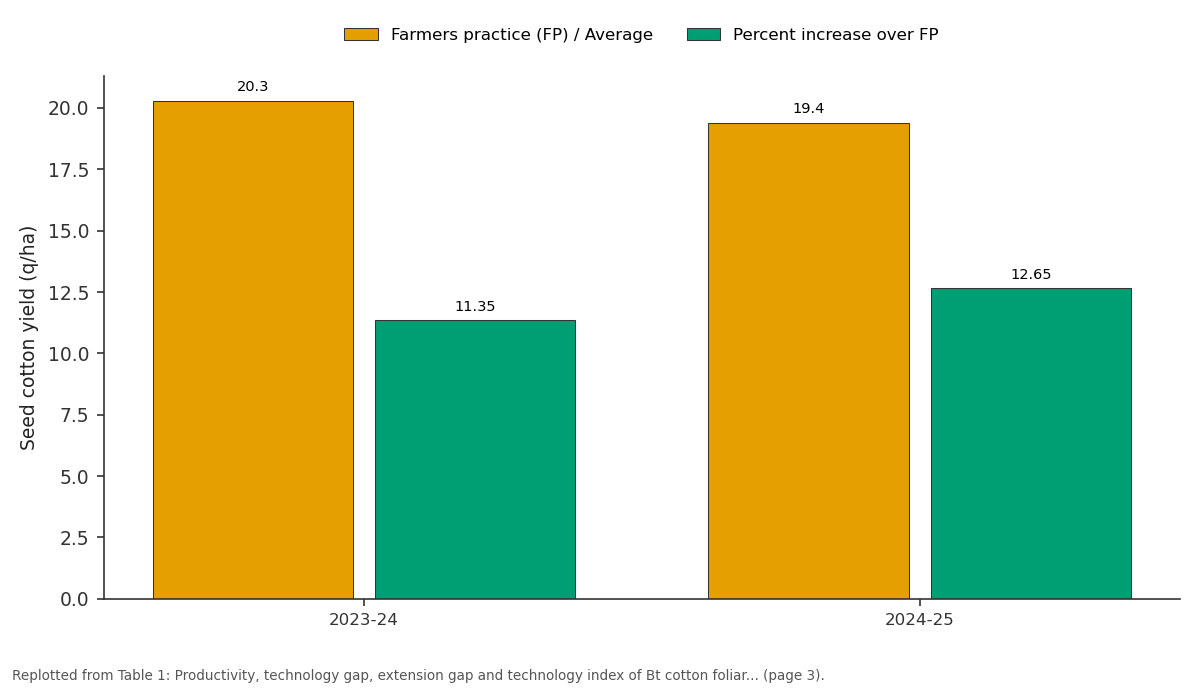
Farmers practice (FP) / Average and Percent increase over FP: 2023-24 vs 2024-25
Replotted from Table 1 (page 3) of the original paper. Every bar is the paper's own table value.
View source evidence ↗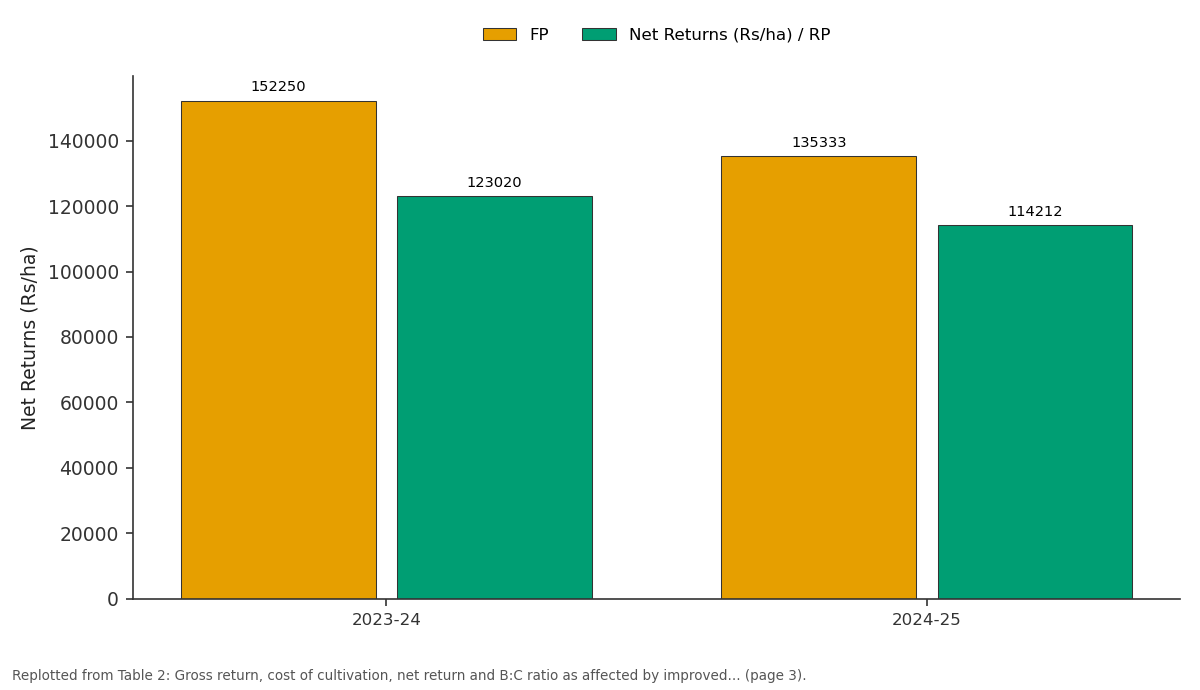
FP and Net Returns (Rs/ha) / RP: 2023-24 vs 2024-25
Replotted from Table 2 (page 3) of the original paper. Every bar is the paper's own table value.
View source evidence ↗Figures & tables
From the original paper Table 1
 Table 2
Introduction
Cotton is a pivotal commercial crop that significantly contributes to the national economy. Beyond its economic importance, the cotton industry generates employment for thousands of workers in textile mills and millions more in decentralized sectors such as power looms, handlooms, and traditional spinning wheels (charkas). Krishi Vigyan Kendra or Farm centre is an innovative, science-based institution designed to bridge the gap between agricultural research and farmers. Its primary objective is to reduce the time lag in transferring technology from research institutions to farmers, thereby increasing agricultural productivity and income sustainably. KVKs are grassroots organizations tasked with assessing, refining, and demonstrating proven technologies under diverse micro-farming conditions in each district (Das, 2007) [6] . Frontline demonstrations (FLDs) are systematic educational initiatives conducted in farmers' fields to showcase the effectiveness of new practices and technologies. Despite advancements in agricultural research, many farmers in India continue to rely on traditional knowledge passed down through generations. This often results in unscientific agronomic, nutrient, and pest management practices, limiting the potential yield of crops and new varieties. The potential yield of crops is influenced by factors such as solar radiation, temperature, photoperiod, atmospheric carbon dioxide levels, and genetic characteristics, assuming no limitations from water, nutrients, pests, or diseases. In rainfed farming systems, where water supply is beyond the farmer's control, water-limited potential yield becomes.
International Journal of Agriculture and Nutrition 2026; 8(6): 66-68 a critical benchmark for yield gap analysis. Seasonal variations, particularly in rainfall, further affect this potential yield (Singh et al., 2001) [5] . Although significant strides have been made in agricultural productivity since the mid-1960s, continued efforts are essential to meet the demands of a growing population. Demonstrating recommended improved technologies through FLDs on farmers' fields remains one of the most effective approaches. This study aims to analyze input costs and monetary returns, identify yield gaps, assess technology adoption, and explore reasons for the non-adoption of proven technologies.
Materials and Methods
• The study was conducted in the operational area of Krishi Vigyan Kendra (KVK), Kalaburagi-II (Raddewadagi), Karnataka. The region receives an annual precipitation of 750 mm, primarily between June and the end of September. The maximum temperature in Kalaburagi district reaches 44°C, while the minimum temperature drops to 10°C. • Ten frontline demonstrations (FLDs) on cotton were conducted during the Kharif season from 2023-24 and 2024-25 across five adopted villages in the operational area namely Ullandigera, Ladlapura, Sonna, Kallahangarga and Wasthare and each demonstration covered an area of 0.4 ha. • The soils in the study area were slightly alkaline, with low to medium organic carbon, medium available phosphorus, and very high available potassium. • The treatment involved the recommended practice of applying 100:50:50 NPK kg/ha along with one time foliar spray of MgSO₄ +19:19:19 @ 1% each at flowering (65-75 DAS), Boll development (80-95 DAS) and Boll formation (100-110 DAS) and two times (flowering stage between 10 days interval) spraying of Potassium nitrate @ 1% at 80 and 100 DAS and EDTA Zn, Fe and Mn @ 0.5%, compared to the existing farmer practice of 150:25:25 NPK kg/ha excluding micronutrient foliar application. • An entire dose of nitrogen and phosphorus was applied through diammonium phosphate, potassium through muriate of potash, and 25% of nitrogen, along with full phosphorus and potassium, as a basal dose at sowing. • The remaining nitrogen was applied in two equal doses at 30 and 45 days after sowing along with seed treatment by Azotobacter and phosphorus-solubilizing bacteria at 25 g/kg seed.
Data Analysis
Participating farmers were trained in cotton production technologies, including fertilizer dosage calculations, soil sampling, seed treatments, and recommended agronomic practices. Primary data were collected using interviews and analysed for yield improvement percentages. The primary data were collected from the selected farmers with the help of interview schedule and interpreted and presented regarding percentage increased yield. The observation yield and economic performance of front line demonstration, the data on output were collected from FLDs (demonstration) as well as local check plots from all selected farmers and finally the grain yield, cost of cultivation, yield, net returns of different farmers were analyzed by the formula.
Results and Discussion
Results and Discussion
Seed Cotton Yield
The data on seed cotton yield from frontline demonstrations (FLDs) conducted during Kharif 2023-24 and 2024-25 are presented in Table 1. The average highest yield of 22.90 q/ha in the demonstration plot was recorded during the Kharif season of 2023-24, compared to 20.30 q/ha in the farmers' practice plot. This was followed by yields of 22.21 q/ha in 2024-2025 under recommended technologies, as opposed to 19.40 q/ha in the local check representing a 11.35% and 12.65% increase in yield due to the balanced nutrient application based recommendations. The findings indicate that balanced fertilization enhances cotton productivity. Farmers are encouraged to avoid imbalanced nutrient applications.
Technology Gap
• A wide technology gap was observed across the years, with the lowest gap (7.10 q/ha) recorded in 2023-24 and the highest (12.65 q/ha) in 2024-25. The mean technology gap for all 10 demonstrations was 7.44 q/ha. • These differences are attributed to varying feasibility levels of the recommended technologies across years, influenced by factors such as soil fertility and erratic rainfall.
• The gap between potential yield and demonstration yield highlights the need for location-specific recommendations to minimize the technology gap.
Extension Gap: The extension gap, representing the difference between FLD and farmers' practice yields, ranged from 2.60 to 2.81 q/ha. The lowest gap (2.60 q/ha) was recorded during Kharif 2023-24, while the highest (2.81 q/ha) was observed in 2024-25. The higher extension gap underscores the need to educate farmers on adopting improved practices, particularly balanced nutrient management for higher yields.
Technology Index
The technology index, which indicates the feasibility of technology at farmers' fields, was recorded at 24.78% (Table 1), indicating a high suitability of the recommended technology for the Kalaburagi district. These findings are consistent with those of Ravindra and Mandar (2025) for wheat production technology in the same region.
Economics
The economic analysis (Table 2) revealed that adopting improved cotton cultivation technology resulted in higher profitability. The average additional net return from demonstration fields was ₹118616/ha, compared to ₹101683/ha from farmer's practices. The mean benefit-cost (B:C) ratio was 3.78 for demonstration plots and 3.43 for farmer's practices. These results highlight the substantial potential of improved technology to enhance farmer's income and livelihoods in the Kalaburagi district of Karnataka state.
| Year | No. of farmers | Gross Cost (Rs/ha) | — | Gross Returns (Rs/ha) | — | Net Returns (Rs/ha) | — | Additional net returns (Rs/ha) | B:C Ratio | — |
|---|---|---|---|---|---|---|---|---|---|---|
| RP | FP | RP | FP | RP | FP | RP | FP | |||
| 2023-24 | 10 | 41913 | 41300 | 164933 | 152250 | 123020 | 110950 | 12070 | 3.94 | 3.70 |
| 2024-25 | 10 | 42814 | 42500 | 156240 | 135333 | 114212 | 92417 | 21795 | 3.63 | 3.16 |
Table text extracted from the original PDF; superscript letters are shown inline. The original table image is below.
View original table image
References
6 in the original paper- Mithun J. Zonal Coordinating Unit, Zone-III, Barapani, Meghalaya, India. In: Venkatasubramanian V, Sanjeev MV, Singha AK, editors. Concepts, approaches and methodologies for technology application and transfer: a resource book for KVKs. 2nd ed. New Delhi: ICAR; 2007. p. 6.
- Bhowate RT, Geete MH. Effectiveness of frontline demonstrations on soil test-based nutrient management for enhancing cotton yield in Hingoli District, Maharashtra, India. Int J Curr Microbiol App Sci. 2025;14(2):116-121.
- Sagar RL, Chandra G. Evaluation of frontline demonstrations on mustard in Sunderbah, West Bengal. Indian J Exten Educ. 2004;40:96-97.
- Samui SK, Maitra S, Roy DK, Mondal AK, Saha D. Evaluation of frontline demonstration on groundnut (Arachis hypogaea L.). J Indian Soc Coastal Agric Res. 2000;18:180-183.
- Singh P, Vijaya D, Chinh NT, Pongkanjana A, Prasad KS, Srinivas K, et al. Potential productivity and yield gap of selected crops in the rainfed regions of India, Thailand and Vietnam. Natural Resource Management Program Report No. 5. Patancheru: International Crops Research Institute for the Semi-Arid Tropics; 2001. p. 125.
- Das P. Proceedings of the Meeting of DDG (Agricultural Extension), ICAR, with officials of State Departments, ICAR Institutes and Agricultural Universities, NRC Mithun, Jharmapani, Meghalaya. 2007.