
Research article · 2026 · Full text
International Journal of Biology SciencesDemonstration of Drought mitigation techniques in Chickpea crop in Bidar District, Karnataka, India
Volume 8(6) · Pages 121–124 · DOI: 10.33545/26649926.2026.v8.i6b.869 ↗
Research areasGenetic and Environmental Crop StudiesAgricultural Productivity and Crop ImprovementIrrigation Practices and Water Management
Abstract
Author-writtenWith an objective of improving productivity of chickpea, Integrated Crop Management (ICM) for drought mitigation techniques for dryland conditions were conducted in 10 farmer’s fields in Belkuni village of Aurad taluk of Bidar district in Karnataka state during Rabi season of 2024-25 and 2025-26. The study findings revealed that ICM practices for drought mitigation techniques recorded a mean average yield of 11.20 kg/ha which is 10.88 per cent higher than obtained with farmer’s practice (10.60 q/ha). The average extension gap, technology gap and technology index were 0.60 q/ha, 3.80 kg/ha and 25.37 per cent, respectively. The improved production technologies gave higher benefit cost ratio (1.67) compared to local check (1.45) being grown by farmers under locality. The productivity of chickpea per unit area could be increased by adopting feasible scientific and sustainable management practices with a suitable variety. Considering the above facts, ICM for drought mitigation techniques were carried out in a systematic and scientific manner on farmer’s field to show the worth of improved practices and convincing farming community about potentialities of improved production management technologies of chickpea for further adoption by the farming community.
Summary
Source-checkedPlain-language reading of the full paper, prepared with AI and checked against the text. Each point links to the authors' own words.
Why it matters
- Chickpea is a critical pulse crop in India, serving multiple roles within traditional farming systems across various global climates. View evidence ↗
- Because chickpea is primarily grown in rainfed areas, unpredictable rainfall often leads to terminal drought, which impairs crop growth and overall productivity. View evidence ↗
- Drought stress is a major threat, potentially reducing global chickpea production by 33%, with terminal drought causing yield losses of up to 70%. View evidence ↗
The question
- The study aimed to analyze and assess how drought mitigation techniques impact chickpea crops in the Aurad taluk of Bidar district. View evidence ↗
What they did
- Integrated Crop Management (ICM) for drought mitigation was tested across 10 farmers' fields in Belkuni village, Karnataka, during the Rabi seasons of 2024-25 and 2025-26. View evidence ↗
- The recommended treatment included specific NPK application (04:10:0 kg/ha), seed hardening with 2% CaCl2, bio-fertilizer treatments (Trichoderma, Rhizobium, and PSB), and foliar sprays of 'Chickpea magic' and Potassium Nitrate. View evidence ↗
- The ICM approach was compared against traditional farmer practices, which typically lacked seed treatments and micronutrient foliar applications and relied on imbalanced nutrient management (50 kg DAP/ha). View evidence ↗
What they found
- Demonstration plots showed superior growth parameters over farmer practices, with higher mean plant height (43.35 cm vs 40.60 cm), branches per plant (7.30 vs 6.85), plants per 5x5 sq area (56.50 vs 50.50), and pods per plant (66.60 vs 61.40). View evidence ↗
- Yield parameters were higher in demonstration plots, specifically seed yield (11.75 q/ha vs 10.60 q/ha), 100 seed weight (22.30 g vs 22.05 g), and seed yield per plant (15.25 g vs 14.65 g). View evidence ↗
- ICM practices achieved a mean average yield of 11.20 q/ha, representing a 10.88% increase over the 10.60 q/ha obtained through farmer practices. View evidence ↗
- The average technology gap across the 10 demonstrations was 3.80 q/ha, indicating the difference between potential and demonstration yields. View evidence ↗
- The extension gap, which measures the difference between demonstration and farmer yields, ranged from 0.54 to 0.65 q/ha. View evidence ↗
- A technology index of 25.37% was recorded, suggesting that the recommended drought mitigation technology is highly suitable for the Bidar district. View evidence ↗
- Demonstration fields provided higher economic returns, with an average net return of ₹29,475/ha compared to ₹20,625/ha for farmer practices. View evidence ↗
- The benefit-cost ratio was higher for the demonstration plots (1.67) than for the farmer's practices (1.45). View evidence ↗
What it means
- The authors conclude that chickpea productivity can be increased by adopting sustainable, scientific management practices and suitable crop varieties. View evidence ↗
- The authors note that the existing technology gap indicates a need for more location-specific recommendations to further optimize yields. View evidence ↗
Visual summary
1 visualsIllustrations explain the paper; they do not show study data.
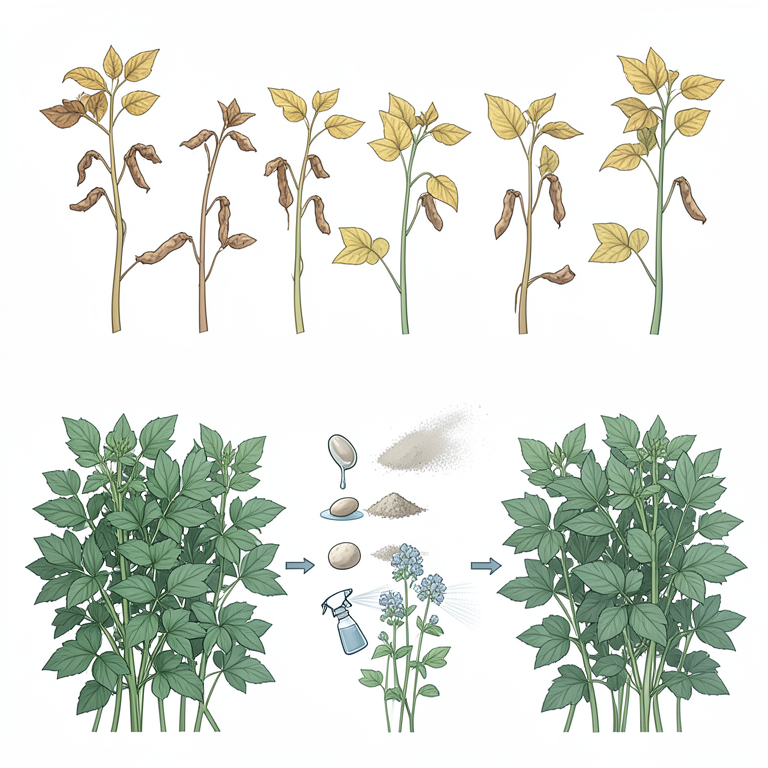
Comparison of Management Practices
AI-generated conceptual illustration (Chickpea plants (Cicer arietinum)). It explains the idea and does not show study data.
View source evidence ↗Figures & tables
From the original paper Table 1
 Table 2
 Table 3
 Table 4
Introduction
Chickpea (Cicer Arietinum L) is grown in many tropical, sub-tropical and temperate regions of the world and one of the most important pulse crop of India due to its multiple functions in the traditional farming system. Besides helping in the management of soil fertility, particularly in the dryland, it is an important source of human food and animal feed. In India, it is cultivated on about 1372000 ha with a production of 7169000 tonnes. However, its average productivity has remained strikingly low at about 859 kg/ha. In Karnataka, it is grown over an area of 1372000 ha with a production of 897000 tonnes and productivity of 321 kg/ha1. There are several biophysical, technical and socioeconomic constraints, which limit the productivity of chickpea in India. In order to mitigate these limitations, it is essential to assess the production potential of the environment in relation to achievable and current levels of production as well as the availability of the natural resources (Goudappa et al., 2019) [3] . Since chickpea is mostly cultivated under rainfed conditions and unpredictable rain fall under such environments results in terminal drought reducing crop growth and productivity. Globally, drought stress is considered to reduce chickpea production by 33% (Kashiwagi et al., 2015) [4] and terminal drought can significantly increase crop yield loss up to 70% (Devasirvatham & Tan, 2018) [2] . Even severe water deficit may result in 100% yield loss in susceptible genotypes (Sachdeva et al., 2022) [5] . Thus, evaluation of genotypes using some morpho-physiological criteria can be promising to reduce the drastic effects of terminal drought. Therefore, it is very essential to conduct investigation on drought mitigation techniques demonstrations on chickpea to assess their effectiveness and efficiency towards enhancement in yield and economics. Hence a research study was planned and conducted with the aim to analyze and assess the impact drought mitigation techniques in Chickpea crop in Aurad taluk of Bidar district. Krishi Vigyan Kendra or Farm centre is an innovative, science-based institution designed to bridge the gap between agricultural research and farmers. Its primary objective is to reduce the time lag in transferring technology from research institutions to farmers, there by increasing agricultural productivity and income sustainably. KVKs are grassroots organizations tasked with assessing, refining, and demonstrating proven technologies under diverse microfarming conditions in each district (Das, 2007) [1] . Frontline demonstrations (FLDs) are systematic educational initiatives conducted in farmers' fields to showcase the effectiveness of new practices and technologies. Despite advancements in agricultural research, many farmers in India continue to rely on traditional knowledge passed down through generations. This often results in unscientific agronomic, nutrient, and pest management practices, limiting the potential yield of crops and new varieties. The potential yield of crops is influenced by factors such as solar radiation, temperature, photoperiod, atmospheric carbon dioxide levels, and genetic characteristics, assuming no limitations from water, nutrients, pests, or diseases. In rainfed farming systems, where water supply is beyond the farmer's control, waterlimited potential yield becomes a critical benchmark for yield gap analysis. Seasonal variations, particularly in rainfall, further affect this potential yield (Singh et al., 2001) [6] . Although significant strides have been made in agricultural productivity since the mid-1960s, continued efforts are essential to meet the demands of a growing population. Demonstrating recommended improved technologies through FLDs on farmers' fields remains one of the most effective approaches. This study aims to analyze input costs and monetary returns, identify yield gaps, assess technology adoption, and explore reasons for the nonadoption of proven technologies.
Materials and Methods
The study was conducted in the operational area of Krishi Vigyan Kendra (KVK), Bidar, Karnataka. The region receives an annual precipitation of 850 mm, primarily between June and the end of September. The maximum temperature in Bidar district reaches 40°C, while the minimum temperature drops to 8°C. Five frontline demonstrations (FLDs) on Chickpea were conducted during the Rabi season from 2024-25 and 2025-26 across adopted villages in the operational area namely Belkuni and each demonstration covered an area of 0.4 ha. The soils in the study area were slightly alkaline, with low to medium organic carbon, medium available phosphorus, and very high available potassium. The treatment involved the recommended practice of applying 04:10:0 NPK kg/ha along with seed hardening with CaCl 2 @ 2 % for 30 minutes and shade drying for 7 hours followed by Trichoderma @ 5g/kg, Rhizobium and PSB 200 g each per 20 kg seeds and foliar spray of Chickpea magic 7.5 g/lit @ 50 % flowering and Potassium Nitrate spray @ 0.5% at flowering and pod filling stage compared to the existing farmer practice of no seed treatment and no micronutrient foliar application. Farmer practices often involved imbalanced nutrient management (50 kg DAP/ha), simultaneous sowing without seed treatment, and lack of proper agronomic practices.
To address these challenges, FLDs aimed to demonstrate the productivity and profitability of improved Chickpea production technologies under real farm conditions, even in variable weather.
Key diagnostic issues
Key diagnostic issues
Data Analysis
Participating farmers were trained in onion production technologies, including fertilizer dosage calculations, soil sampling, seed treatments, and recommended agronomic practices. Primary data were collected using interviews and analysed for yield improvement percentages. The primary data were collected from the selected farmers with the help of interview schedule and interpreted and presented regarding percentage increased yield. The observation on yield and economic performance of front line demonstration, the data on output were collected from FLDs (demonstration) as well as local check plots from all selected farmers and finally the grain yield, cost of cultivation, yield, net returns of different farmers were analyzed by the formula.
Gap Analysis
Technology gap, extension gap, and technology index were calculated using the following formulas (Goudappa et al., 2019) [3] .
Yield parameters
The data on growth and yield parameters in Chickpea crop from frontline demonstrations (FLDs) conducted during Rabi 2024-25 and 2025-26 are presented in Table 2 & Table 3. The average crop duration to harvest (95.50 days), 100 seed weight (22.30 g), seed yield per plant (15.25 g), number of seeds per pod (1.23) and seed yield (11.75 q/ha) in the demonstration plot was recorded higher during the Rabi 2024-25 and 2025-26 when compared to average crop duration to harvest (95.80 days), 100 seed weight (22.05 g), seed yield per plant (14.65 g), number of seeds per pod (1.21) and seed yield (10.60 q/ha) in the farmer's practice plot in the local check representing a 12.06 % increase in yield due to the following of drought mitigation techniques under dryland conditions. The increase in yield and yield attributes can be attributed to the higher number of branches, which provide more sites for flower and pod formation, resulting in a greater number of pods per plant. Enhanced nutrient availability from Chickpea magic and potassium nitrate foliar spray which supports better seed development and increased seed weight per plant, as seen in the work of Thejaswini et al. (2025) [7] .
| Year | Seed yield (q/ha) | — | — | — | Farmers practice (FP) | Percent increase over FP | Technology gap (q/ha) | Extension gap (q/ha) | Technology index |
|---|---|---|---|---|---|---|---|---|---|
| Recommended practice | |||||||||
| Potential yield | Highest | Lowest | Average | Average | |||||
| 2024-25 | 15 | 12.28 | 9.8 | 11.04 | 10.5 | 7.93 | 3.96 | 0.54 | 26.40 |
| 2025-26 | 15 | 12.4 | 10.3 | 11.35 | 10.7 | 13.83 | 3.65 | 0.65 | 24.33 |
| Mean | 15 | 12.34 | 10.05 | 11.20 | 10.60 | 10.88 | 3.80 | 0.60 | 25.37 |
Table text extracted from the original PDF; superscript letters are shown inline. The original table image is below.
View original table image
| Year | Crop duration (days) | — | 100 seed weight (gm) | — | Seed yield per plant | — | No. of seeds per pod | — | Yield (q/ha) | — | % Increase over FP |
|---|---|---|---|---|---|---|---|---|---|---|---|
| RP | FP | RP | FP | RP | FP | RP | FP | RP | FP | ||
| 2024-25 | 95.2 | 95.5 | 22.1 | 21.8 | 15.1 | 14.5 | 1.21 | 1.2 | 11.6 | 10.5 | 12.9 |
| 2025-26 | 95.8 | 96.1 | 22.5 | 22.3 | 15.4 | 14.8 | 1.24 | 12.1 | 11.9 | 10.7 | 11.21 |
| Mean | 95.50 | 95.80 | 22.30 | 22.05 | 15.25 | 14.65 | 1.23 | 6.65 | 11.75 | 10.60 | 12.06 |
Table text extracted from the original PDF; superscript letters are shown inline. The original table image is below.
View original table image
Technology Gap
A wide technology gap was observed across the years, with the lowest gap (3.65 q/ha) recorded in 2025-26 and the highest (3.96 q/ha) in 2024-25. The mean technology gap for all 10 demonstrations was 3.80 q/ha. These differences are attributed to varying feasibility levels of the recommended technologies across years, influenced by factors such as soil fertility and erratic rainfall. The gap between potential yield and demonstration yield highlights the need for location specific recommendations to minimize the technology gap.
Extension Gap
The extension gap, representing the difference between FLD and farmer's practice yields, ranged from 0.54 to 0.65 q/ha.
The lowest gap (0.54 q/ha) was recorded during rabi 2024-25, while the highest (0.65 q/ha) was observed in 2025-26 (Table 3). The higher extension gap underscores the need to educate farmers on adopting improved practices, particularly balanced nutrient management for higher yields.
Technology Index
The technology index, which indicates the feasibility of technology at farmers' fields, was recorded at 25.37 % (Table 3), indicating a high suitability of the recommended technology for the Bidar district. These findings are consistent with those of Goudappa et al. (2019) [3] for wheat production technology in the same region.
Economics
The economic analysis (Table 4) revealed that adopting improved Chickpea cultivation technology resulted in higher profitability. The average additional net return from demonstration fields was ₹29475/ha, compared to ₹20625/ha from farmer's practices. The mean benefit-cost (B:C) ratio was 1.67 for demonstration plots and 1.45 for farmer's practices. These results highlight the substantial potential of improved technology to enhance farmer's income and livelihoods in the Bidar district of Karnataka state.
| Year | Gross cost (Rs) | — | Gross Returns (Rs) | — | Net Returns (Rs) | — | Additional net returns | B:C Ratio | — |
|---|---|---|---|---|---|---|---|---|---|
| RP | FP | RP | FP | RP | FP | (Rs/ha) | RP | FP | |
| 2024-25 | 45000 | 46300 | 69600 | 63000 | 24600 | 16700 | 7900 | 1.54 | 1.36 |
| 2025-26 | 43000 | 45000 | 77350 | 69550 | 34350 | 24550 | 9800 | 1.79 | 1.54 |
| Mean | 44000 | 45650 | 73475 | 66275 | 29475 | 20625 | 8850 | 1.67 | 1.45 |
Table text extracted from the original PDF; superscript letters are shown inline. The original table image is below.
View original table image
Figures and tables from the paper
| Year | Plant height (cm) | — | No. of branches per plant | — | No. of plants (5X5 sq area) | — | No. of pods per plant | — |
|---|---|---|---|---|---|---|---|---|
| RP | FP | RP | FP | RP | FP | RP | FP | |
| 2024-25 | 42.5 | 40.2 | 7.2 | 6.8 | 55 | 49 | 66.2 | 61.2 |
| 2025-26 | 44.2 | 41 | 7.4 | 6.9 | 58 | 52 | 67 | 61.6 |
| Mean | 43.35 | 40.60 | 7.30 | 6.85 | 56.50 | 50.50 | 66.60 | 61.40 |
Table text extracted from the original PDF; superscript letters are shown inline. The original table image is below.
View original table image
References
7 in the original paper- Das P. Proceedings of the meeting of DDG (AE), ICAR, with officials of State Departments, ICAR institutes and Agricultural Universities, NRC Mithun, Jharmapani, Zonal Coordinating Unit, Zone-III, Barapani, Meghalaya, India. Meghalaya (India): NRC Mithun; 2007. 6 p.
- Devasirvatham V, Tan DK. Impact of high temperature and drought stresses on chickpea production. Agronomy. 2018;8(2):145.
- Goudappa SB, Preeti, Nimbargi YA. Production potential of chickpea (Cicer arietinum L.) under integrated crop management (ICM) in North Eastern Dry Zone of Karnataka. Int J Pure Appl Biosci. 2019;7(1):507-510.
- Kashiwagi J, Krishnamurthy L, Purushothaman R, Upadhyaya HD, Gaur PM, Gowda CLL, et al. Scope for improvement of yield under drought through root traits in chickpea (Cicer arietinum L.). Field Crops Res. 2015;170:47-54.
- Sachdeva S, Bharadwaj C, Patil BS, Pal M, Roorkiwal M, Varshney RK. Agronomic performance of chickpea affected by drought stress at different growth stages. Agronomy. 2022;12(5):995.
- Singh P, Vijaya D, Chinh NT, Pongkanjana A, Prasad KS, Srinivas K, et al. Potential productivity and yield gap of selected crops in the rainfed regions of India, Thailand and Vietnam. Natural Resource Management Program Report No. 5. Patancheru (India): International Crops Research Institute for the Semi-Arid Tropics; 2001. p. 1-25.
- Thejaswini R, Nandagavi RA, Patil SB, Shirahatti MS. Drought management in chickpea through foliar nutrition. J Farm Sci. 2025;38(2):113-118.