
Research article · 2026 · Full text
International Journal of Geography Geology and EnvironmentGeographical Study and Identification of Desertified Patches in Chamarajanagar District
Volume 8(6) · Pages 60–68 · DOI: 10.22271/27067483.2026.v8.i6a.786 ↗
Research areasHydrology and Drought AnalysisGeography and Environmental StudiesGroundwater and Watershed Analysis
Abstract
Author-writtenThe study of drought conditions is very important for regional development, especially in backward areas. Chamarajanagara district is one of the economically and socially backward districts in Karnataka. The geographical environment of this district shows that many parts are affected by drought and dry conditions.The main aim of this study is to identify the dry patches in different parts of the district and to understand where drought and desertification are more severe. For this purpose, the study uses available data such as rainfall, land use, and other geographical information.The study helps to find out which areas are most affected by drought. This will be useful for planning and development. After identifying these dry areas, further studies can be conducted to suggest suitable solutions and alternative methods to reduce the impact of drought.Thus, the identification of dry patches is very important for proper planning and sustainable development in the district.
Summary
Source-checkedPlain-language reading of the full paper, prepared with AI and checked against the text. Each point links to the authors' own words.
Why it matters
- Chamarajanagara district in Karnataka is characterized as being economically and socially backward. View evidence ↗
- The majority of the population in the district relies on farming as their primary source of livelihood. View evidence ↗
- Drought and desertification are causing water scarcity and a loss of fertility in the district's agricultural lands. View evidence ↗
The question
- The study aims to identify dry patches across the district to determine where desertification and drought are most severe. View evidence ↗
What they did
- The research utilized secondary data, including rainfall and temperature from the India Meteorological Department and Digital Elevation Model (DEM) data from USGS Earth Explorer. View evidence ↗
- ArcGIS was used to process data and create thematic maps covering factors like NDVI, drainage, temperature, rainfall, and land use. View evidence ↗
- A weighted overlay analysis was performed, assigning the highest weight (20% each) to temperature, rainfall, and evapotranspiration. View evidence ↗
What they found
- The district's elevation varies from 174 m to 1815 m above sea level. View evidence ↗
- The highest surface temperatures are primarily located in the eastern and north-eastern regions of the district. View evidence ↗
- The lowest rainfall levels are concentrated in the northern and central parts of the district. View evidence ↗
- High vegetation indices (NDVI 0.5+) were found in forested uplands such as Bandipur, BRT Hills, and MM Hills. View evidence ↗
- Dry patches are most concentrated in the eastern region, with Hanur taluk having the highest number of these patches. View evidence ↗
- Between 1930 and 2010, approximately 19% of the district's forest area was lost. View evidence ↗
What it means
- The authors recommend implementing sustainable agricultural practices, proper land use planning, and water conservation to mitigate drought impacts. View evidence ↗
- The study concludes that desertification and drought represent serious problems for the Chamarajanagara district. View evidence ↗
Visual summary
2 visualsIllustrations explain the paper; charts are replotted from the paper's own table values.
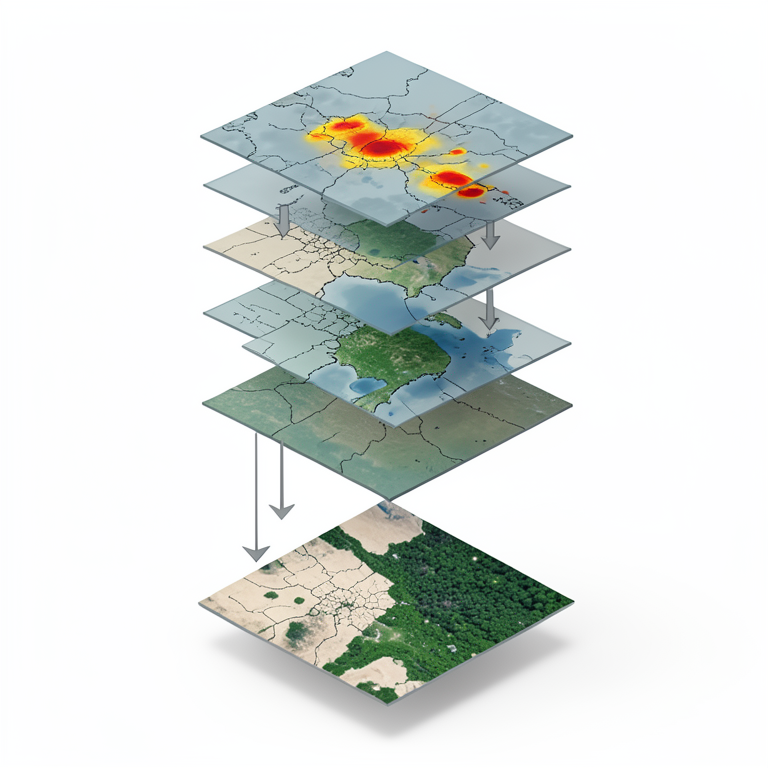
Weighted Overlay Process
AI-generated conceptual illustration (Topographic and climatic map layers of Chamarajanagar District). It explains the idea and does not show study data.
View source evidence ↗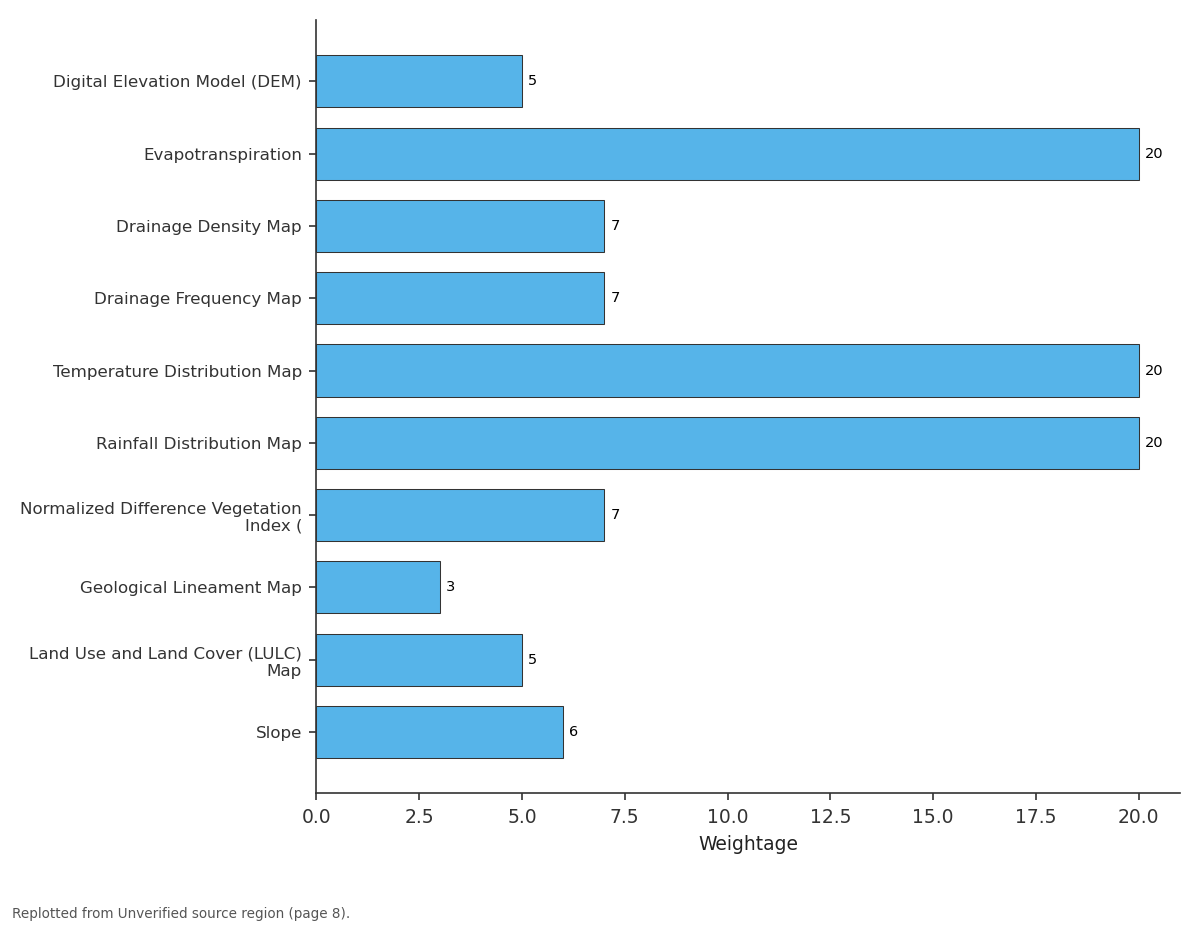
Weightage: Digital Elevation Model... vs Evapotranspiration vs Drainage Density Map vs Drainage Frequency Map vs Temperature...
Replotted from a table (page 8) of the original paper. Every bar is the paper's own table value.
View source evidence ↗Introduction
Chamarajanagara district is one of the important districts in the southern part of Karnataka. It covers a large geographical area and has a diverse physical environment. The district includes hills, plateaus, and forest regions, which support rich biodiversity. It also has cultural diversity and several tourist places that attract visitors. Agriculture is the main occupation of the people in this district. Most of the population depends on farming for their livelihood. However, in recent years, agricultural activities have been declining. This has led to economic difficulties and increasing migration of people to other areas in search of better opportunities. One of the major reasons for this problem is the changing condition of land and climate. Many parts of the district are affected by drought and desertification. The agricultural land is losing its fertility, and water scarcity is becoming a serious issue. In this context, it is very important to study the geographical conditions of the district and identify the areas that are most affected by drought and desertification. Such a study will help in understanding the problem clearly and support proper planning and development. It will also help in suggesting suitable measures to improve agriculture and reduce migration in the district.
Objectives of the study 1. To study the geographical conditions of Chamarajanagara district.
Review of literature
Many researchers have studied drought and desertification in different parts of India and the world. These studies help to understand the causes, effects, and solutions to these problems. According to United Nations Environment Programme, desertification is a major environmental issue in dry and semi-arid regions. It mainly happens due to climate change and human activities like deforestation and overuse of land. Indian Space Research Organisation has conducted several studies using remote sensing and GIS techniques to identify drought-prone and desertified areas in India. Their reports show that many parts of Karnataka are affected by land degradation and water scarcity. Studies by National Remote Sensing Centre highlight the importance of satellite data in mapping dry areas and monitoring changes in land use over time. These studies help in identifying vulnerable regions more accurately. Research in Karnataka shows that districts with low rainfall and poor soil conditions are more affected by drought. Several researchers have pointed out that improper land use, population pressure, and lack of water management are major causes of desertification. Although many studies have been conducted at national and state levels, there are limited detailed studies focusing specifically on Chamarajanagara district. Therefore, this study is important to identify dry patches at the district level and to understand the local conditions more clearly.
Methodology
This study aims to identify drought-prone and dry patch areas in Chamarajanagara district by using geospatial techniques and available data sources. The study is mainly based on secondary data. Digital Elevation Model (DEM) data were collected from USGS Earth Explorer. Rainfall and temperature data were obtained from India Meteorological Department. These datasets help in understanding the terrain and climatic conditions of the study area. All the collected data were processed and analyzed using ArcGIS. Based on this, different thematic maps were prepared, such as DEM, drainage network, drainage density, drainage frequency, rainfall distribution, temperature distribution, NDVI (vegetation index), geological lineament, and land use and land cover maps. Each of these maps provides important information about factors affecting drought conditions, such as slope, water availability, vegetation cover, and land use patterns. These layers were carefully analyzed to understand the spatial variation within the district. Finally, the weighted overlay method was applied in GIS by assigning suitable weights to each thematic layer based on its importance. All layers were combined to produce a final map showing drought-prone and dry patch areas in the district. This method helps in clearly identifying the most vulnerable areas and provides a scientific base for planning and management.
Analysis
To identify the desertified regions in Chamarajanagara district, the first step of the study was the preparation of a Digital Elevation Model (DEM). The DEM helps in understanding the elevation, slope, and terrain characteristics of the area, which are important factors influencing soil erosion, water flow, and land degradation.
The Digital Elevation Model (DEM) of Chamarajanagara district shows that the elevation ranges from 174 m to 1815 m above sea level. Low elevation areas are mainly found in the eastern and north-eastern parts, while moderate elevation covers the central region. Higher and highest elevations are located in the western and southern parts, especially in the Biligirirangana Hills and Gopalaswamy Hills. This variation in elevation influences the climate, water flow, and land conditions of the district.
Drainage Network:
The stream order map of Chamarajanagara district is prepared using the Strahler stream ordering method and shows streams from first to fifth order. First-order streams are the most numerous and are spread throughout the district. These small streams are mainly seasonal and depend on local rainfall, indicating limited and irregular water availability. The arid map of Chamarajanagara district was generated using a weighted overlay analysis in ArcGIS by integrating multiple geo-environmental indicators that influence aridity and desertification. Each indicator was assigned a specific weight based on its relative importance in controlling moisture availability, surface conditions, and land degradation processes. Higher weights were given to dominant climatic factors such as temperature (20%), rainfall (20%), and evapotranspiration (20%), as these directly control water balance and dryness conditions. Moderate weights were assigned to slope (6%), drainage density (7%), drainage frequency (7%), and NDVI (7%), which influence runoff, vegetation cover, and surface moisture retention. Lower weights were given to DEM (5%), LULC (5%), and geological lineaments (3%), as these act as supporting factors in desertification processes.
The map classifies drainage density into five categories:
The map classifies drainage density into five categories:
Result and Discussion
After conducting a detailed analysis by preparing various thematic maps and applying overlay techniques, a final map was generated to clearly identify the drought-prone and dry patch areas in the study area.
The aridity map prepared for Chamarajanagara district shows clear variation in moisture conditions across the district. Most of the area falls under semi-humid and humid categories, which are mainly found in the central and western parts. These regions have relatively better environmental conditions compared to other areas. However, some parts of the district are affected by dry conditions. The eastern region shows a higher concentration of dry patches. Among all the taluks, Hanur taluk has the maximum number of dry patches. This is followed by Gundlupete taluk and Chamarajanagara taluk, where dry conditions are also clearly observed.
References
6 in the original paper- United Nations Environment Programme. Global Environment Outlook Report. Nairobi: United Nations Environment Programme; 2016.
- Indian Space Research Organisation. Desertification and Land Degradation Atlas of India. Ahmedabad: Space Applications Centre, Indian Space Research Organisation; 2018.
- National Remote Sensing Centre. Remote Sensing Applications for Land Use Analysis. Hyderabad: National Remote Sensing Centre; 2019.
- India Meteorological Department. Climate Data Reports. New Delhi: India Meteorological Department; 2020.
- Food and Agriculture Organization. Drought and Agriculture Report. Rome: Food and Agriculture Organization of the United Nations; 2017.
- Government of Karnataka. District Census Handbook - Chamarajanagar. Bengaluru: Directorate of Census Operations, Karnataka; 2015.