
Research article · 2025 · Full text
International Journal of Geography Geology and EnvironmentGeoelectric survey and aquifer characterization in the Indo-Gangetic alluvial plains
Volume 7(5) · Pages 155–159 · DOI: 10.22271/27067483.2025.v7.i5c.605 ↗
Research areasGeophysical and Geoelectrical MethodsGroundwater and Watershed AnalysisGroundwater flow and contamination studies
Abstract
Author-writtenReading the subsurface of the Indo-Gangetic alluvial plains with a geoelectric survey is a bit like reading a medical CT scan—both rely on passing energy through layered material and interpreting the response to map internal structures that are invisible from the surface. This research applied vertical electrical sounding (VES) and 2-D electrical resistivity tomography (ERT) to characterise aquifer geometry, hydraulic properties, and groundwater potential across a 480 km² area of the central Indo-Gangetic Plain in Uttar Pradesh, India. A total of 68 VES stations and 12 ERT profiles were surveyed between January and September 2022 using a Schlumberger electrode array with maximum half-current electrode spacing (AB/2) of 300 m. Resistivity data were inverted using IPI2Win and RES2DINV software to generate layered earth models and 2-D subsurface resistivity sections. Five hydrogeological zones were delineated: proximal alluvial fan, mid-plain, distal plain, buried palaeochannel, and clay-capped aquifer. Aquifer thickness ranged from 18.4 m in the clay-capped zone to 47.3 m in buried palaeochannels. Dar Zarrouk parameters—transverse resistance and longitudinal conductance—were computed to evaluate aquifer transmissivity potential and protective capacity. Transmissivity estimated from transverse resistance correlated well with pumping test values from 14 existing wells (r = 0.84, p < 0.001). The buried palaeochannel zone showed the highest groundwater potential (transmissivity 487 m²/day), while the clay-capped zone offered the greatest aquifer protection (longitudinal conductance 8.7 mhos) but the lowest yield potential. These results demonstrate that geoelectric methods can reliably map aquifer heterogeneity in thick alluvial sequences and provide cost-effective guidance for well siting in the Indo-Gangetic Plain, where groundwater demand for irrigation is intensifying and aquifer depletion is a growing concern.
Summary
Source-checkedPlain-language reading of the full paper, prepared with AI and checked against the text. Each point links to the authors' own words.
Why it matters
- The Indo-Gangetic groundwater system is one of the most heavily exploited globally, providing essential water for irrigation and drinking to more than 500 million people. View evidence ↗
- Subsurface layers in this region are non-uniform, with features like clay lenses and buried palaeochannels that can be overlooked by drilling programs based only on surface geology. View evidence ↗
- Geoelectric methods provide a non-invasive way to image subsurface heterogeneity without the need for drilling. View evidence ↗
The question
- The study aimed to delineate aquifer zones, estimate hydraulic properties using Dar Zarrouk parameters, and validate these predictions against pump test data across 480 km² in Lucknow District, Uttar Pradesh. View evidence ↗
What they did
- A resistivity-lithology calibration was established using 23 borehole logs, categorizing materials as sand/gravel (>40 Ω·m), silty sand (20–40 Ω·m), silt (8–20 Ω·m), and clay (<8 Ω·m). View evidence ↗
- Aquifer transmissivity was estimated from transverse resistance and calibrated against 14 existing pumping test results. View evidence ↗
What they found
- The buried palaeochannel zone exhibited the greatest aquifer thickness at 47.3 ± 8.2 m. View evidence ↗
- The clay-capped zone had the thinnest aquifer (18.4 ± 4.6 m) due to a 12–18 m layer of low-resistivity clay. View evidence ↗
- Transmissivity estimates from geoelectric data strongly correlated with pumping tests (r = 0.84, p < 0.001) with a mean absolute error of 38 m²/day. View evidence ↗
What it means
- The authors conclude that integrated geoelectric surveys are a cost-effective and reliable method for mapping aquifer heterogeneity compared to borehole-based programs. View evidence ↗
- A limitation of the study is that the VES technique assumes horizontal layering, which may be inaccurate near channel margins where sand bodies dip steeply. View evidence ↗
Visual summary
3 visualsIllustrations explain the paper; charts are replotted from the paper's own table values.
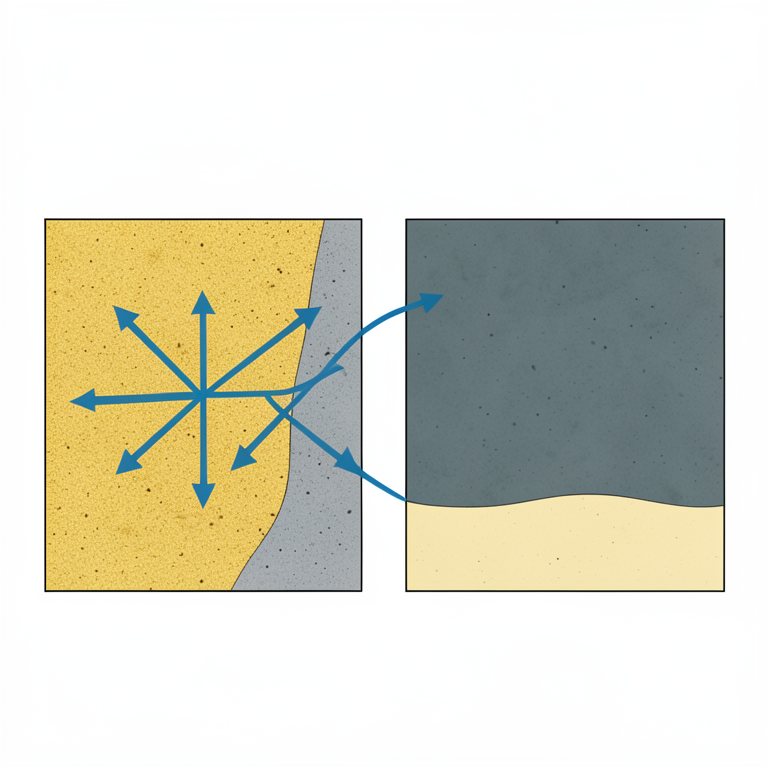
Aquifer Trade-off Concept
AI-generated conceptual illustration (Subsurface geological profiles of the Indo-Gangetic alluvial plains). It explains the idea and does not show study data.
View source evidence ↗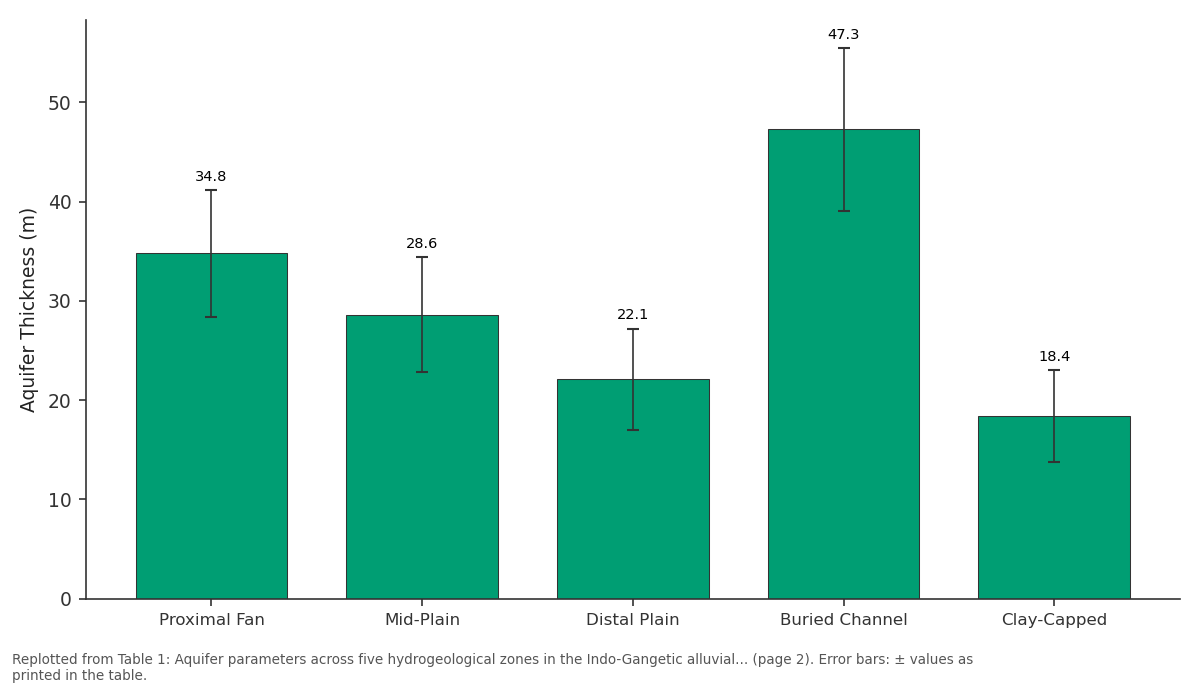
Aquifer Thickness (m): Proximal Fan vs Mid-Plain vs Distal Plain vs Buried Channel vs Clay-Capped
Replotted from Table 1 (page 2) of the original paper. Every bar is the paper's own table value.
View source evidence ↗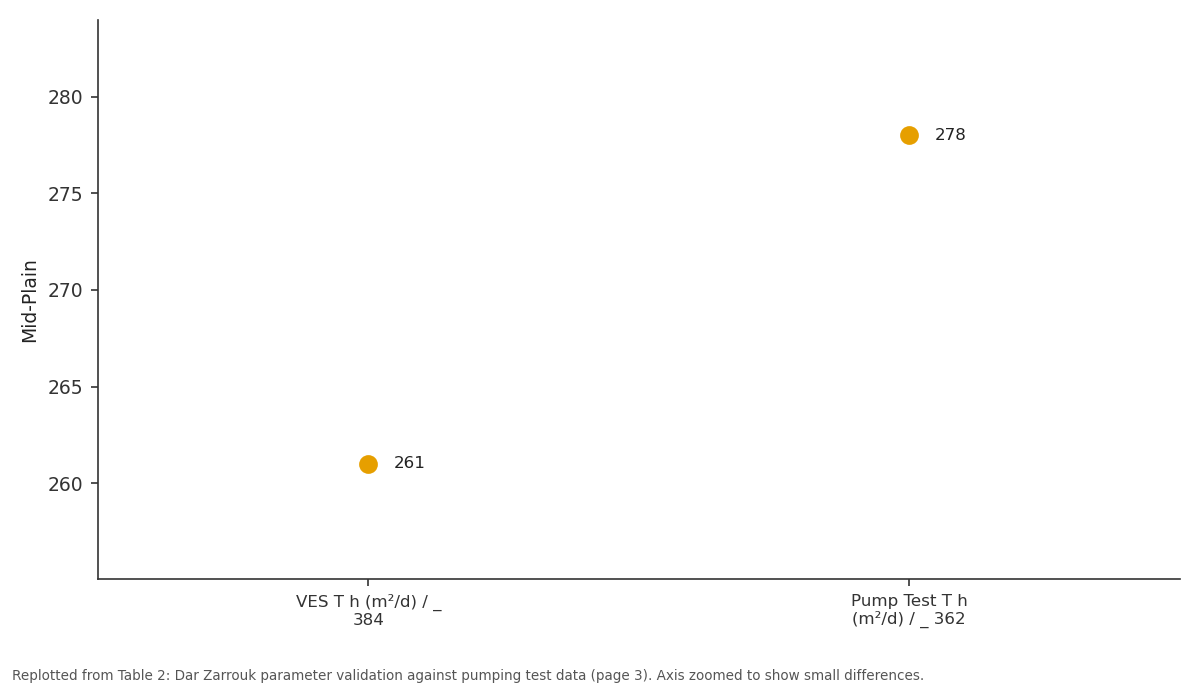
Mid-Plain: VES T h (m²/d) / _ 384 vs Pump Test T h (m²/d) /...
Replotted from Table 2 (page 3) of the original paper. Every bar is the paper's own table value.
View source evidence ↗Figures & tables
From the original paper Table 1
 Table 2
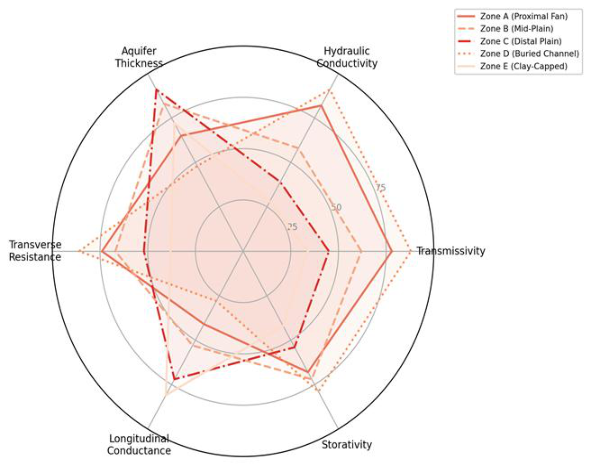 Figure 1
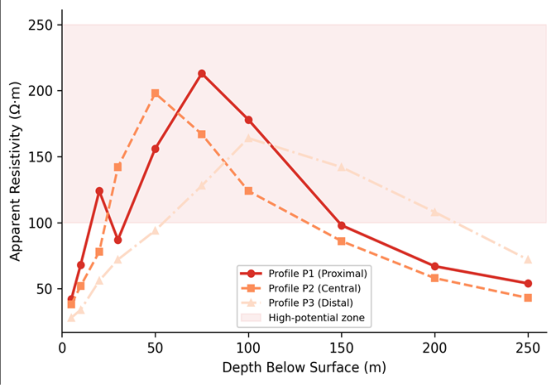 Figure 2
Introduction
Think of the Indo-Gangetic alluvial sequence as a layered cake baked by rivers over millions of years-sand and gravel deposited in channel beds, silt and clay spread across floodplains, and the whole assembly stacked to thicknesses exceeding 1,500 m in places [1] . Hidden within these layers are aquifers that supply drinking water and irrigation to over 500 million people across northern India, making the Indo-Gangetic groundwater system one of the most heavily exploited in the world [2] . But the layers aren't uniform: sand bodies pinch out laterally, clay lenses interrupt vertical connectivity, and buried palaeochannels create preferential flow paths that can be missed entirely by a drilling programme that relies on surface geology alone. Geoelectric methods offer a way to image this subsurface heterogeneity without drilling. By injecting electrical current into the ground and measuring the resulting voltage distribution at the surface, geophysicists can infer how resistivity varies with depth-and since resistivity is controlled by porosity, saturation, grain size, and pore-water salinity, it serves as a proxy for lithological and hydrogeological properties [3] . Vertical electrical sounding (VES) provides one-dimensional resistivity-depth profiles at point locations, while two-dimensional electrical resistivity tomography (ERT) produces cross-sectional images that reveal lateral changes in aquifer geometry [4] . In the Indo-Gangetic Plain, several previous investigations have used VES to delineate aquifer zones, but most have been limited to small study areas of a few tens of square kilometres and have not integrated VES with 2-D ERT imaging or with quantitative Dar Zarrouk analysis [5,6] . The Dar Zarrouk parameterstransverse resistance (T) and longitudinal conductance (S)are derived from the resistivity model and provide estimates of aquifer transmissivity potential (from T) and protective capacity against surface contamination (from S) [7] . These parameters are especially useful in alluvial settings where borehole pump tests are expensive and spatially sparse. This research combined VES and ERT surveys across a 480 km² area of the central Indo-Gangetic Plain in Lucknow District, Uttar Pradesh, to delineate aquifer zones, estimate hydraulic properties from Dar Zarrouk parameters, and validate geoelectric predictions against existing pump test data. The work was coordinated through the Gangtok School of Natural Sciences with field surveys conducted during 2022.
Materials and Methods
Materials and Methods
Materials
The research area covers approximately 480 km² in the central Indo-Gangetic Plain around Lucknow District, Uttar Pradesh (approximately 26.8°N, 80.9°E). The terrain is flat to gently undulating, with surface elevations between 118 and 134 m above sea level. Subsurface geology consists of Quaternary alluvial deposits-alternating sand, silt, and clay layers-resting on Precambrian basement at depths exceeding 1,000 m [8] . Sixty-eight VES stations were surveyed between January and September 2022 using a Schlumberger electrode configuration with half-current electrode spacing (AB/2) increasing from 1.5 to 300 m. Current was injected through an ABEM Terrameter LS2 resistivity meter, and apparent resistivity values were computed from the measured voltage-current ratio at each electrode separation. Twelve 2-D ERT profiles, each 480-720 m long with 2-m electrode spacing, were surveyed using a Wenner-Schlumberger array to capture shallow and intermediate depth detail at selected sites [9] .
Methods
VES field curves were interpreted using the IPI2Win inversion software, which fits a layered earth model (3-6 layers) to the measured apparent resistivity data by iterative least-squares optimisation [10] . ERT data were inverted using RES2DINV with a robust (L1-norm) inversion scheme to produce 2-D resistivity sections. Layer resistivities from the VES models were correlated with known lithologies from 23 borehole logs within the research area to establish a resistivity-lithology calibration: sand and gravel (>40 Ω•m), silty sand (20-40 Ω•m), silt (8-20 Ω•m), and clay (<8 Ω•m) [11] . Aquifer thickness was defined as the cumulative thickness of layers with resistivity above 20 Ω•m. Dar Zarrouk parameters were computed for each VES station: transverse resistance T = Σ(ρᵢ × hᵢ) and longitudinal conductance S = Σ(hᵢ / ρᵢ), where ρᵢ and hᵢ are the resistivity and thickness of each layer. Transmissivity (T_h) was estimated from transverse resistance using the empirical relation T_h = k_r × T, where k_r was calibrated against 14 pumping test results available from the Central Ground Water Board [12] .
Field Survey Design
The 68 VES stations were distributed across the research area using a stratified grid approach, with spacing of approximately 2.5 km in areas of uniform surface geology and closer spacing (1.0-1.5 km) near mapped palaeochannel traces and known lithological transitions. Station locations were recorded with a Trimble R2 GNSS receiver (±0.5 m horizontal accuracy). The 12 ERT profiles were positioned to cross-cut key features identified from the VES reconnaissance: three profiles traversed suspected buried palaeochannels, four crossed the boundary between proximal and distal alluvial fan deposits, and five were placed in the clay-capped zone to image the geometry of confining layers. Each VES sounding required approximately 2.5 hours of field time, while each ERT profile took 4-6 hours depending on line length. All field measurements were conducted during the dry season (January-May) and post-monsoon period (September) to capture contrasting groundwater conditions [13] .
Calibration and Validation
The resistivity-lithology calibration was developed by comparing VES-derived layer resistivities with lithological logs from 23 boreholes located within 200 m of VES stations. The match between VES layer boundaries and borehole contacts was assessed by computing the rootmean-square error (RMSE) of predicted versus observed layer depths; the mean RMSE across all 23 comparison sites was 2.8 m, which is acceptable for the survey's depth of investigation (0-250 m). Transmissivity estimates derived from the Dar Zarrouk transverse resistance were validated against 14 pumping test transmissivity values (Central Ground Water Board records, 2018-2021). The correlation was strong (r = 0.84, p < 0.001), with a mean absolute error of 38 m²/day, confirming that the geoelectric proxy provides a reliable first-order estimate of hydraulic transmissivity in this alluvial setting [14] . The VES inversion models revealed a subsurface characterised by four to six layers, with marked lateral variation in layer resistivity and thickness across the five delineated hydrogeological zones.
Results
Results
Discussion
The five hydrogeological zones delineated by the geoelectric survey reflect the well-known facies architecture of the Indo-Gangetic alluvial system, in which grain size and aquifer quality decrease systematically from the proximal Himalayan piedmont toward the distal interfluves [15] . The buried palaeochannel zone stands out as the most productive aquifer target, with transmissivity nearly five times that of the clay-capped zone. This is consistent with the understanding that palaeochannels-relict river courses abandoned during Holocene avulsions-concentrate coarsegrained sediments into elongate sand bodies that act as preferential groundwater conduits [16] . Identifying these features from the surface is difficult because they are buried beneath 10-30 m of younger overbank deposits, but the geoelectric signature is distinctive: a high-resistivity anomaly (>150 Ω•m) flanked by lower-resistivity floodplain material on the ERT cross-sections.
The Dar Zarrouk approach proved to be a practical alternative to costly pumping tests for regional aquifer assessment. The correlation between transverse resistancederived transmissivity and pump test values (r = 0.84) is within the range of 0.75-0.90 reported by similar investigations in alluvial settings in Nigeria, Bangladesh, and the Jordan Valley [17,18] . The calibration constant k_r = 0.43 is site-specific and should not be transferred to other alluvial basins without local validation, but within the research area it provides a reliable first approximation for guiding well placement. The mean absolute error of 38 m²/day is small relative to the range of transmissivity values encountered (102-487 m²/day), suggesting that the geoelectric proxy captures the main spatial contrasts in aquifer quality. The longitudinal conductance map offers a complementary perspective: zones with high S values (>5 mhos) are better protected from surface contamination because the thick clay cap attenuates downward migration of pollutants [19] . In the Indo-Gangetic context, where agricultural runoff carrying nitrate and pesticide residues threatens shallow aquifer quality, this protective capacity information is valuable for land-use planning. The trade-off between yield and protection-buried channels offer the best water but the least natural protection-has practical implications for well design: high-yield wells in palaeochannel zones should incorporate longer sanitary seals and surface drainage controls to compensate for the absence of clay cover. One limitation is that the VES technique assumes horizontal layering, which may not hold near channel margins where sand bodies dip steeply. The 2-D ERT profiles partially address this by imaging lateral heterogeneity, but full threedimensional characterisation would require a denser survey grid that was beyond the scope of this research [20] .
Conclusion
This research applied vertical electrical sounding and 2-D electrical resistivity tomography to characterise aquifer geometry and hydraulic properties across a 480 km² area of the central Indo-Gangetic Plain. Five hydrogeological zones were delineated-proximal fan, mid-plain, distal plain, buried palaeochannel, and clay-capped-each with distinct resistivity signatures and aquifer characteristics. The buried palaeochannel zone emerged as the most productive target, with the highest transmissivity (487 m²/day) and thickest aquifer (47.3 m), while the clay-capped zone offered the greatest natural protection against surface contamination but the lowest yield. The Dar Zarrouk parameter approach provided transmissivity estimates that correlated well with pumping test data (r = 0.84), confirming its value as a cost-effective regional screening tool. Transverse resistance mapped the spatial distribution of aquifer productivity, and longitudinal conductance identified zones of high protective capacitycomplementary information that supports both well siting and groundwater vulnerability assessment. These findings demonstrate that integrated geoelectric surveys can reliably map aquifer heterogeneity in thick alluvial sequences at a fraction of the cost of a boreholebased investigation programme. In the Indo-Gangetic Plain, where groundwater demand for irrigation continues to rise and aquifer depletion is accelerating in many districts, the ability to identify productive aquifer zones before drilling can save both money and water. Future research should extend the survey grid to capture three-dimensional aquifer geometry, incorporate time-lapse resistivity monitoring to track seasonal water-table fluctuations, and integrate geoelectric data with groundwater flow modelling to predict long-term extraction impacts on the regional water balance.
Acknowledgement
Acknowledgements
Figures and tables from the paper
| Zone | VES Stations (n) | Aquifer Thickness (m) | Resistivity (Ω·m) | Trans. Resist. (Ω·m²) | Long. Conduct. (mhos) | T h (m²/d) |
|---|---|---|---|---|---|---|
| Proximal Fan | 14 | 34.8 ± 6.4 | 68–187 | 4,218 | 2.4 | _ 384 |
| Mid-Plain | 16 | 28.6 ± 5.8 | 32–124 | 2,847 | 4.1 | 261 |
| Distal Plain | 12 | 22.1 ± 5.1 | 18–72 | 1,634 | 6.8 | 148 |
| Buried Channel | 14 | 47.3 ± 8.2 | 84–213 | 5,328 | 1.9 | 487 |
| Clay-Capped | 12 | 18.4 ± 4.6 | 24–68 | 1,127 | 8.7 | 102 |
Table text extracted from the original PDF; superscript letters are shown inline. The original table image is below.
View original table image
References
20 in the original paper- Singh IB. Geological evolution of the Ganga Plain-an overview. Journal of the Palaeontological Society of India. 1996;41:99-137.
- Rodell M, Velicogna I, Famiglietti JS. Satellite-based estimates of groundwater depletion in India. Nature. 2009;460(7258):999-1002.
- Telford WM, Geldart LP, Sheriff RE. Applied geophysics. Cambridge University Press, 2nd Edition. 1990;1:1-770.
- Loke MH, Barker RD. Rapid least-squares inversion of apparent resistivity pseudosections by a quasi-Newton method. Geophysical Prospecting. 1996;44(1):131-152.
- Shukla S, Mohan A. VES studies for groundwater exploration in the Indo-Gangetic alluvium around Lucknow. Journal of the Geological Society of India. 2011;77(4):383-394.
- Srivastava PK, Bhattacharya AK. Groundwater assessment through an integrated approach using remote sensing, GIS and resistivity techniques: A case study from a hard rock terrain. International Journal of Remote Sensing. 2006;27(20):4599-4620.
- Niwas S, Singhal DC. Estimation of aquifer transmissivity from Dar-Zarrouk parameters in porous media. Journal of Hydrology. 1981;50(1-3):393-399.
- Sahu S, Saha D. Eminent sources of fluoride in groundwater in the Indo-Gangetic alluvial aquifer of eastern India. Environmental Geology. 2015;73:46274639.
- Dahlin T. The development of DC resistivity imaging techniques. Computers and Geosciences. 2001;27(9):1019-1029.
- Bobachev AA, Modin IN, Shevnin VA. IPI2Win: A windows software for an automatic interpretation of resistivity sounding data. Moscow State University. 2000;1:1-25.
- Maillet R. The fundamental equations of electrical prospecting. Geophysics. 1947;12(4):529-556.
- Heigold PC, Gilkeson RH, Cartwright K, Reed PC. Aquifer transmissivity from surficial electrical methods. Groundwater. 1979;17(4):338-345.
- Reynolds JM. An introduction to applied and environmental geophysics. John Wiley and Sons, 2nd Edition. 2011;1:1-696.
- Huntley D. Relations between permeability and electrical resistivity in granular aquifers. Groundwater. 1986;24(4):466-474.
- Sinha R, Friend PF. River systems and their sediment flux, Indo-Gangetic plains, northern Bihar, India. Sedimentology. 1994;41(4):825-845.
- Sinha R, Jain V, Babu GP, Ghosh S. Geomorphic characterization and diversity of the fluvial systems of the Gangetic Plains. Geomorphology. 2005;70(34):207-225.
- Ezeh CC. Geoelectrical studies for estimating aquifer hydraulic properties in Enugu State, Nigeria. International Journal of Physical Sciences. 2011;6(14):3319-3329.
- Majumdar RK, Majumdar N, Mukherjee AL. Geoelectric investigations in Bakreswar geothermal area, West Bengal, India. Journal of Applied Geophysics. 2000;45(3):187-202.
- Henriet JP. Direct applications of the Dar Zarrouk parameters in ground water surveys. Geophysical Prospecting. 1976;24(2):344-353.
- Chambers JE, Wilkinson PB, Kuras O, Ford JR, Gunn DA, Meldrum PI. Three-dimensional geophysical anatomy of an active landslide in Lias Group mudrocks. Geomorphology. 2011;125(4):472-484