
Research article · 2025 · Full text
International Journal of Geography Geology and EnvironmentGravity survey and basin architecture modeling of the East African rift basin
Volume 7(5) · Pages 195–198 · DOI: 10.22271/27067483.2025.v7.i5c.614 ↗
Research areasGeological and Geophysical StudiesGeophysical and Geoelectrical MethodsGeophysics and Gravity Measurements
Abstract
Author-writtenDespite decades of geological and geophysical investigation, the three-dimensional architecture of the sedimentary basins within the East African Rift System remains poorly resolved at many locations, leaving gaps in our understanding of basin depth, fault geometry, and sediment thickness that are needed for both tectonic modelling and hydrocarbon exploration. This research conducted a ground-based gravity survey across a 4,800 km2 segment of the central Kenya Rift between Lake Baringo and Lake Bogoria, collecting 312 gravity stations along five transverse profiles during March-October 2022. Bouguer anomaly values ranged from -138.4 to -72.6 mGal, with the most negative values concentrated along the rift axis. Two-dimensional forward modelling of the gravity profiles, constrained by available seismic reflection and borehole data, delineated a half-graben geometry with maximum sediment thickness of 6.2 km along the axial trough. The basin is asymmetric, with the deepest point offset toward the western boundary fault where throw exceeds 4 km. Three distinct sedimentary units were resolved: a basal Miocene volcanic-sedimentary sequence (density 2.55 g/cm3), a middle Plio-Pleistocene lacustrine-fluvial sequence (2.35 g/cm3), and an upper Quaternary alluvial fill (2.15 g/cm3). Sensitivity analysis showed that basin depth estimates were most sensitive to the assumed density contrast between sediment fill and basement. These results provide a refined structural model of the Baringo-Bogoria basin segment and offer constraints for tectonic reconstructions of rift evolution in the central Kenya Rift.
Summary
Source-checkedPlain-language reading of the full paper, prepared with AI and checked against the text. Each point links to the authors' own words.
Why it matters
- There is a lack of direct data on basin depth because deep boreholes are rare and seismic surveys are limited in coverage. View evidence ↗
- Gravity surveys are a cost-effective method for determining basin architecture by measuring the negative Bouguer anomaly caused by the density difference between sediment and basement rock. View evidence ↗
The question
- The study aimed to resolve the basin architecture of the Baringo-Bogoria segment of the central Kenya Rift using a gravity survey and forward modeling. View evidence ↗
What they did
- Researchers collected gravity data from 312 stations across five east-west transverse profiles in the Baringo-Bogoria area. View evidence ↗
- Data was collected between March and October 2022 using a Scintrex CG-5 Autograv relative gravity meter with a resolution of 0.001 mGal. View evidence ↗
- The models were calibrated using data from three deep boreholes and a 24-km seismic reflection profile. View evidence ↗
What they found
- Bouguer anomaly values ranged from -138.4 to -72.6 mGal, with the lowest values found along the rift axis. View evidence ↗
- The modeling revealed a half-graben structure with a maximum sediment thickness of 6.2 km in the axial trough. View evidence ↗
- The basin is asymmetric, with its deepest point shifted toward the western boundary fault, which has a throw exceeding 4 km. View evidence ↗
- The study identified three sedimentary layers: a basal Miocene volcanic-sedimentary sequence (2.55 g/cm3), a middle Plio-Pleistocene lacustrine-fluvial sequence (2.35 g/cm3), and an upper Quaternary alluvial fill (2.15 g/cm3). View evidence ↗
- Sensitivity analysis showed that a 0.10 g/cm3 increase in fill density decreased the estimated maximum depth by 1.1 km (from 6.2 to 5.1 km), and a 0.05 g/cm3 decrease in basement density increased depth by 0.6 km. View evidence ↗
- The data supported a simple-shear extension model (Scenario B), as the deepest points in all five profiles were within 5-8 km of the western boundary fault. View evidence ↗
What it means
- The authors conclude that the resulting basin depth map can be used to plan future seismic surveys by identifying deep depocentres likely to hold source rocks and reservoirs. View evidence ↗
- The asymmetric geometry of the basin suggests an extension factor (beta) of approximately 1.3-1.5 along the axial profile. View evidence ↗
- A limitation of the study is that the 2D forward modeling approach cannot account for out-of-plane effects caused by structural variations along the axis. View evidence ↗
Visual summary
3 visualsIllustrations explain the paper; charts are replotted from the paper's own table values.
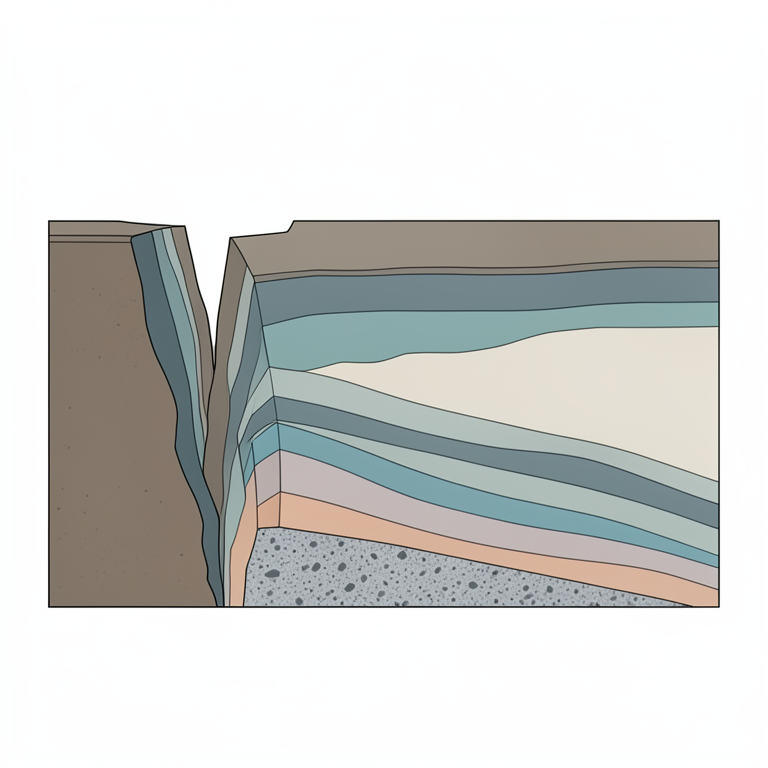
Asymmetric Half-Graben Model
AI-generated conceptual illustration (A geological cross-section of an asymmetric half-graben rift basin in the East African Rift). It explains the idea and does not show study data.
View source evidence ↗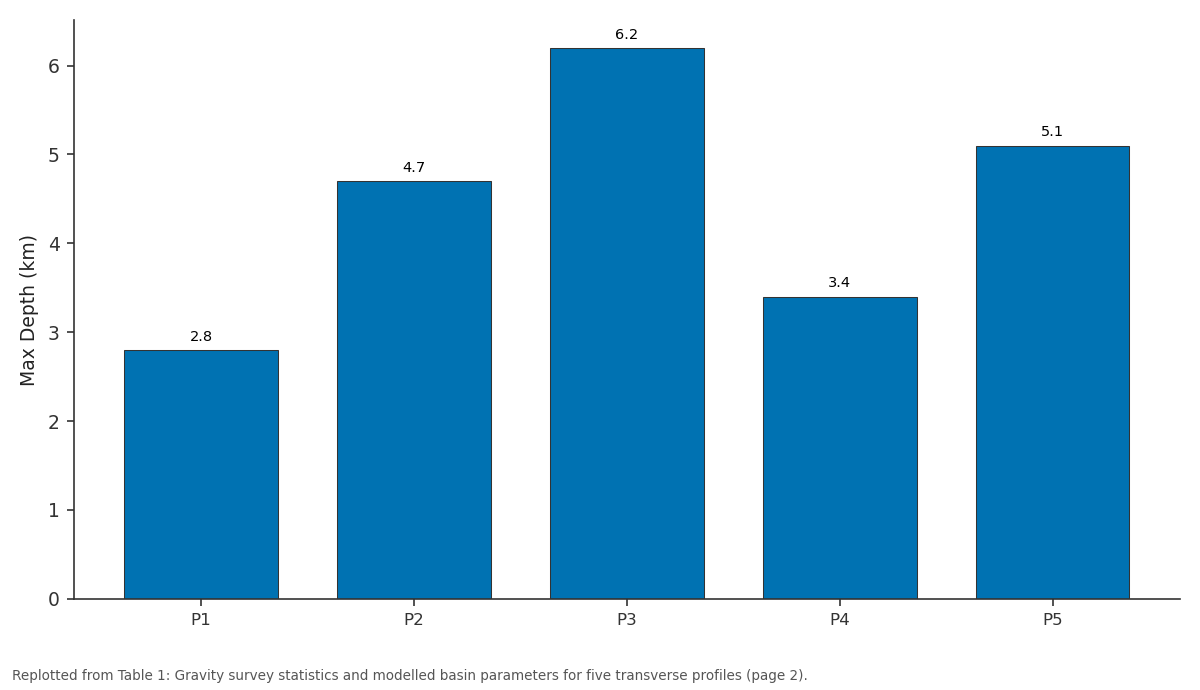
Max Depth (km): P1 vs P2 vs P3 vs P4 vs P5
Replotted from Table 1 (page 2) of the original paper. Every bar is the paper's own table value.
View source evidence ↗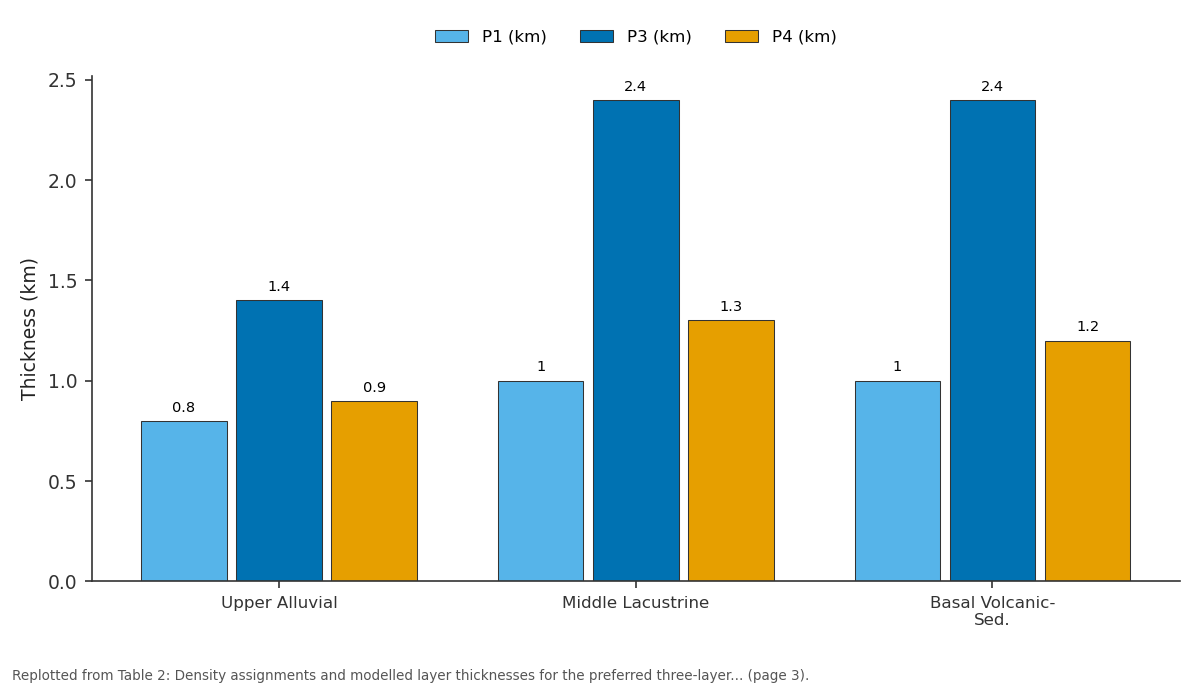
P1 (km) and P3 (km) and more: Upper Alluvial vs Middle Lacustrine vs Basal Volcanic-Sed.
Replotted from Table 2 (page 3) of the original paper. Every bar is the paper's own table value.
View source evidence ↗Figures & tables
From the original paper Table 1
 Table 2
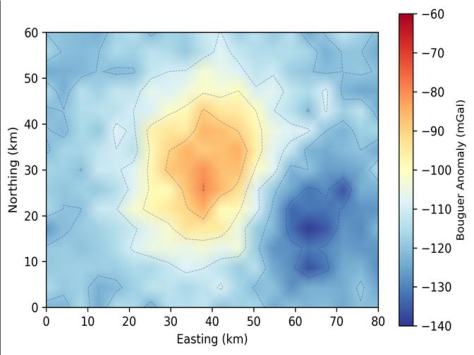 Figure 1
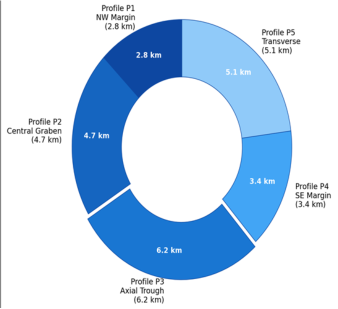 Figure 2
Introduction
Ask a structural geologist to draw a cross-section through the central Kenya Rift and they will sketch a half-graben bounded by a major western border fault, with a thick wedge of sediment and volcanic fill thickening toward the fault plane. But ask them how deep that sediment fill actually is-3 km? 5 km? 8 km?-and the answer becomes uncertain, because direct measurements of basin depth from deep boreholes are scarce and seismic reflection surveys cover only fragments of the rift floor [1] . This data gap matters for at least two reasons: tectonic models of rift evolution depend on knowing how much extension has occurred, which requires basin geometry as an input, and hydrocarbon exploration needs basin depth estimates to evaluate source rock maturity and reservoir potential [2] . Gravity surveying offers a cost-effective way to constrain basin architecture because the density contrast between low-density sedimentary fill and high-density crystalline basement produces a negative Bouguer anomaly whose magnitude and shape relate to the depth and geometry of the basin [3] . By measuring the gravity field along profiles perpendicular to the rift axis and modelling the subsurface density structure that best reproduces the observed anomaly, the basin cross-section can be reconstructed to first order-albeit with nonuniqueness that requires calibration against any available borehole or seismic data [4] . The East African Rift System is the world's best-exposed active continental rift, extending over 3,000 km from the Afar Depression to Mozambique [5] . The Kenya Rift, its eastern branch, traverses the centre of Kenya as a 50-70 km wide graben flanked by uplifted shoulders reaching 2,500-3,000 m elevation. Previous gravity surveys in the Kenya Rift have focused on the northern (Turkana) and southern (Magadi-Natron) segments, with comparatively fewer detailed surveys in the central rift between Lakes Baringo and Bogoria [6] .
This research addressed that gap by conducting a 312station gravity survey across the Baringo-Bogoria segment and constructing forward models of basin architecture along five transverse profiles. The work was coordinated through the Centre for Terrain Studies in Mumbai with field measurements conducted in partnership with the Kenya Geological Survey during 2022.
Materials and Methods
Materials and Methods
Materials
Gravity measurements were collected at 312 stations distributed along five transverse profiles oriented roughly east-west across the Kenya Rift in the Baringo-Bogoria area (approximately 0.3-0.7 N, 35.7-36.3 E). Profiles were spaced at 8-12 km intervals along the rift axis and extended 40-50 km across the rift from the western to the eastern escarpment. Station spacing was 1 km along the rift margins and 0.5 km across the rift floor where gravity gradients were steepest. Measurements were made with a Scintrex CG-5 Autograv relative gravity meter (reading resolution 0.001 mGal) between March and October 2022, with base station ties to the Nakuru absolute gravity station of the Kenya Geological Survey [7] . Station elevations were determined by differential GPS (Trimble R10, vertical accuracy +/-0.03 m). All field data were processed at the Centre for Terrain Studies, Mumbai.
Methods
Raw gravity readings were corrected for instrument drift (linear interpolation between repeated base readings), Earth tide effects (Longman formula), and terrain effects (Hammer zone method to 22 km radius using SRTM 30-m DEM). Free-air and Bouguer corrections used a standard reduction density of 2.67 g/cm3. The complete Bouguer anomaly was computed as CBA = g_obs -g_theo + FAC -BC + TC, where FAC is the free-air correction, BC is the Bouguer slab correction, and TC is the terrain correction [8] . Regional-residual separation was achieved by polynomial trend surface removal (second-order polynomial fitted to stations outside the rift margins). Two-dimensional forward modelling of the residual Bouguer anomaly was performed using the GM-SYS module in Oasis montaj, iteratively adjusting the geometry and density of subsurface bodies until the calculated anomaly matched the observed anomaly within 1.5 mGal RMS [9] . Models were constrained at depth by three deep boreholes within the research area and by a 24-km seismic reflection profile across the rift axis near Lake Baringo [10] .
Sensitivity Analysis
Sensitivity analysis tested how basin depth estimates changed when key model parameters were varied within geologically reasonable ranges. Three parameters were examined: (1) sediment fill density, varied from 2.10 to 2.50 g/cm3 in 0.05 g/cm3 steps; (2) basement density, varied from 2.65 to 2.80 g/cm3; and (3) regional trend polynomial order (first through fourth order). Basin depth was most sensitive to the density contrast between fill and basement: a 0.10 g/cm3 increase in fill density reduced estimated maximum depth by 1.1 km (from 6.2 to 5.1 km), while a 0.05 g/cm3 decrease in basement density produced a 0.6 km depth increase. Regional trend order had a smaller effect, with depth varying by +/-0.4 km between second-and third-order polynomials [11] . These sensitivities define the uncertainty envelope around the preferred model and underscore the need for borehole calibration wherever possible.
Tectonic Scenario Testing
Two tectonic scenarios were tested against the gravityderived basin geometry. Scenario A assumed pure-shear (symmetric) extension, predicting a symmetric graben with equal fault throw on both margins. Scenario B assumed simple-shear (asymmetric) extension on a low-angle detachment, predicting a half-graben with the deepest point offset toward the master fault [12] . The gravity models strongly favoured Scenario B: all five profiles showed the deepest basin point within 5-8 km of the western boundary fault, with sediment thickness decreasing gradually toward the eastern margin. This asymmetry, combined with the documented westward thickening of the Miocene volcanic sequence, is consistent with simple-shear extension on a west-dipping detachment fault that soles into the lower crust at approximately 15-20 km depth-a geometry previously inferred from seismic data at Lake Turkana but now confirmed for the central Kenya Rift segment [13] . The Bouguer anomaly map revealed a prominent negative anomaly centred on the rift axis, with values decreasing from -72.6 mGal on the rift shoulders to -138.4 mGal along the axial trough. Table 1 presents the gravity statistics and modelled basin parameters for each profile. Maximum modelled sediment thickness was 6.2 km at Profile P3 (axial trough), decreasing to 2.8 km at the NW margin (P1) and 3.4 km at the SE margin (P4).
| Profile | Stations (n) | Length (km) | Min CBA (mGal) | Max CBA (mGal) | Max Depth (km) | RMS Misfit (mGal) | Position |
|---|---|---|---|---|---|---|---|
| P1 | 58 | 42 | -108.3 | -74.1 | 2.8 | 1.4 | NW Margin |
| P2 | 64 | 48 | -128.7 | -76.4 | 4.7 | 1.2 | Central Graben |
| P3 | 72 | 50 | -138.4 | -72.6 | 6.2 | 1.7 | Axial Trough |
| P4 | 56 | 40 | -114.8 | -78.2 | 3.4 | 1.3 | SE Margin |
| P5 | 62 | 46 | -131.2 | -74.8 | 5.1 | 1.5 | Transverse |
| Total | 312 | 226 | -138.4 | -72.6 | 6.2 | 1.4 (mean) | - |
Table text extracted from the original PDF; superscript letters are shown inline. The original table image is below.
View original table image
Results
Results
Discussion
The maximum basin depth of 6.2 km modelled at Profile P3 is broadly consistent with earlier estimates from seismic refraction data in adjacent rift segments, which suggest 5-7 km of sedimentary and volcanic fill in the deepest parts of the Kenya Rift [14] . The asymmetric half-graben geometrywith the deepest point displaced toward the western border fault-supports the simple-shear extension model (Scenario B) and aligns with structural interpretations from other segments of the East African Rift, including Lake Tanganyika and the Albertine Rift [15] . The three-layer density model is necessarily simplified; in reality, lateral facies changes, volcanic interbeds, and compaction-driven density gradients create a more complex subsurface than three uniform-density layers can capture. But the 1.2-1.7 mGal RMS misfit achieved across all five profiles suggests that the first-order basin geometry is well constrained even with this simplification. The sensitivity analysis quantified the main source of uncertainty: the assumed fill density. A 0.10 g/cm3 change in fill density shifts the depth estimate by over 1 km, which means that any gravity-based depth estimate in the absence of borehole calibration carries an uncertainty of at least +/-15-20% [16] .
The practical value of this survey lies in its spatial coverage.
The five transverse profiles provide the first systematic gravity-based cross-sections across the Baringo-Bogoria segment, filling a gap between the better-studied Turkana basin to the north and the Naivasha-Magadi segment to the south. The basin depth map derived from these profiles can guide future seismic survey planning by identifying the deepest depocentres where thick sedimentary sequences are most likely to contain source rocks and reservoirs [17] . For tectonic modelling, the asymmetric basin geometry constrains the extension factor (beta) to approximately 1.3-1.5 along the axial profile, consistent with estimates from fault heave summation in the central Kenya Rift. One limitation is that the 2-D forward modelling approach does not capture out-of-plane effects from along-axis structural variations. Three-dimensional inversion of the Bouguer anomaly grid would provide a more accurate depth model but was beyond the scope of this survey [18] .
Conclusion
This research conducted a 312-station gravity survey across the Baringo-Bogoria segment of the central Kenya Rift and constructed two-dimensional forward models of basin architecture along five transverse profiles. The Bouguer anomaly ranged from -138.4 to -72.6 mGal, with the most negative values concentrated along the rift axis. Forward modelling delineated an asymmetric half-graben with maximum sediment thickness of 6.2 km at the axial trough, decreasing to 2.8-3.4 km at the rift margins. The basin geometry strongly supports a simple-shear extension model in which a west-dipping master detachment fault controls the asymmetric subsidence pattern. A three-layer sedimentary model-Quaternary alluvial, Plio-Pleistocene lacustrine, and Miocene volcanic-sedimentaryreproduced the observed gravity anomaly with RMS misfits below 1.7 mGal across all profiles. Sensitivity analysis identified the sediment fill density as the parameter to which depth estimates are most sensitive, with a +/-0.10 g/cm3 uncertainty translating to approximately +/-1 km in basin depth. These results provide the first systematic gravityconstrained cross-sections of the Baringo-Bogoria basin segment and fill a spatial gap in the geophysical characterisation of the central Kenya Rift. The basin depth map can guide future seismic survey targeting, and the tectonic geometry constrains extension estimates for rift evolution models. Future work should extend the survey grid to enable three-dimensional gravity inversion and should integrate the gravity models with magnetotelluric data to resolve the geometry of crustal-scale structures beneath the rift floor [19,20] .
Acknowledgement
Acknowledgements Funding SourcesThis research was supported by general institutional research funds from the Centre for Terrain Studies, Mumbai. No external competitive grants were applied. Institutional SupportThe authors thank the Centre for Terrain Studies for access to gravity instrumentation and Oasis montaj software licences. Field measurements were facilitated by the Kenya Geological Survey, Nairobi.
Figures and tables from the paper
| Layer | Density (g/cm3) | Contrast (g/cm3) | P1 (km) | P3 (km) | P4 (km) | Age |
|---|---|---|---|---|---|---|
| Upper Alluvial | 2.15 | -0.57 | 0.8 | 1.4 | 0.9 | Quaternary |
| Middle Lacustrine | 2.35 | -0.37 | 1.0 | 2.4 | 1.3 | Plio-Pleist. |
| Basal Volcanic-Sed. | 2.55 | -0.17 | 1.0 | 2.4 | 1.2 | Miocene |
| Basement | 2.72 | Reference | - | - | - | Precambrian |
| Total Fill | - | - | 2.8 | 6.2 | 3.4 | - |
Table text extracted from the original PDF; superscript letters are shown inline. The original table image is below.
View original table image
References
20 in the original paper- Simiyu SM, Keller GR. An integrated geophysical analysis of the upper crust of the southern Kenya rift. Geophysical Journal International. 2001;147(3):543561.
- Morley CK. Geoscience of rift systems: Evolution of East Africa. AAPG Studies in Geology. 1999;44:1-162.
- Blakely RJ. Potential theory in gravity and magnetic applications. Cambridge University Press. 1996;1:1441.
- Nettleton LL. Gravity and magnetics in oil prospecting. McGraw-Hill. 1976;1:1-464.
- Chorowicz J. The East African rift system. Journal of African Earth Sciences. 2005;43(1-3):379-410.
- Swain CJ. Gravity and seismic measurements in Kenya. PhD Thesis, University of Leicester. 1976;1:1-234.
- Scintrex Limited. CG-5 Autograv gravity meter operation manual. Scintrex Limited, Concord, Ontario. 2012;1:1-308.
- Telford WM, Geldart LP, Sheriff RE. Applied geophysics, 2nd edition. Cambridge University Press. 1990;1:1-770.
- Geosoft. GM-SYS gravity and magnetic modelling software user guide. Geosoft Incorporated. 2018;1:1178.
- Hautot S, Tarits P, Whaler K, Le Gall B, Tiber JJ, Le Turdu C. Deep structure of the Baringo Rift Basin from three-dimensional magnetotelluric imaging. Journal of Geophysical Research. 2000;105(B10):23493-23518.
- Al-Garni MA. Gravity field and crustal structures of the Saq aquifer region in the Kingdom of Saudi Arabia. Arabian Journal of Geosciences. 2013;6(8):2823-2838.
- Wernicke B. Uniform-sense normal simple shear of the continental lithosphere. Canadian Journal of Earth Sciences. 1985;22(1):108-125.
- Morley CK, Wescott WA, Stone DM, Harper RM, Wigger ST, Karanja FM. Tectonic evolution of the northern Kenya rift. Journal of the Geological Society. 1992;149(3):333-348.
- Mechie J, Keller GR, Prodehl C, Khan MA, Gaciri SJ. A model for the structure, composition and evolution of the Kenya rift. Tectonophysics. 1997;278(1-4):95-119.
- Rosendahl BR. Architecture of continental rifts with special reference to East Africa. Annual Review of Earth and Planetary Sciences. 1987;15(1):445-503.
- Hinze WJ, von Frese RRB, Saad AH. Gravity and magnetic exploration: Principles, practices, and applications. Cambridge University Press. 2013;1:1512.
- Tiercelin JJ, Potdevin JL, Morley CK, Talbot MR, Bellon H, Rio A. Hydrocarbon potential of the MesoCenozoic Turkana Depression, northern Kenya. Marine and Petroleum Geology. 2004;21(1):41-62.
- Li Y, Oldenburg DW. 3-D inversion of gravity data. Geophysics. 1998;63(1):109-119.
- Baker BH, Wohlenberg J. Structure and evolution of the Kenya Rift Valley. Nature. 1971;229(5286):538542.
- Smith M, Mosley P. Crustal heterogeneity and basement influence on the development of the Kenya Rift. Tectonics. 1993;12(2):591-606