
Research article · 2026 · Full text
International Journal of Geography Geology and EnvironmentFeeding biology of flat needle fish, Ablennes hians (Valenciennes, 1846) from Veraval fishing harbour, Gujarat
Volume 8(6) · Pages 52–59 · DOI: 10.22271/27067483.2026.v8.i6a.785 ↗
Research areasFish Biology and Ecology StudiesMarine and fisheries researchIchthyology and Marine Biology
Abstract
Author-writtenThe Present study investigated the feeding biology of Flat Needle Fish, (Ablennes hians) in the Veraval fishing harbour, Gujarat, a total of 300 specimens were collected in August 2024 to May 2025, and different indices of Feeding intensity, Index of Relative Importance (IRI), and GaSI (Gastro-somatic Index) were taken into consideration. Stomach fullness analysis showed that 29.33% of specimens had empty stomachs, while the remaining individuals exhibited varying degrees of feeding activity. Diet composition revealed that A. hians is predominantly carnivorous, feeding mainly on fishes, crustaceans, and molluscs. Fish constituted the dominant prey group with the highest IRI (63.71%), followed by crustaceans (29.96%) and molluscs (6.34%). Semi-digested fish remains formed the major dietary component (52.58%). Sardines sp., Stolepherus sp., Bregmaceros mcclellandi, and Nemipterus japonicus were also recorded in varying proportions throughout the year. Among crustaceans, Acetes sp. was most abundant in March, September, and October, while squid peaked in November and was absent in March. Seasonal variations in feeding activity were evident from GaSI values, with the highest overall value recorded in October (3.677 ± 0.740) and the lowest in March (1.959 ± 0.090).
Summary
Source-checkedPlain-language reading of the full paper, prepared with AI and checked against the text. Each point links to the authors' own words.
Why it matters
- Flat needle fish (Ablennes hians) are commercially significant in pelagic fisheries due to their high flavor quality. View evidence ↗
- Studying the feeding habits of fish is essential for understanding their habitat, dietary preferences, and trophic relationships. View evidence ↗
- Analyzing changes in feeding behavior provides critical data on predator-prey interactions, which aids in the conservation and management of fisheries. View evidence ↗
The question
- The study aimed to investigate the feeding biology of the Flat Needle Fish (Ablennes hians) at the Veraval fishing harbour in Gujarat. View evidence ↗
What they did
- Researchers collected 300 specimens of A. hians monthly from August 2024 to May 2025 at the Veraval fishing harbour in Gujarat, India. View evidence ↗
- The study utilized three primary metrics: feeding intensity, the Index of Relative Importance (IRI), and the Gastro-somatic Index (GaSI). View evidence ↗
- Dietary analysis was performed by dissecting the gut and identifying and counting each food item present. View evidence ↗
What they found
- Stomach fullness analysis revealed that 29.33% of the specimens had empty stomachs. View evidence ↗
- The Index of Relative Importance (IRI) identified fish as the primary prey (63.71%), followed by crustaceans (29.96%) and molluscs (6.34%). View evidence ↗
- Within the fish prey group, semi-digested fish were the most significant dietary component, making up 52.58% of the diet. View evidence ↗
- Among crustaceans, Acetes sp. reached its highest abundance in the months of March, September, and October. View evidence ↗
- Squid abundance peaked in November and was completely absent from the diet in March. View evidence ↗
- The Gastro-somatic Index (GaSI) showed seasonal feeding variations, peaking in October (3.677 ± 0.740) and reaching its minimum in March (1.959 ± 0.090). View evidence ↗
- Male A. hians exhibited their highest Gastro-Somatic Index (GaSI) in October, with a value of 4.616. View evidence ↗
- Female A. hians reached their highest Gastro-Somatic Index (GaSI) in September, with a value of 2.778. View evidence ↗
What it means
- The authors conclude that A. hians is a carnivorous predator occupying a mid-to-upper trophic level in the coastal marine ecosystem, primarily feeding on fish and crustaceans. View evidence ↗
- The authors state that seasonal variations in feeding intensity, as shown by GaSI, likely reflect changes linked to prey availability and reproductive cycles. View evidence ↗
Visual summary
3 visualsIllustrations explain the paper; charts are replotted from the paper's own table values.
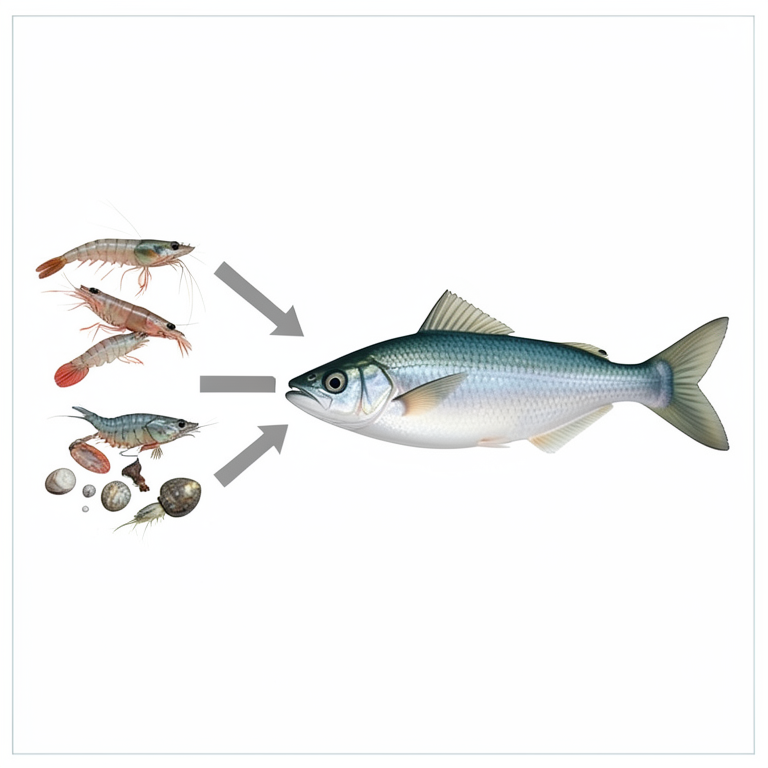
Trophic Position of A. hians
AI-generated conceptual illustration (Flat needle fish (Ablennes hians), small forage fish, shrimp, and small mollusks). It explains the idea and does not show study data.
View source evidence ↗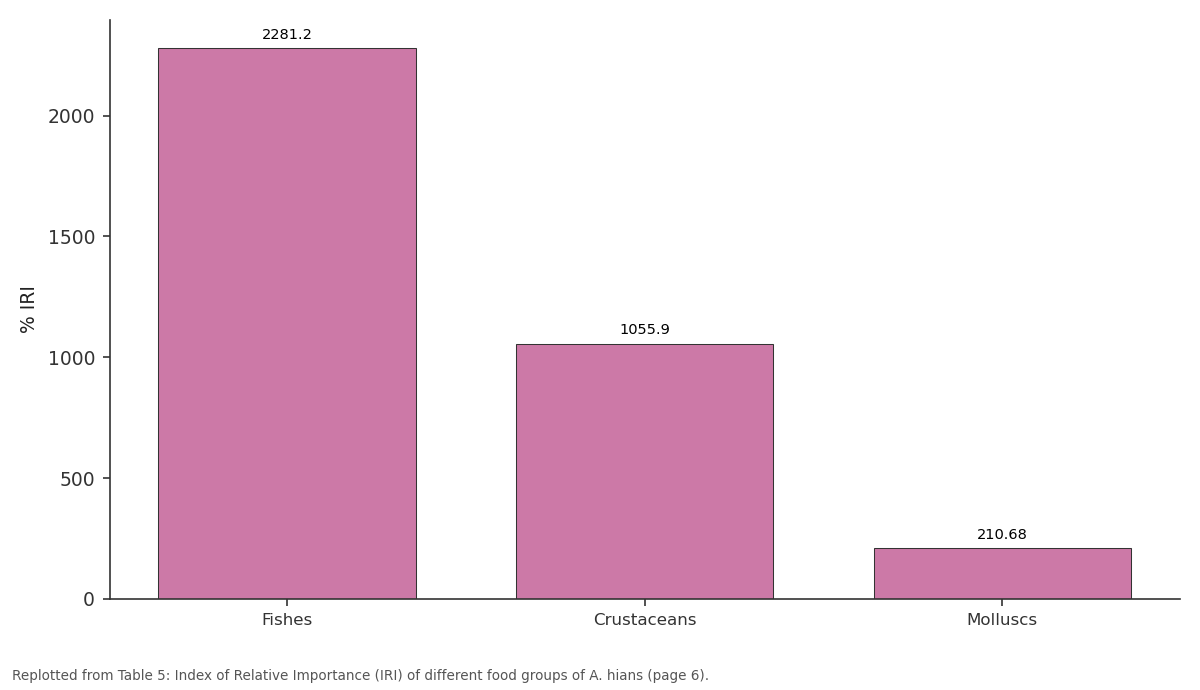
IRI: Fishes vs Crustaceans vs Molluscs
Replotted from Table 5 (page 6) of the original paper. Every bar is the paper's own table value.
View source evidence ↗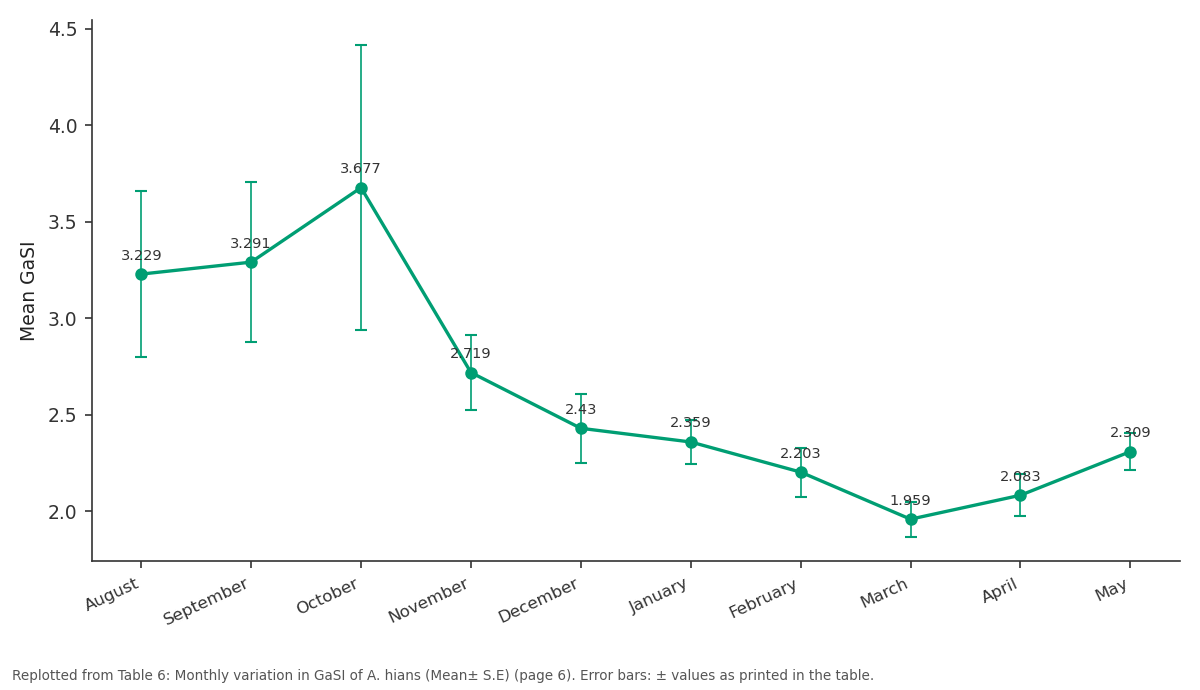
Pooled data: August vs September vs October vs November vs December
Replotted from Table 6 (page 6) of the original paper. Every bar is the paper's own table value.
View source evidence ↗Figures & tables
From the original paper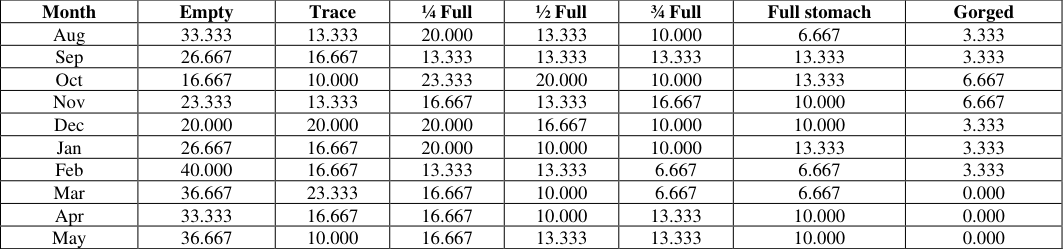 Table 1
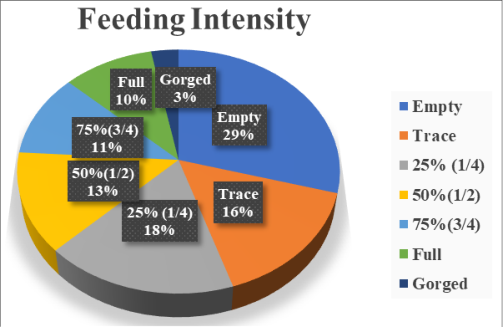 Figure 1
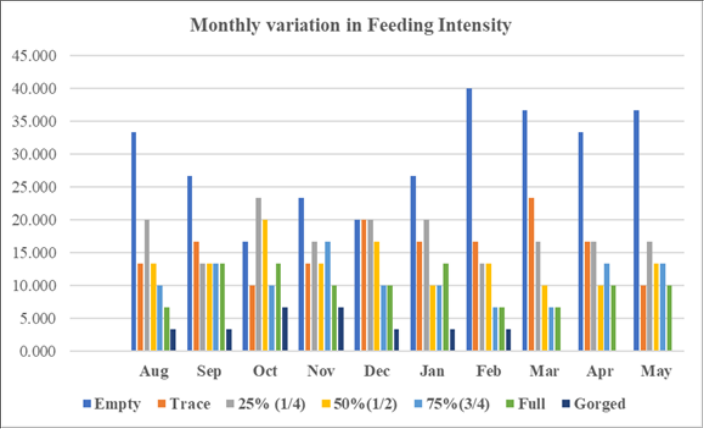 Figure 2
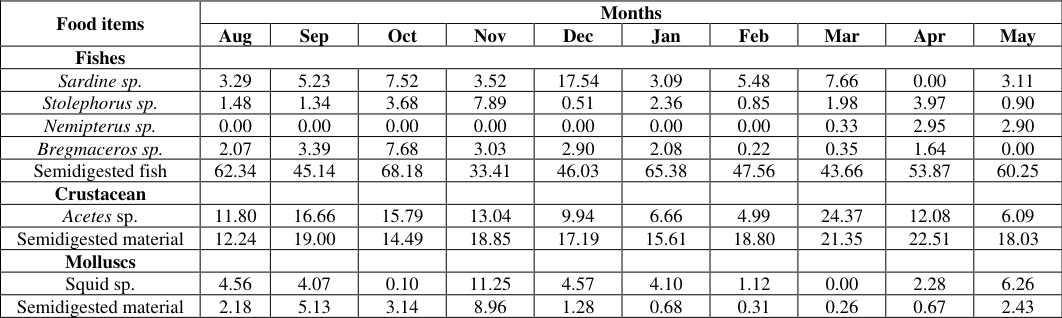 Table 2
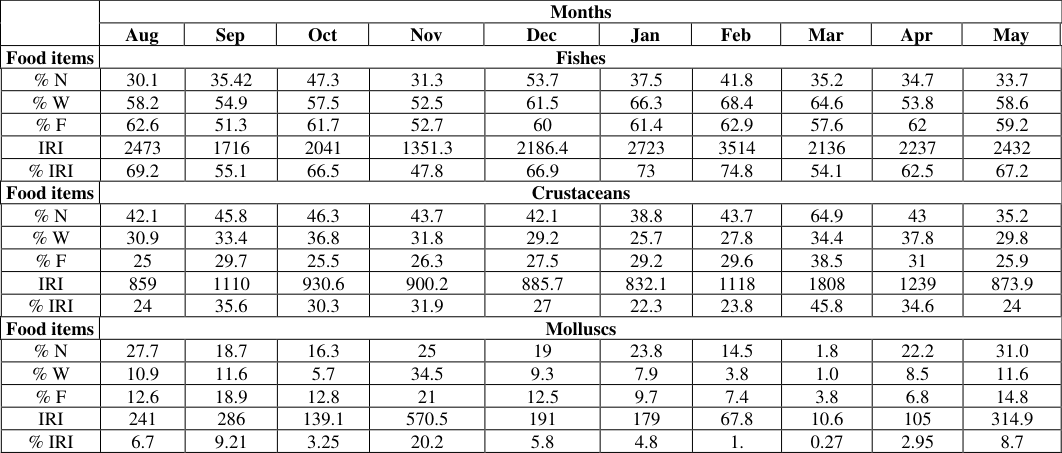 Table 3
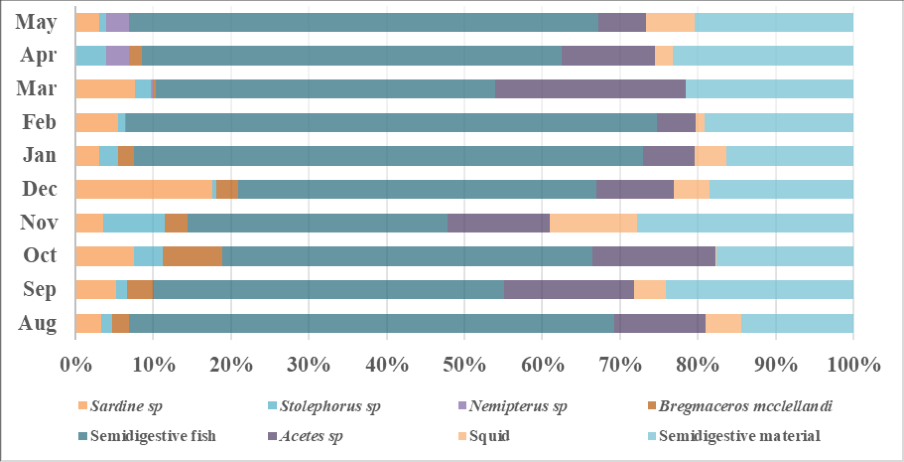 Figure 3
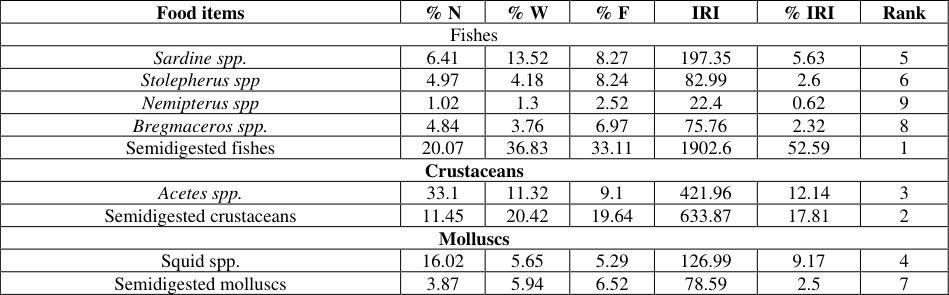 Table 4
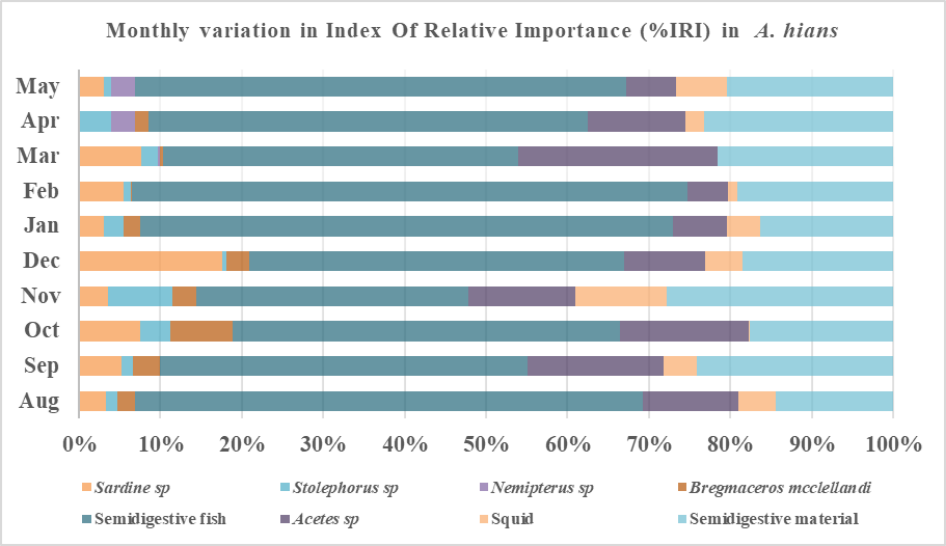 Figure 4
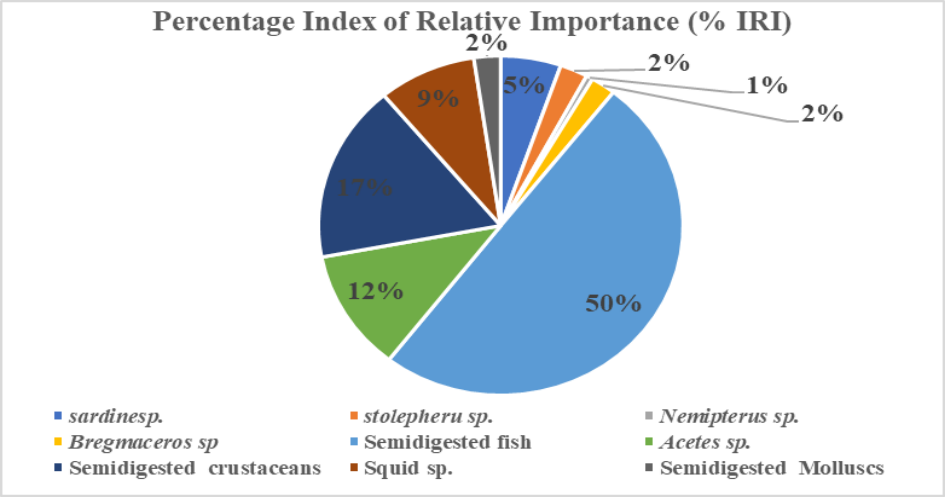 Figure 5
 Table 5
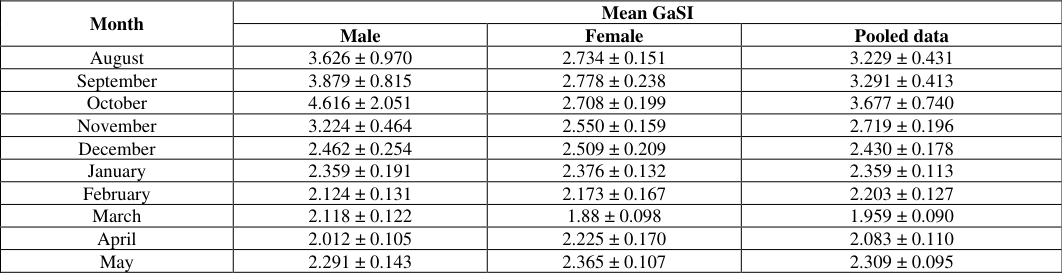 Table 6
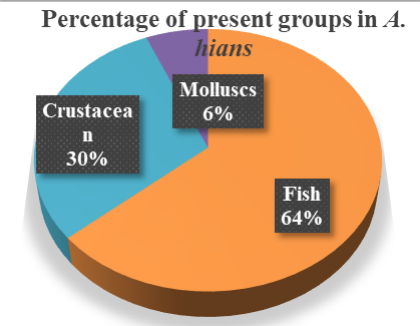 Figure 6
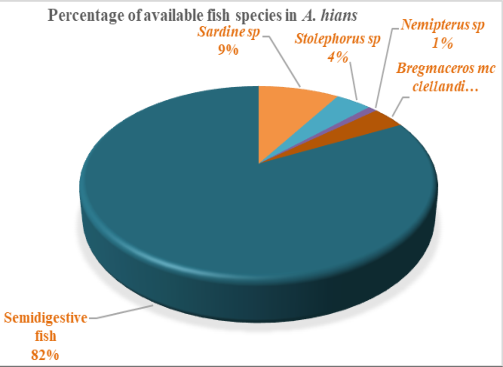 Figure 7
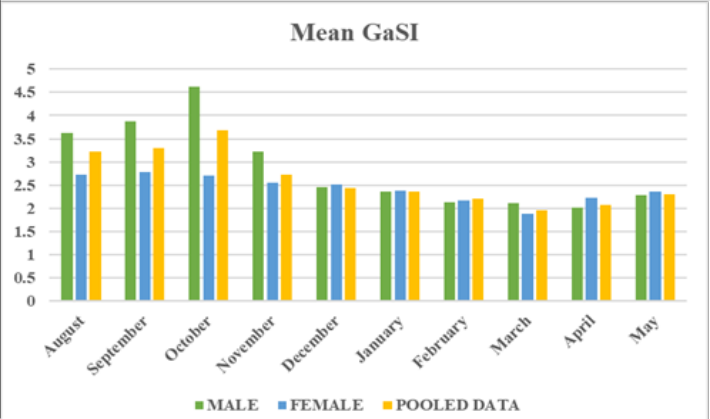 Figure 8
Introduction
The fish and fisheries sector has been of tremendous importance for India's food, nutrition, way of World fisheries and aquaculture production rose to 223.2 million tonnes (MT), with 185. 4 MT of aquatic animals. The total world capture fisheries production is 92.3 MT, with aquatic animals accounting for 91.0 MT, including 79.7 MT from marine waters and 11.3 MT from inland waters (FAO, 2024). The Belonidae family is made up of 10 genera and 34 known species throughout the world. Tylosurus and Ablennes are solely marine, whereas the genus Belone is found in marine as well as brackish habitats (Pauly and Froese, 2024) [11] . The genus Ablennes is represented by the Flat Needle Fish, Ablennes hians (Sabrah et al., 2017) [14] . Because of their excellent flavor, these fishes are highly commercially important in pelagic fisheries. They are predominantly caught on the Indian coast and surrounding islands with gill nets and hookand-line, and sold in fresh, frozen, or smoked conditions (Collette, 2003) [4] . Family Belonidae comprises surface-dwelling fishes with a blue or green back and silvery white belly, giving them camouflage in their surroundings. The fish possess a slender body and may be very long or short, with a maximum length of 2 meters. The Ablennes species have a long, thin, slightly compressed body usually with vertical stripes. The upper and lower jaws are both extended into beak-like teeth, each lined with a series of small, pointed teeth, while the vomer and palate are toothless. A broad dark blue stripe runs along the sides with about 12 to 14 prominent dark vertical bars on the body. They are big, vicious predators that occur mostly in tropical and subtropical seawater. The scales and bones are green in colour (Fischer and Bianchi, 1984) [7] . Its distribution includes the Pacific Ocean, the Atlantic Ocean and the Indian Ocean. These pelagic fish, which inhabit surface waters, are carnivorous, primarily feeding on small pelagic fishes. (Collette, 2003) [4] .
Their distribution is restricted to shallow depths, ranging from 1 to 10 meters. According to Jawad (2017) needlefish can jump 60 km/h when they are not in the water. Understanding food and feeding habits plays a crucial role in identifying a species' habitat, dietary preferences, and its relationships within different trophic levels. Gaining insight into the reproductive biology of fish is equally important for the sustainable management and effective utilization of fish populations (Cochrane, 2002; Temesgen, 2017) [3] . Changes in feeding behaviour can reveal key aspects of ecological interactions between predators and their prey, offering valuable information for the conservation and management of fishery resources.
Materials and Methods
Materials and Methods
Study area and Specimen collection
Specimen of the Flat Needle Fish, Ablennes hians (n=300), were collected monthly over ten months from August 2024 to May 2025. Sampling was conducted at Veraval fishing harbour (20°54'912''N and 70°21'355''E), Gujarat, India. Veraval is one of the major fish landing centers on the Gujarat coast, with high fish landings, harbour size, and number of boats operating, among which trawlers are most frequent.
Biological measurement and laboratory processing
Following collection, each specimen was transported on ice to the laboratory. For every individual, The Total Length (TL)and Total Body Weight (W) was recorded. Specimens were dissected for the removal of gut. The gut was also analyzed to determine the food items, with their number and weight per category.
Feeding biology 2.3.1 Feeding intensity of A. hians
The stomachs were classified as full, 3/4 full, 1/2 full, 1/4 full, trace full, and empty. The intensity of feeding was determined by the degree of stomach distension due to food consumption and the amount of food present (Manojkumar et al., 2015) [10] .
Index of Relative Importance (IRI)
Fish diet research is primarily centered on three aspects: the quantity of prey (n), their weight (w), and the frequency of their appearance (f). The gut of the fish is opened, and different food material is extracted and sorted to the finest taxonomic level. The IRI is an aggregate measure of the number, volume, and occurrence frequency to assist in evaluating the relationship between various food items in the stomach. It is obtained by summing the number percentage and volume percentage values and then multiplying the result by the occurrence frequency percentage. The gut was dissected, and each type of food item present was identified and counted. The numerical percentage (N%) was calculated using the formula: N% = (Total number of a specific food item in a month / Total number of all food items) × 100 F% = (Frequency of a specific food item / Frequency of all food items) × 100 W% = (Weight of a specific food item / Total weight of all food items) × 100
The Relative Importance Index (IRI) of the different foods in the gut was computed following the protocol described by Pinkas et al. (1971).
Where, N = Number, W = Weight, and F = Frequency of occurrence
Gastro-somatic index (GaSI)
Gastro-somatic Index (GaSI) is a useful measure for comparing feeding patterns between different months and evaluating the influence of environmental and physiological factors on feeding behaviour. GaSI was computed through the formula given by Desai (1970) [5] . GaSI = (Total weight of gut) / (Total weight of fish) x 100
Statistical Analysis
The statistical analysis of the research was conducted based on Microsoft Excel 2019 software as guided in the standard literature by Snedecor and Cochran (2014) [3] . [13] studied the feeding intensity of A. hians and reported that 349 specimens had food filled stomachs, while 47 specimens (11.87%) had empty stomachs, indicating seasonal variation in feeding habits. Similarly, Chaari et al. (2016) [1] observed that 55.4% of Tylosurus acus imperialis, specimens had empty stomachs, while 44.6% contained food. They suggested that feeding intensity was influenced by reproductive cycles, with reduced feeding during spawning periods, and noted the species showed opportunistics feeding behaviour. Sever et al. (2009) [16] analysed the feeding intensity of garfish Belone belone and found that 20.85% empty guts and 79.2% contained food guts.
Results and Discussion
Results and Discussion
Feeding Intensity
xThe feeding intensity of A. hians appears to be influenced by both sex and age, with variations in the number and weight of prey consumed, but overall, the species maintains a consistent feeding behaviour across different groups (Roul et al., 2023) [13] . Empty stomach conditions in fish may occur due to regurgitation, feeding schedules, limited food availability, low digestibility, physiological changes, health problems, or weak metabolic activity. Feeding activity often decreases during peak breeding, as the stomach space becomes restricted by the fully developed gonads (Kiran & Puttaiah, 2004).
Analysis of gut content
According to present study, A. hians is a carnivorous fish that predominantly feeds mainly on small fish and crustaceans. Of the stomach contents analysed, fish was the most dominant group. The most commonly identified fish species in the diet included Sardine sp., Stolephorus sp., Bregmaceros mcclellandi and Nemipterus japonicas along with semidigested fish. Species identification was difficult because the fish remains were partially digested, consisting of degraded parts like vertebrae, damaged heads, scales, otoliths, and various other body fragments. Within the crustacean group, Acetes sp. was commonly found while among molluscs group, squid sp were identified in the gut of A. hians. Most of the digested material was fully decomposed, exhibiting black, yellow or white coloration in both crustacean and molluscs group. A related study by Roul et al. (2023) [13] along the southwest coast of India (Kerala), also reported that flat needlefish are carnivorous pelagic predators, which mainly prey on teleost fishes, molluscs, and crustaceans. In the present study, the Index of Relative Importance (IRI) revealed that fish (IRI=63.71%) ranked first among the food item ingested by A. hians, followed by crustaceans (IRI=29.96%) in second place and molluscs (IRI= 6.34%) in third. (Table 5 and Figure 6). Among the fish remains, semi-digested fish constituted the highest percentage (52.58%), with peak occurrences in month of August, January, February and May and less occurrences in November, December and March. Sardine sp. made up 5.64%, with the highest percentage observed in December, October and March. Stolephorus sp. accounted for 2.50% and was available during a majority of the year, such as August, September, October, November, December, January, February, March, April and May. Bregmaceros mcclellandi comprised 2.34% of the diet, with the highest percentage found in September, October and November.
| Food items | % N | % W | % F | IRI | % IRI | Rank |
|---|---|---|---|---|---|---|
| Fishes | 38.07 | 59.63 | 59.14 | 2281.2 | 63.71 | 1 |
| Crustaceans | 44.56 | 31.76 | 28.82 | 1055.9 | 29.96 | 2 |
| Molluscs | 20.01 | 10.48 | 12.04 | 210.68 | 6.34 | 3 |
Table text extracted from the original PDF; superscript letters are shown inline. The original table image is below.
View original table image
Nemipterus japonicus accounted 0.61% found in March, April and May.Among the crustacean, Acetes sp. showed peak abundance in March, September and October, while its lowest numbers were recorded in January, February and May. For molluscs, squid spp. showed the highest abundance in November, with the lower occurrences in February, October and April. Notably, squid was completely absent in month of March. In the present study, semi-digested fish were found in the stomachs of A. hians throughout all months of observation. Similarly, Roul et al. (2023) [13] have also documented the same observations while making an analysis of the composition of food in flat needle fishes along the Kerala coast. According to their research, the Index of Relative Importance (IRI) showed that teleosts were the most frequently encountered food constituents, with 65.43% contribution towards the diet, followed by molluscs and crustaceans with 32.91% and 1.66%, respectively. They also noted the most commonly encountered food items in the diet were teleosts, comprising Decapterus russelli (%IRI = 17.75), Sardinella longiceps (%IRI = 0.51), Bregmaceros mcclellandi (%IRI = 0.14), and Nemipterus japonicus (%IRI = 0.05), followed by crustaceans and molluscs. Similar findings, Chaari et al. (2016) [2] also provided information on the diet of the Tunisian coast Mediterranean needlefish (Tylosurus acus imperialis), where it comprised 62.6% fish. The identified fish families included Mugilidae, Gobiidae, and Belonidae. Crustaceans were 37.3% of the diet, where decapods were found to be the most prevalent, with Sicyonia carinata comprising 5.4% of the overall diet. [13] indicated that the maximum count of prey items in A. hians from the southwest coast of Kerala, India, was recorded during October and November, followed by June to September, and then March to May.
Gastro-Somatic Index (GaSI)
Gastro-Somatic Index (GaSI)
Conclusion
The study provides valuable insights into the feeding ecology of A. hians landed at Veraval Fishing Harbour along the Gujarat coast of north western India. Analysis of stomach contents revealed that A. hians is a carnivorous species, with fishes and crustaceans constituting its principal diet, indicating its role as a mid-to-upper trophic level predator in the coastal marine ecosystem. The population examined was dominated by females throughout the study period, suggesting possible differences in distribution, behavior, or habitat utilization between sexes. Seasonal variation in feeding intensity was evident from the Gastrosomatic Index (GaSI), which reached its maximum value in October (3.677 ± 0.740) and minimum value in March (1.959 ± 0.090), reflecting temporal changes in feeding activity that may be associated with reproductive cycles and prey availability. These findings contribute to the limited biological information available for A. hians in Indian waters.
Acknowledgement
The authors are grateful to College of Fisheries Science, Kamdhenu University, Veraval for their support, encouragement and suggestions during the investigation during this study.
Figures and tables from the paper
| Month | Empty | Trace | ¼ Full | ½ Full | ¾ Full | Full stomach | Gorged |
|---|---|---|---|---|---|---|---|
| Aug | 33.333 | 13.333 | 20.000 | 13.333 | 10.000 | 6.667 | 3.333 |
| Sep | 26.667 | 16.667 | 13.333 | 13.333 | 13.333 | 13.333 | 3.333 |
| Oct | 16.667 | 10.000 | 23.333 | 20.000 | 10.000 | 13.333 | 6.667 |
| Nov | 23.333 | 13.333 | 16.667 | 13.333 | 16.667 | 10.000 | 6.667 |
| Dec | 20.000 | 20.000 | 20.000 | 16.667 | 10.000 | 10.000 | 3.333 |
| Jan | 26.667 | 16.667 | 20.000 | 10.000 | 10.000 | 13.333 | 3.333 |
| Feb | 40.000 | 16.667 | 13.333 | 13.333 | 6.667 | 6.667 | 3.333 |
| Mar | 36.667 | 23.333 | 16.667 | 10.000 | 6.667 | 6.667 | 0.000 |
| Apr | 33.333 | 16.667 | 16.667 | 10.000 | 13.333 | 10.000 | 0.000 |
| May | 36.667 | 10.000 | 16.667 | 13.333 | 13.333 | 10.000 | 0.000 |
Table text extracted from the original PDF; superscript letters are shown inline. The original table image is below.
View original table image
| Food items | Months | — | — | — | — | — | — | — | — | — |
|---|---|---|---|---|---|---|---|---|---|---|
| Aug | Sep | Oct | Nov | Dec | Jan | Feb | Mar | Apr | May | |
| Fishes | ||||||||||
| Sardine sp. | 3.29 | 5.23 | 7.52 | 3.52 | 17.54 | 3.09 | 5.48 | 7.66 | 0.00 | 3.11 |
| Stolephorus sp. | 1.48 | 1.34 | 3.68 | 7.89 | 0.51 | 2.36 | 0.85 | 1.98 | 3.97 | 0.90 |
| Nemipterus sp. | 0.00 | 0.00 | 0.00 | 0.00 | 0.00 | 0.00 | 0.00 | 0.33 | 2.95 | 2.90 |
| Bregmaceros sp. | 2.07 | 3.39 | 7.68 | 3.03 | 2.90 | 2.08 | 0.22 | 0.35 | 1.64 | 0.00 |
| Semidigested fish | 62.34 | 45.14 | 68.18 | 33.41 | 46.03 | 65.38 | 47.56 | 43.66 | 53.87 | 60.25 |
| Crustacean | ||||||||||
| Acetes sp. | 11.80 | 16.66 | 15.79 | 13.04 | 9.94 | 6.66 | 4.99 | 24.37 | 12.08 | 6.09 |
| Semidigested material | 12.24 | 19.00 | 14.49 | 18.85 | 17.19 | 15.61 | 18.80 | 21.35 | 22.51 | 18.03 |
| Molluscs | ||||||||||
| Squid sp. | 4.56 | 4.07 | 0.10 | 11.25 | 4.57 | 4.10 | 1.12 | 0.00 | 2.28 | 6.26 |
| Semidigested material | 2.18 | 5.13 | 3.14 | 8.96 | 1.28 | 0.68 | 0.31 | 0.26 | 0.67 | 2.43 |
Table text extracted from the original PDF; superscript letters are shown inline. The original table image is below.
View original table image
| — | Months | — | — | — | — | — | — | — | — | — |
|---|---|---|---|---|---|---|---|---|---|---|
| Aug | Sep | Oct | Nov | Dec | Jan | Feb | Mar | Apr | May | |
| Food items | Fishes | |||||||||
| % N | 30.1 | 35.42 | 47.3 | 31.3 | 53.7 | 37.5 | 41.8 | 35.2 | 34.7 | 33.7 |
| % W | 58.2 | 54.9 | 57.5 | 52.5 | 61.5 | 66.3 | 68.4 | 64.6 | 53.8 | 58.6 |
| % F | 62.6 | 51.3 | 61.7 | 52.7 | 60 | 61.4 | 62.9 | 57.6 | 62 | 59.2 |
| IRI | 2473 | 1716 | 2041 | 1351.3 | 2186.4 | 2723 | 3514 | 2136 | 2237 | 2432 |
| % IRI | 69.2 | 55.1 | 66.5 | 47.8 | 66.9 | 73 | 74.8 | 54.1 | 62.5 | 67.2 |
| Food items | Crustaceans | |||||||||
| % N | 42.1 | 45.8 | 46.3 | 43.7 | 42.1 | 38.8 | 43.7 | 64.9 | 43 | 35.2 |
| % W | 30.9 | 33.4 | 36.8 | 31.8 | 29.2 | 25.7 | 27.8 | 34.4 | 37.8 | 29.8 |
| % F | 25 | 29.7 | 25.5 | 26.3 | 27.5 | 29.2 | 29.6 | 38.5 | 31 | 25.9 |
| IRI | 859 | 1110 | 930.6 | 900.2 | 885.7 | 832.1 | 1118 | 1808 | 1239 | 873.9 |
| % IRI | 24 | 35.6 | 30.3 | 31.9 | 27 | 22.3 | 23.8 | 45.8 | 34.6 | 24 |
| Food items | Molluscs | |||||||||
| % N | 27.7 | 18.7 | 16.3 | 25 | 19 | 23.8 | 14.5 | 1.8 | 22.2 | 31.0 |
| % W | 10.9 | 11.6 | 5.7 | 34.5 | 9.3 | 7.9 | 3.8 | 1.0 | 8.5 | 11.6 |
| % F | 12.6 | 18.9 | 12.8 | 21 | 12.5 | 9.7 | 7.4 | 3.8 | 6.8 | 14.8 |
| IRI | 241 | 286 | 139.1 | 570.5 | 191 | 179 | 67.8 | 10.6 | 105 | 314.9 |
| % IRI | 6.7 | 9.21 | 3.25 | 20.2 | 5.8 | 4.8 | 1. | 0.27 | 2.95 | 8.7 |
Table text extracted from the original PDF; superscript letters are shown inline. The original table image is below.
View original table image
| Food items | % N | % W | % F | IRI | % IRI | Rank |
|---|---|---|---|---|---|---|
| Fishes | ||||||
| Sardine spp. | 6.41 | 13.52 | 8.27 | 197.35 | 5.63 | 5 |
| Stolepherus spp | 4.97 | 4.18 | 8.24 | 82.99 | 2.6 | 6 |
| Nemipterus spp | 1.02 | 1.3 | 2.52 | 22.4 | 0.62 | 9 |
| Bregmaceros spp. | 4.84 | 3.76 | 6.97 | 75.76 | 2.32 | 8 |
| Semidigested fishes | 20.07 | 36.83 | 33.11 | 1902.6 | 52.59 | 1 |
| Crustaceans | ||||||
| Acetes spp. | 33.1 | 11.32 | 9.1 | 421.96 | 12.14 | 3 |
| Semidigested crustaceans | 11.45 | 20.42 | 19.64 | 633.87 | 17.81 | 2 |
| Molluscs | ||||||
| Squid spp. | 16.02 | 5.65 | 5.29 | 126.99 | 9.17 | 4 |
| Semidigested molluscs | 3.87 | 5.94 | 6.52 | 78.59 | 2.5 | 7 |
Table text extracted from the original PDF; superscript letters are shown inline. The original table image is below.
View original table image
| Month | Mean GaSI | — | — |
|---|---|---|---|
| Male | Female | Pooled data | |
| August | 3.626 ± 0.970 | 2.734 ± 0.151 | 3.229 ± 0.431 |
| September | 3.879 ± 0.815 | 2.778 ± 0.238 | 3.291 ± 0.413 |
| October | 4.616 ± 2.051 | 2.708 ± 0.199 | 3.677 ± 0.740 |
| November | 3.224 ± 0.464 | 2.550 ± 0.159 | 2.719 ± 0.196 |
| December | 2.462 ± 0.254 | 2.509 ± 0.209 | 2.430 ± 0.178 |
| January | 2.359 ± 0.191 | 2.376 ± 0.132 | 2.359 ± 0.113 |
| February | 2.124 ± 0.131 | 2.173 ± 0.167 | 2.203 ± 0.127 |
| March | 2.118 ± 0.122 | 1.88 ± 0.098 | 1.959 ± 0.090 |
| April | 2.012 ± 0.105 | 2.225 ± 0.170 | 2.083 ± 0.110 |
| May | 2.291 ± 0.143 | 2.365 ± 0.107 | 2.309 ± 0.095 |
Table text extracted from the original PDF; superscript letters are shown inline. The original table image is below.
View original table image
References
17 in the original paper- Chaari M, Boudaya L, Neifar L. Preliminary observations on the feeding habits of the Mediterranean needlefish Tylosurus acus imperialis (Teleostei: Belonidae). J Coast Life Med. 2016;4(6):426-429.
- Chaari M, Boudaya L, GanCitano S, GanCitano V, Fiorentino F, Neifar L. First information on biology of the needlefish Tylosurus acus imperialis (Belonidae) off the Mediterranean. Cybium. 2014;38(4):273-278.
- Cochrane KL. A fishery manager's guidebook: Management measures and their application. FAO Fisheries Technical Paper. 2002;424:1-236.
- Collette BB, Carpenter KE. Order Beloniformes, Belonidae. In: The living marine resources of the Western Central Atlantic. Vol. 5. Rome: FAO; 2003. p. 1104-1115.
- Desai VR. Studies on the fishery and biology of Tor tor (Hamilton) from river Narmada. Journal of the Inland Fisheries Society of India. 1970;2(5):101-112.
- FAO. The State of World Fisheries and Aquaculture 2024: Blue Transformation in Action. Rome: FAO; 2024.
- Fischer W. FAO species identification sheets for fishery purposes. Western Indian Ocean (Fishing Area 51). Rome: FAO; 1984. Vol. I-IV.
- Jawad LA, Jig L. Comparative osteology of the axial skeleton of the genus Pampus (Family: Stromateidae, Perciformes). Journal of the Marine Biological Association of the United Kingdom. 2017. doi:10.1017/S0025315416000369.
- Kaya Ş, Saglam H. Feeding habits of garfish, Belone belone euxini Günther, 1866 in autumn and winter in Turkey's south-east coast of the Black Sea. Animal Biodiversity and Conservation. 2017;40(1):99-102.
- Manojkumar PP, Pavithran PP, Ramachandran NP. Food and feeding habits of Nemipterus japonicus (Bloch) from Malabar Coast, Kerala. Indian Journal of Fisheries. 2015;62(1):64-69.
- Pauly D. Some simple methods for the assessment of tropical fish stocks. FAO Fisheries Technical Paper. 1983;234:1-52.
- Pinkas L, Oliphant MS, Iverson ILK. Food habits of albacore, bluefin tuna and bonito in Californian waters. Fishery Bulletin. 1971;152:1-105.
- Roul SK, Ganga U, Abdussamad EM, Jaiswar AK, Rohit P. Diet composition and feeding habits of flat needlefish Ablennes hians (Valenciennes, 1846) (Beloniformes: Belonidae) in the Southeastern Arabian Sea. Indian Journal of Geo-Marine Sciences. 2023;52(1):24-35.
- Sabrah MM, Amin AM, Attia AO. Family Belonidae from the Suez Canal, Egypt: Age, growth, mortality, exploitation rate and reproductive biology. The Egyptian Journal of Aquatic Research. 2017;44(1):2935.
- Schneider S, Roessli D, Excoffier L. Arlequin: A software for population genetics data analysis. Coalescent Simulation Lab, Crawford. 2000;2:24962497.
- Sever TM, Bayhan B, Bilge G, Taşkavak E. Diet composition of Belone belone (Linnaeus, 1761) (Pisces: Belonidae) in the Aegean Sea. Journal of Applied Ichthyology. 2009;25(6):702-706.
- Thomas T, Abdussamad EM, Amrutlal TM, Tomy E, Mohammed AA. Distribution and diversity of needlefishes (Belonidae) and halfbeaks (Hemiramphidae) of the order Beloniformes in India. Journal of the Marine Biological Association of India. 2024;66(2):41-52.