
Research article · 2026 · Full text
International Journal of Biology SciencesForaging behavior of Indian honeybee Apis cerana indica Fabricius under Semi urban area in Goa, India
Volume 8(6) · Pages 46–56 · DOI: 10.33545/26649926.2026.v8.i6a.860 ↗
Research areasPlant and animal studiesInsect and Arachnid Ecology and BehaviorInsect and Pesticide Research
Abstract
Author-writtenUnderstanding how short-term weather variability modulates honeybee foraging is essential for sustaining pollination services in tropical agroecosystems. We quantified the temporal dynamics and climatic drivers of pollen and nectar foraging by Apis cerana indica in a semi-urban coastal landscape of Goa, India, during the honey-flow season (January–May 2024). Foraging intensity was recorded at hive entrances from three colonies as returning bees with pollen loads (pollen foragers) and without pollen loads (nectar foragers), counted for 5 min at 2-h intervals (08:00–18:00 h) at eight-day intervals. Daily gridded meteorological variables (temperature, relative humidity, rainfall, wind speed, and solar radiation; 0.25° × 0.25°) were obtained from the India Meteorological Department and standardized prior to analysis. Both pollen and nectar exhibited strong diurnal structuring, with consistent maxima at 10:00 h across months; peaks were highest in March (pollen: 76.49; nectar: 80.91 bees 5 min⁻¹). Time-of-day effects were highly significant for both resources (Kruskal–Wallis: pollen χ² = 70.42, p < 0.001; nectar χ² = 68.05, p < 0.001), whereas month-wise effects were non-significant, indicating substantial intra-month variability and/or floral buffering. Spearman correlations suggested negative associations of foraging with temperature and wind speed. Generalized Additive Models (mgcv) captured nonlinear multivariate climatic controls with moderate explanatory power (pollen: 38.3% deviance explained; nectar: 49.7%). Wind speed exerted strong negative effects on both pollen and nectar, while solar radiation showed strong positive nonlinear effects; rainfall was not influential during the study window. Collectively, the results identify mid-morning as the most productive foraging window and demonstrate that wind and radiation are dominant climatic regulators of A. cerana indica foraging in coastal semi-urban environments, with implications for pollinator-friendly management and climate-resilient pollination services.
Summary
Source-checkedPlain-language reading of the full paper, prepared with AI and checked against the text. Each point links to the authors' own words.
Why it matters
- Insect pollination is critical for global food security, supporting the reproduction of about 75% of the world's primary food crops. View evidence ↗
- The native honeybee Apis cerana indica is essential in tropical agroecosystems because it is well-adapted to local climates and pollinates various field and plantation crops. View evidence ↗
- Environmental factors, specifically wind speed and temperature, are known to be primary regulators of honeybee foraging activity. View evidence ↗
The question
- The study aimed to investigate how time and climate drive the pollen and nectar foraging behavior of Apis cerana indica in a semi-urban coastal area of Goa, India. View evidence ↗
What they did
- The research used three healthy Apis cerana indica colonies of uniform strength, each containing about seven brood frames. View evidence ↗
- High-resolution (0.25° × 0.25°) daily weather data, including solar radiation, wind speed, rainfall, humidity, and temperature, were obtained from the India Meteorological Department. View evidence ↗
- Generalized Additive Models (GAMs) were used to analyze the nonlinear and multivariate effects of climate on foraging behavior. View evidence ↗
What they found
- Pollen foraging peaked consistently at 10:00 h across all months, with the highest intensity recorded in March at 76.49 bees per 5 minutes. View evidence ↗
- Time of day had a highly significant effect on both pollen and nectar foraging, whereas the month of the year did not show a statistically significant effect. View evidence ↗
- Wind speed had a strong negative effect on both pollen and nectar collection, acting as a significant physical constraint on flight. View evidence ↗
- Solar radiation showed a strong, highly nonlinear positive association with both pollen and nectar foraging. View evidence ↗
- The GAMs explained 38.3% of the deviance for pollen foraging and 49.7% for nectar foraging, indicating that nectar collection is more strongly regulated by weather. View evidence ↗
- Relative humidity positively influenced pollen collection in a curvilinear manner but did not significantly affect nectar foraging. View evidence ↗
- Rainfall had no significant effect on either pollen or nectar foraging during the study period. View evidence ↗
What it means
- The authors concluded that wind speed and solar radiation are the primary climatic drivers of foraging, with temperature and humidity playing secondary roles. View evidence ↗
- The study concludes that short-term diurnal rhythms and microclimatic constraints are more influential than broad seasonal changes during the honey-flow period. View evidence ↗
Visual summary
3 visualsIllustrations explain the paper; charts are replotted from the paper's own table values.
Climatic Drivers of Foraging
AI-generated conceptual illustration (Indian honeybee Apis cerana indica). It explains the idea and does not show study data.
View source evidence ↗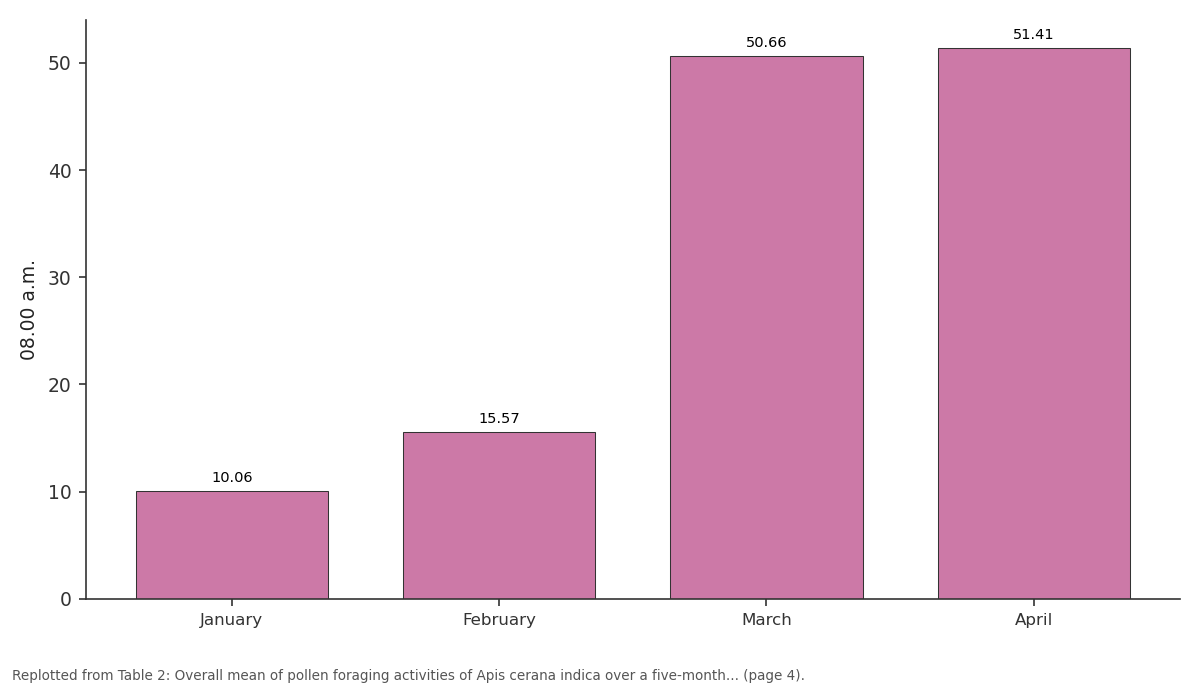
08.00 a.m.: January vs February vs March vs April
Replotted from Table 2 (page 4) of the original paper. Every bar is the paper's own table value.
View source evidence ↗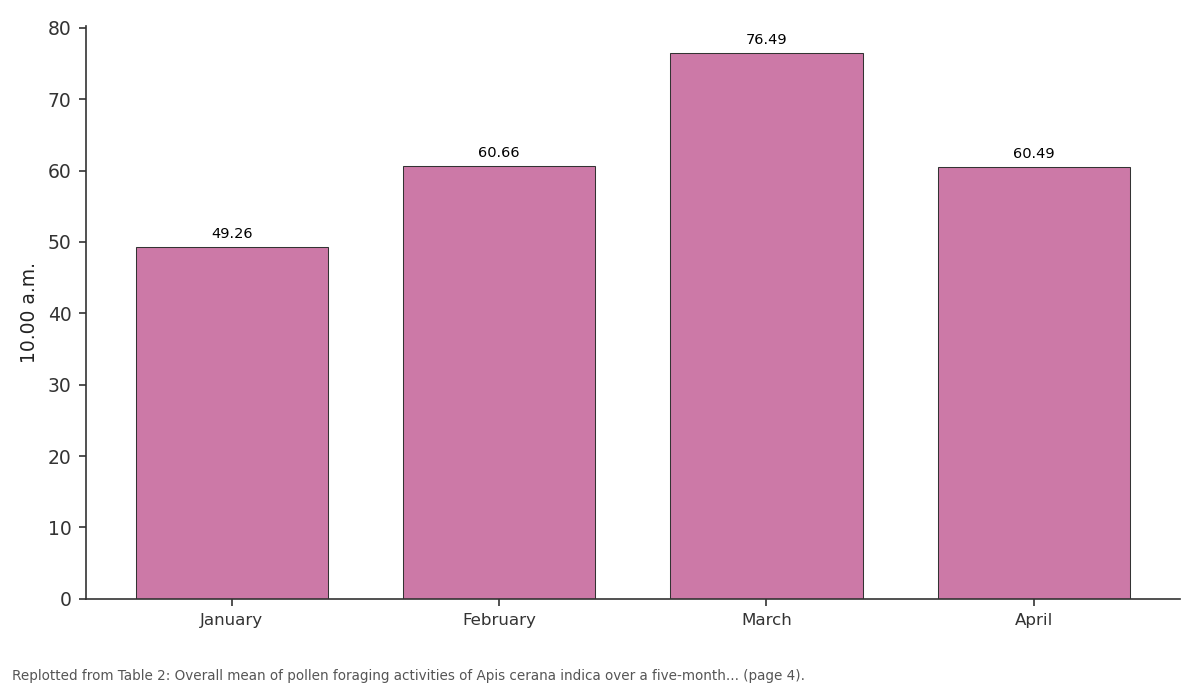
10.00 a.m.: January vs February vs March vs April
Replotted from Table 2 (page 4) of the original paper. Every bar is the paper's own table value.
View source evidence ↗Figures & tables
From the original paper Table 1
 Table 2
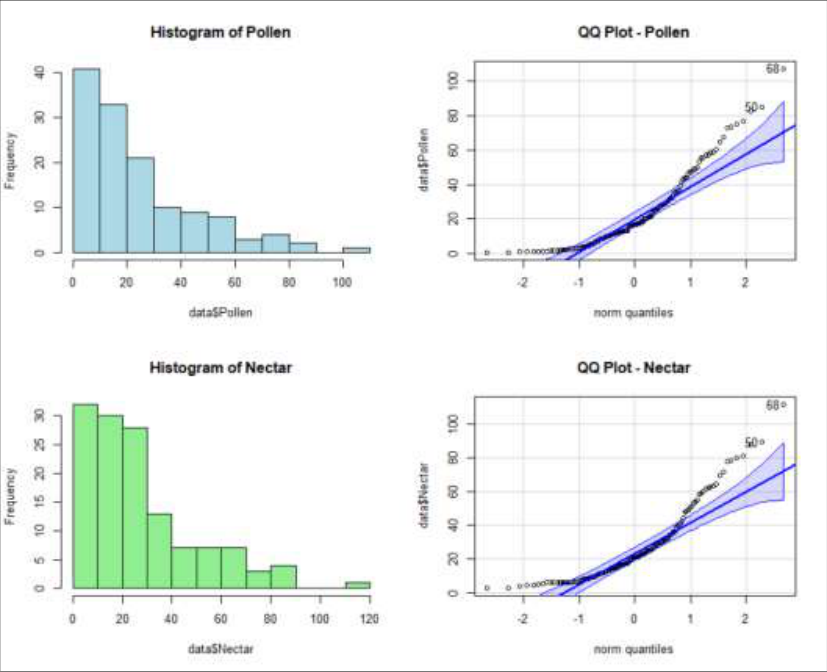 Figure 1
 Table 3
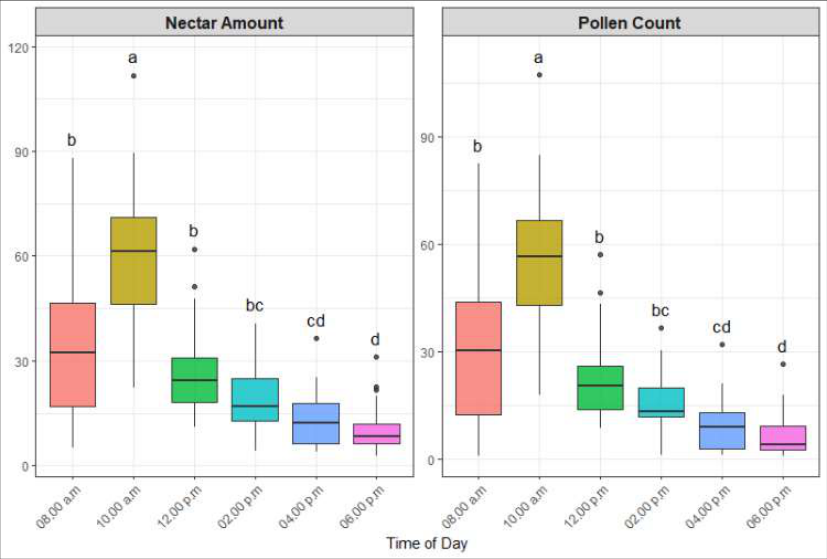 Figure 2
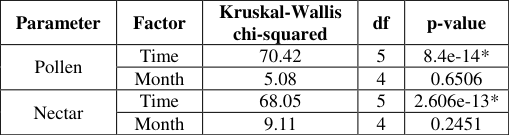 Table 4
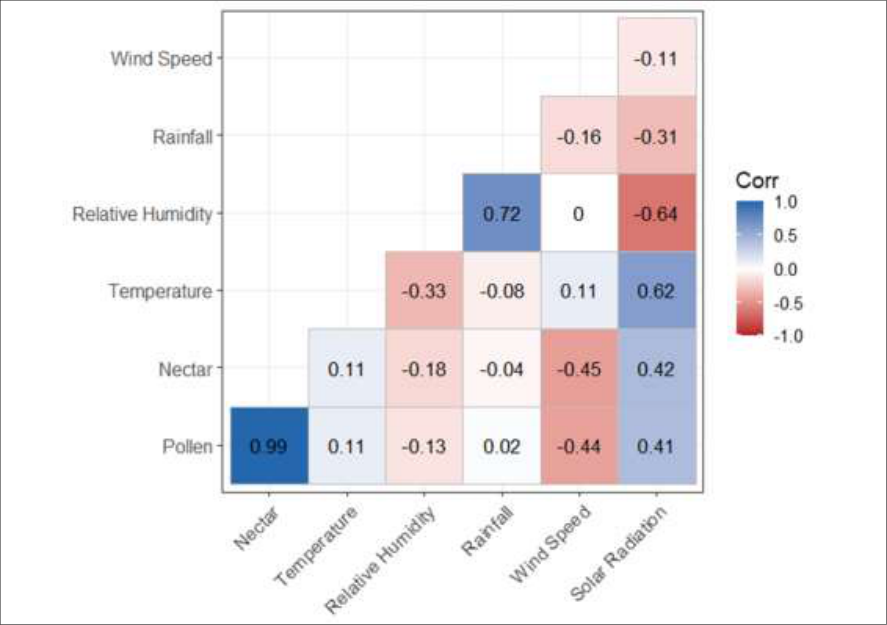 Figure 3
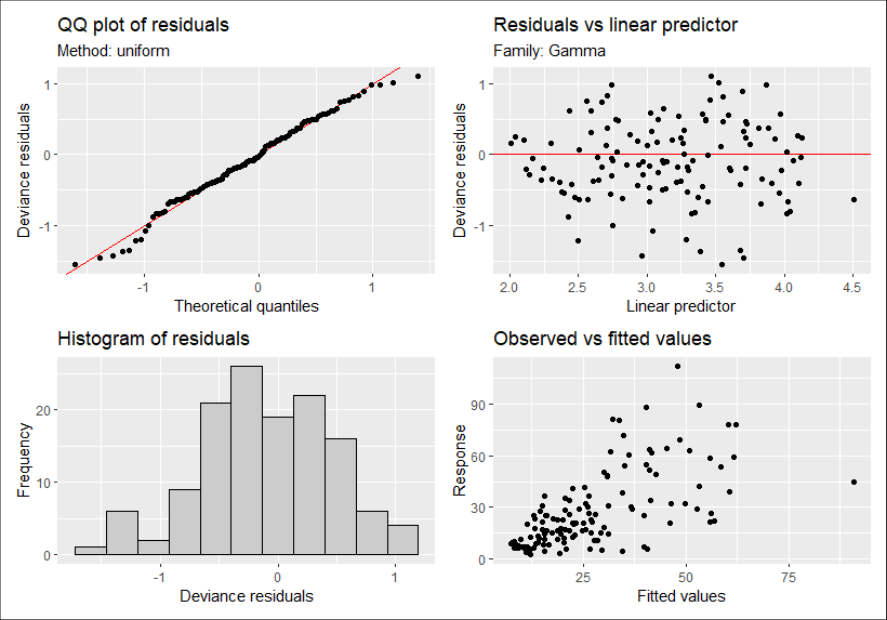 Figure 4
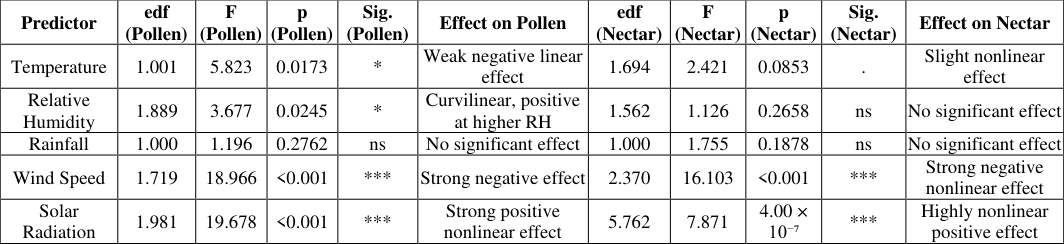 Table 5
 Table 6
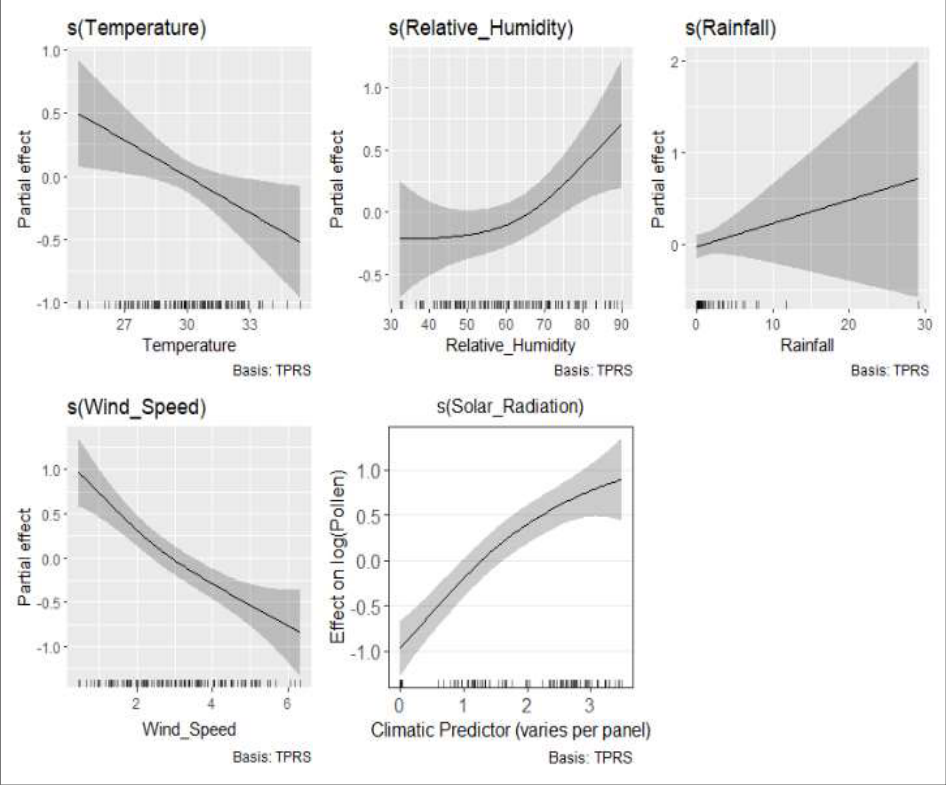 Figure 5
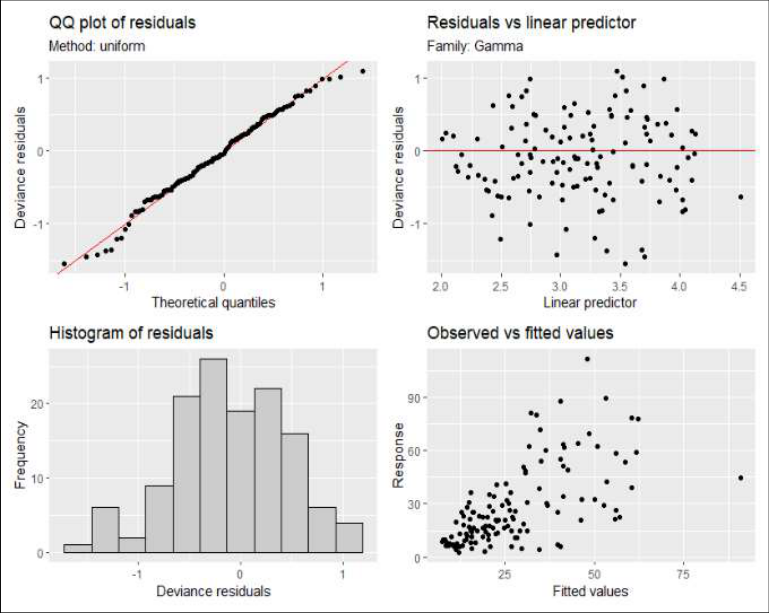 Figure 6
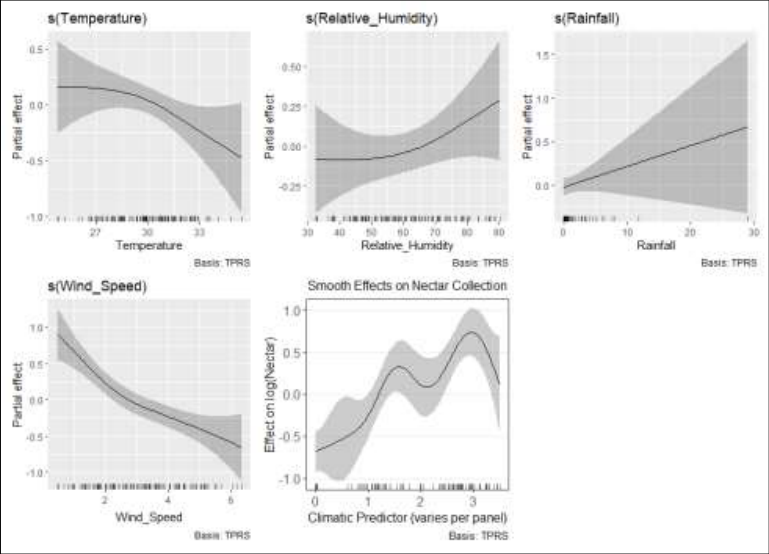 Figure 7
Introduction
Pollination by insects is a cornerstone of both natural ecosystem functioning and global agricultural productivity, underpining the reproduction of approximately 75% of leading food crops worldwide. Among insect pollinators, honeybees play a disproportionately important role due to their social organisation, high foraging efficiency, and ability to exploit a wide range of floral resources across spatial and temporal scales (Abrol, 2012; Klein et al., 2007) [5,24] . In tropical and subtropical agroecosystems, native honeybee species such as Apis cerana indica Fabricius are particularly vital, as they are well adapted to local climatic conditions and contribute substantially to the pollination of horticultural, plantation, and field crops (Chauhan et al., 2024; Indhu et al., 2023; Nuriyah et al., 2021) [8,21,28] . Foraging behaviour in honeybees represents a finely tuned balance between energetic gain and environmental constraints. The intensity and timing of pollen and nectar collection are shaped by multiple interacting factors, including floral phenology, colony nutritional demands, and short-term abiotic conditions such as temperature, humidity, wind speed, and solar radiation (Kamaraj and Rasappan, 2024) [22] . Among these, climatic variables exert immediate physiological and behavioural control over flight performance, sensory orientation, and resource handling efficiency, thereby regulating daily and seasonal foraging rhythms (Stabentheiner and Kovac, 2014) [33] . Consequently, understanding how weather variability influences honeybee foraging is essential for predicting pollination services under changing environmental conditions (Mattos et al., 2018) [26] . Previous studies have documented pronounced diurnal patterns in honeybee foraging activity, typically characterised by early to mid-morning peaks followed by afternoon declines, a trend attributed to synchronisation with anthesis, pollen dehiscence, and nectar secretion cycles of flowering plants (Gigauri, 2019) [15] . Seasonal variation in foraging intensity has likewise been linked to flowering phenology and resource abundance, particularly during honey-flow periods when floral rewards are abundant (Abdel-Galel et al., 2021; Abrol, 2012) [1,5] . However, the magnitude and consistency of these temporal patterns often vary with local climatic regimes and landscape composition, especially in semiurban environments where natural and cultivated flora coexist (Kamaraj and Rasappan, 2024) [22] . Climatic drivers such as temperature and wind speed have been repeatedly identified as key regulators of honeybee activity. Elevated temperatures can impose thermal stress, increase metabolic costs of flight, and alter nectar availability through enhanced evaporation, collectively suppressing foraging intensity beyond optimal thermal thresholds (Hennessy et al., 2020) [18] . Wind speed represents a critical physical constraint on bee flight, as increased turbulence impairs take-off, stability, and landing efficiency, thereby reducing visitation rates and successful foraging trips even at relatively low velocities (Balfour and Ratnieks, 2025; Hennessy et al., 2020) [18,19] . Relative humidity may further influence pollen hydration and handling efficiency, while solar radiation affects visual orientation and thoracic warming, indirectly shaping diurnal activity patterns (Abou-Shaara et al., 2017; Karbassioon et al., 2023) [3,23] . Despite substantial research on honeybee foraging ecology, several important gaps remain. First, much of the existing literature relies on linear or univariate statistical approaches, which may inadequately capture the nonlinear and interacting effects of climatic variables on foraging behaviour. Second, studies focusing on Apis cerana indica in coastal and semi-urban tropical ecosystems remain limited, even though such landscapes are increasingly dominant across South Asia and are expected to experience heightened climatic variability under climate change. Third, few studies integrate fine-scale behavioural observations with high-resolution gridded meteorological data to disentangle short-term weather effects from broader seasonal trends. In this context, the present study aims to investigate the temporal dynamics and climatic drivers of pollen and nectar foraging behaviour of Apis cerana indica in a semi-urban coastal ecosystem of Goa, India. Specifically, we (i) quantify diurnal and seasonal variation in pollen and nectar foraging intensity during the honey-flow season, (ii) examine pairwise associations between foraging activity and key climatic variables using non-parametric correlation analyses, and (iii) employ Generalized Additive Models (GAMs) to identify nonlinear and multivariate climatic controls on foraging behaviour. By integrating behavioural ecology with advanced statistical modelling and highresolution climate data, this study provides mechanistic insights into how short-term weather variability structures honeybee foraging activity, with implications for pollination services and climate resilience in tropical agroecosystems.
Materials and Methods: Study Area and Environmental Conditions
The study was conducted at the Experimental Farm of the Department of Entomology, Goa College of Agriculture, Ela Farm, Old Goa, India (15°29′36.7″ N; 73°55′03.8″ E), during the honey flow season from January to May 2024. The site represents a semi-urban coastal ecosystem characterised by mixed horticultural and field-crop vegetation, and patches of natural forest that collectively provide diverse pollen and nectar sources for Apis cerana indica. The apiary was located within a coconut (Cocos nucifera L.) plantation, interspersed with mango (Mangifera indica), banana (Musa spp.), arecanut (Areca catechu), maize (Zea mays), and assorted wild flora. These were monitored qualitatively to confirm continuous floral availability across months. Goa's coastal region is marked by warm, humid tropical conditions, with daytime temperatures typically ranging from 25-34°C during the study period. To characterise environmental drivers of bee foraging, daily gridded weather data (temperature, relative humidity, rainfall, wind speed, and solar radiation) were sourced from the India Meteorological Department (IMD) high-resolution gridded dataset (0.25° × 0.25°). These data correspond to the grid cell encompassing the study location. To align climatic variables with honeybee foraging observations, daily IMD gridded weather data corresponding to each observation date were extracted using the IMDlib Python package, which enables automated retrieval and parsing of high-resolution meteorological fields. For modelling purposes, the daily temperature, relative humidity, rainfall, wind speed, and solar radiation values were subsequently averaged or temporally interpolated to represent the environmental conditions prevailing within the foraging observation window (08:00-18:00 h). Prior to correlation analyses and the development of Generalized Additive Models (GAMs), all climatic variables were standardised (mean-centred and scaled) to ensure comparability of predictors and improve model stability and convergence.
Honeybee Colonies and Foraging Observation Protocol
Three healthy colonies of Apis cerana indica with uniform strength each comprising approximately seven brood frames with adequate sealed brood, pollen reserves, and honey stores-were selected and maintained under standardised conditions at the Experimental Farm. All colonies were placed on elevated metal stands fitted with ant-proof barriers and positioned under partial shade to avoid thermal stress. Foraging behaviour was quantified by recording the number of bees returning to the hive with pollen loads (pollen foragers) and without pollen loads (nectar foragers), identified visually by the presence or absence of corbicular pollen on the hind legs. Observations were conducted directly at the hive entrance at two-hour intervals (08:00, 10:00, 12:00, 14:00, 16:00, and 18:00 h) using a hand tally counter while timing each count over a fixed five-minute window with a stopwatch. Data were collected at eight-day intervals from January to May 2024, encompassing the entire honey-flow season in Goa. For each time point within each month, weekly measurements were averaged prior to statistical analysis to reduce intra-week variability and ensure consistency across colonies. This generated a structured dataset reflecting mean pollen and nectar foraging intensity across time-of-day and seasonal gradients.
Floral Resource Assessment
To characterise the availability of pollen and nectar sources influencing Apis cerana indica foraging dynamics, a qualitative floral resource survey was conducted within a 500-m radius of the apiary throughout the study period. All flowering plant species visibly visited by the bees were recorded during each observation day, with emphasis on dominant horticultural crops such as coconut (Cocos nucifera), mango (Mangifera indica), banana (Musa spp.), arecanut (Areca catechu), and maize (Zea mays), as well as naturally occurring forest vegetation. Although detailed phenological quantification was not undertaken, presenceabsence checks and visual assessments of flowering intensity were used to confirm continuous nectar and pollen availability across months. This contextual evaluation ensured that observed variations in foraging activity were interpreted against a stable background of accessible floral resources, thus enabling robust ecological inference regarding temporal shifts in pollen and nectar collection.
Data Processing and Statistical Analysis
Foraging observations from the three colonies were first organised by time of day, week, and month, after which all weekly values for each time point were averaged to obtain a representative measure of mean pollen and nectar forager return rates. Prior to inferential analysis, datasets were examined for distributional properties using the Shapiro-Wilk test to assess normality (Table ; Figure 1); because both pollen and nectar counts exhibited significant departures from normal distributions, non-parametric statistical methods were employed (Razali and Wah, 2011) [31] . Temporal variation in foraging activity across the six daily observation periods was evaluated using the Kruskal-Wallis rank-sum test, while month-wise effects were assessed independently for pollen and nectar datasets (Table 4) (Okoye and Hosseini, 2024) [24] . To examine pairwise monotonic relationships between foraging intensity and individual climatic variables, Spearman rank correlation coefficients were computed. To capture potentially complex, nonlinear, and multivariate environmental drivers of foraging behaviour, Generalized Additive Models (GAMs) were constructed using the mgcv package in R (Wood, 2001), with separate models fitted for pollen and nectar counts. Each GAM incorporated smooth terms for temperature, relative humidity, wind speed, rainfall, and solar radiation, following the model structure: [5,10,26] . The sharp decline in pollen foraging during afternoon hours, with minimum activity observed around 16:00 h, reflects increasing thermal stress, reduced pollen availability following morning anthesis, and higher energetic costs of foraging later in the day, a pattern consistently documented in tropical and subtropical agroecosystems. Seasonally, mean pollen foraging activity (averaged across all observation times) was highest in March, followed by April, with a progressive decline toward May. This trend corresponds closely with the peak flowering and pollen availability of major regional forage species such as mango (Mangifera indica), coconut (Cocos nucifera), and cashew (Anacardium occidentale), which dominate the floral landscape of semi-urban Goa during late winter and early summer (Layek et al., 2020) [25] . The subsequent reduction in May likely reflects declining floral rewards under premonsoon conditions and increasing thermal constraints on sustained pollen collection. Despite these biologically meaningful seasonal patterns, the month-wise Kruskal-Wallis test did not detect a statistically significant effect, indicating that high intra-month variability, driven by weekto-week fluctuations in weather and floral resource distribution, may have reduced statistical power to separate month-level contrasts. Similar discrepancies between descriptive seasonal trends and formal statistical significance have been reported in pollinator foraging studies, particularly where continuous or overlapping floral resources buffer colonies against abrupt seasonal transitions (Herrera, 1997) [20] . In contrast, time of day exerted a strong and highly significant effect on pollen foraging activity (χ² = 70.42, p < 0.001), underscoring the dominance of diurnal forcing over seasonal controls during the honey-flow period. 3; Figure 2), indicating strong temporal coupling between bee activity and periods of optimal nectar availability. Such mid-morning peaks are widely reported in Apis species and are generally attributed to the synchronization of foraging schedules with daily nectar secretion cycles, which are typically highest during early to mid-morning when floral nectaries are most active and nectar sugar concentration is optimal (Anandhabhairavi et al., 2020; Kamaraj and Rasappan, 2024) [6,22] . The consistently higher nectar foraging intensity observed in March, followed by April, further underscores this period as the most resource-rich phase of the honey-flow season in Goa, coinciding with peak flowering of dominant forage plants such as coconut (Cocos nucifera), mango (Mangifera indica), and cashew (Anacardium occidentale) (Young et al., 2021) [38] Table 2 Moderate temperatures, higher relative humidity, and lower evaporative demand during morning hours enhance nectar volume retention and reduce flight costs, thereby increasing net energetic gains per foraging trip (Heinrich, 1979; Abou-Shaara, 2014) [17,2] . In contrast, nectar foraging declined sharply toward the afternoon, with the lowest activity consistently recorded at 16:00 h across all months. This decline is ecologically consistent with rising ambient temperatures, declining nectar secretion rates, increased evaporation leading to altered nectar concentration, and reduced flight efficiency under hotter and drier conditions. Experimental studies have demonstrated that under such thermal stress, honeybees reduce foraging intensity to avoid overheating and excessive energy expenditure, even when floral resources remain available (Stabentheiner and Kovac, 2014) [33] . Seasonally averaged nectar foraging activity followed a trajectory similar to pollen collection, with the highest mean values recorded in March and April and a progressive decline toward May (Supplementary Tables S2). This seasonal pattern reflects the tight coupling between flowering phenology and pollinator activity in tropical agroecosystems, where nectar availability is governed by both plant reproductive schedules and prevailing climatic conditions (Stabentheiner and Kovac, 2016) [34] . Nevertheless, despite these biologically coherent trends, the month-wise Kruskal-Wallis test did not detect statistically significant differences in nectar foraging. This apparent mismatch between descriptive patterns and statistical outcomes likely arises from high intra-month variability, driven by short-term fluctuations in weather, spatial heterogeneity in floral resources, and behavioural plasticity of foragers that allows colonies to maintain relatively stable nectar intake across months (Vijayan et al., 2018) [35] . In landscapes with continuous or overlapping floral resources, such buffering effects are known to dampen seasonal contrasts in foraging metrics, thereby reducing the statistical power of rank-based tests to detect month-level differences (Guezen and Forrest, 2021) [16] .
| Parameter | Factor | Kruskal-Wallis chi-squared | df | p-value |
|---|---|---|---|---|
| Pollen | Time | 70.42 | 5 | 8.4e-14* |
| Month | 5.08 | 4 | 0.6506 | |
| Nectar | Time | 68.05 | 5 | 2.606e-13* |
| Month | 9.11 | 4 | 0.2451 |
Table text extracted from the original PDF; superscript letters are shown inline. The original table image is below.
View original table image
| Time | January | February | March | April | May | Mean |
|---|---|---|---|---|---|---|
| 08.00 a.m. | 10.06 | 15.57 | 50.66 | 51.41 | 34.26 | 32.39 |
| 10.00 a.m. | 49.26 | 60.66 | 76.49 | 60.49 | 38.86 | 57.15 |
| 12.00 p.m. | 32.26 | 26.74 | 19.24 | 16.99 | 17.19 | 22.48 |
| 02.00 p.m. | 27.99 | 08.58 | 15.33 | 14.16 | 09.13 | 15.03 |
| 04.00 p.m. | 16.19 | 06.41 | 10.66 | 09.74 | 05.53 | 09.70 |
| 06.00 p.m. | 13.99 | 03.24 | 05.91 | 05.16 | 04.39 | 06.53 |
| Mean | 24.95 | 20.20 | 29.71 | 26.32 | 18.22 |
Table text extracted from the original PDF; superscript letters are shown inline. The original table image is below.
View original table image
Fig 3: Spearman rank correlation of pollen and nectar with other climatic variables
In contrast to the muted seasonal signal, time of day exerted a strong and highly significant influence on nectar foraging activity (χ² = 68.05, p < 0.001), confirming that diurnal environmental forcing is the primary determinant of nectar collection behaviour during the honey-flow period.
Collectively, these findings demonstrate that nectar foraging by A. cerana indica is governed predominantly by shortterm physiological optimisation in response to microclimatic and floral cues, rather than by broad seasonal shifts alone. Such fine-scale temporal optimisation enables honeybees to maximise energetic efficiency under variable tropical conditions and highlights the sensitivity of pollination services to changes in daily thermal and hydric regimes.
Climatic Drivers of Foraging Activity: Correlation Analysis
To evaluate the influence of individual climatic variables on honeybee foraging intensity, Spearman rank correlation analyses were performed using the standardized meteorological dataset (Figure 3). The analysis indicated that temperature and wind speed were the most influential abiotic factors associated with both pollen and nectar collection. Temperature exhibited a weak but consistently negative correlation with forager return rates, suggesting that higher daytime temperatures-particularly under premonsoon conditions-may constrain bee activity by elevating thermal stress, increasing metabolic costs of flight, and altering nectar properties such as viscosity and evaporation rates. Higher temperature typically reduces viscosity but it also increases evaporation and may reduce nectar volume (Eswarappa et al., 2025; Mattos et al., 2018) [13,26] . Similar temperature-dependent reductions in foraging intensity have been reported for Apis cerana and other honeybee species under tropical and subtropical conditions, where optimal activity is confined to a relatively narrow thermal window (Kamaraj and Rasappan, 2024) [22] In contrast, wind speed showed a moderate to strong negative association with both pollen and nectar foraging, highlighting its role as a key physical constraint on flight performance (Figure 3). Even modest increases in wind velocity can impair take-off, reduce flight stability, and increase energetic expenditure, thereby lowering the efficiency and success rate of foraging trips. The strength of this correlation underscores the sensitivity of honeybee foraging to wind conditions, particularly in open or semiurban landscapes where shelter is limited (Balfour and Ratnieks, 2025; Hennessy et al., 2021) [7,19] . Relative humidity displayed a positive monotonic association with pollen collection, consistent with evidence that higher humidity enhances pollen hydration, reduces desiccation, and facilitates pollen release and handling by foragers. However, its relationship with nectar foraging was weak and non-significant, suggesting that nectar intake is regulated more strongly by flower-specific traits such as nectar volume, sugar concentration, and secretion dynamics than by ambient humidity alone. Rainfall and solar radiation exhibited minimal direct pairwise correlations with foraging intensity, likely reflecting the episodic nature of rainfall and the fact that the effects of radiation on bee activity are often indirect and context-dependent, mediated through temperature, nectar secretion, and visual orientation rather than acting as independent linear drivers (Clarke and Robert, 2018) [9] .
Multivariate and Nonlinear Climatic Effects on Foraging
Generalized Additive Models (GAMs) demonstrated that short-term climatic variability exerted a substantial and nonlinear influence on both pollen and nectar foraging activity of Apis cerana indica. The fitted models showed moderate explanatory power, with the pollen GAM accounting for 38.3% of the deviance (adjusted R² = 0.227) and the nectar GAM explaining a higher 49.7% of the deviance (adjusted R² = 0.352), based on n = 132 observations, indicating that nectar foraging was more strongly regulated by prevailing weather conditions than pollen collection (Table 5). The lower generalised crossvalidation (GCV) score and scale estimate for the nectar model further suggest improved predictive stability for nectar returns. Diagnostic plots of the pollen GAM revealed no major departures from model assumptions, with residuals exhibiting homoscedasticity and near-normal distribution, supporting the robustness of model inference (Figure 4). Among the climatic predictors, wind speed and solar radiation emerged as the most influential drivers of foraging behaviour, whereas rainfall exerted no detectable effect during the study period. Wind speed showed a strong negative effect on both pollen and nectar collection, with a pronounced nonlinear response for nectar (edf = 2.37, p < 0.001) and a steep negative smooth for pollen (edf = 1.719, p < 0.001) (Table 4; Figures 567). The smooth functions indicate a threshold-type response whereby even moderate increases in wind speed rapidly suppressed foraging activity, reflecting the aerodynamic constraints of honeybee flight and the increased energetic cost and instability associated with windy conditions. Such wind-induced compression of effective foraging windows has been widely documented and represents a critical abiotic constraint on pollinator efficiency, particularly in open and coastal landscapes (Clarke and Robert, 2018; Farooqi et al., 2021) [9,14] . 4; Figures 56). The smooth response curves revealed a rapid increase in foraging intensity under low-tomoderate irradiance, followed by a tendency toward saturation at higher radiation levels, suggesting the existence of an optimal light regime beyond which additional irradiance yields diminishing behavioural gains. This pattern likely reflects improvements in visual orientation, floral detectability, and thoracic warming under favourable radiation conditions, coupled with behavioural regulation to avoid overheating at extreme irradiance. The dominance of solar radiation effects in both models underscores the central role of light environment in structuring diurnal foraging rhythms of honeybees (Abrol, 2006; Schmickl and Crailsheim, 2004) [4,3 2] . Secondary climatic drivers exhibited resource-specific effects. Temperature showed a weak but significant negative linear effect on pollen foraging (edf ≈ 1.0, p = 0.0173), whereas its influence on nectar collection was marginal and slightly nonlinear (p = 0.0853) (Table 4). This asymmetry suggests that pollen foraging is more sensitive to thermal stress, potentially due to temperature-dependent constraints on flight performance, pollen handling efficiency, and the timing of anther dehiscence, while nectar foraging remains comparatively resilient through behavioural reallocation among diverse floral sources. Relative humidity exerted a significant curvilinear positive effect on pollen collection (edf = 1.889, p = 0.0245) but had no significant influence on nectar returns (p = 0.2658) (Table 4; Figure 7). The pollen smooth indicates enhanced activity under moderately high humidity, likely associated with improved pollen hydration and reduced desiccation, followed by stabilisation at higher humidity levels. In contrast, nectar extraction appears less directly constrained by ambient humidity in heterogeneous floral environments. Rainfall showed no significant effect on either foraging stream, most plausibly because rainfall events were infrequent or temporally decoupled from observation periods, limiting their effective influence within the analysed dataset ( This study elucidates the temporal structure and climatic regulation of pollen and nectar foraging behaviour of Apis cerana indica in a semi-urban coastal ecosystem of Goa, India. Foraging activity was governed primarily by strong diurnal rhythms, with consistently higher pollen and nectar returns during early to mid-morning hours and a pronounced decline toward the afternoon. These patterns were stable across months, indicating that short-term physiological and microclimatic constraints exerted stronger control over foraging behaviour than broader seasonal variation during the honey-flow period. Although peak foraging intensity occurred during March and April, corresponding to maximum floral availability, month-wise differences were not statistically significant, reflecting high intra-month variability and buffering effects of continuous floral resources. Correlation and nonlinear modelling approaches collectively demonstrated that wind speed and solar radiation were the dominant climatic drivers of foraging activity, while temperature and relative humidity exerted secondary, resource-specific influences. The Generalized Additive Models further revealed nonlinear threshold responses, highlighting narrow optimal environmental windows for efficient foraging.
| Predictor | edf (Pollen) | F (Pollen) | p (Pollen) | Sig. (Pollen) | Effect on Pollen | edf (Nectar) | F (Nectar) | p (Nectar) | Sig. (Nectar) | Effect on Nectar |
|---|---|---|---|---|---|---|---|---|---|---|
| Temperature | 1.001 | 5.823 | 0.0173 | * | Weak negative linear effect | 1.694 | 2.421 | 0.0853 | . | Slight nonlinear effect |
| Relative Humidity | 1.889 | 3.677 | 0.0245 | * | Curvilinear, positive at higher RH | 1.562 | 1.126 | 0.2658 | ns | No significant effect |
| Rainfall | 1.000 | 1.196 | 0.2762 | ns | No significant effect | 1.000 | 1.755 | 0.1878 | ns | No significant effect |
| Wind Speed | 1.719 | 18.966 | <0.001 | *** | Strong negative effect | 2.370 | 16.103 | <0.001 | *** | Strong negative nonlinear effect |
| Solar Radiation | 1.981 | 19.678 | <0.001 | *** | Strong positive nonlinear effect | 5.762 | 7.871 | 4.00 × 10⁻⁷ | *** | Highly nonlinear positive effect |
Table text extracted from the original PDF; superscript letters are shown inline. The original table image is below.
View original table image
Acknowledgement
AcknowledgementsAuthors thank Dr. Suresh Kunkalikar, the Principal of Goa College of Agriculture for providing the facilities to conduct field experiment. Financial SupportThe study has not received financial support.
Figures and tables from the paper
| Parameter | W Value | P-value |
|---|---|---|
| Pollen | 0.87 | 1.469e-09 |
| Nectar | 0.86 | 8.095e-10 |
Table text extracted from the original PDF; superscript letters are shown inline. The original table image is below.
View original table image
| Time | January | February | March | April | May | Mean |
|---|---|---|---|---|---|---|
| 08.00 a.m. | 14.46 | 19.91 | 55.58 | 56.24 | 30.46 | 35.33 |
| 10.00 a.m. | 53.92 | 65.16 | 80.91 | 65.16 | 38.19 | 60.66 |
| 12.00 p.m. | 36.66 | 31.41 | 23.66 | 21.66 | 20.33 | 26.74 |
| 02.00 p.m. | 32.46 | 12.99 | 19.99 | 18.83 | 10.39 | 18.93 |
| 04.00 p.m. | 20.73 | 10.91 | 15.08 | 14.41 | 06.93 | 13.61 |
| 06.00 p.m. | 18.53 | 07.83 | 10.58 | 09.74 | 06.06 | 10.54 |
| Mean | 29.46 | 24.70 | 34.30 | 31.00 | 18.72 |
Table text extracted from the original PDF; superscript letters are shown inline. The original table image is below.
View original table image
| Model | Adjusted R² | Deviance Explained | GCV | Scale Estimate | n |
|---|---|---|---|---|---|
| Pollen GAM | 0.227 | 38.30% | 0.7643 | 0.53225 | 132 |
| Nectar GAM | 0.352 | 49.70% | 0.4002 | 0.31207 | 132 |
Table text extracted from the original PDF; superscript letters are shown inline. The original table image is below.
View original table image
References
37 in the original paper- Abdel-Galel R, Elbanna S, Semida F. Foraging rhythm of honeybees Apis mellifera in Ismailia, Egypt. Catrina. 2021;23(1):27-33.
- Abou-Shaara HF. The foraging behaviour of honey bees, Apis mellifera: a review. Vet Med. 2014;59(1):110.
- Abou-Shaara HF, Owayss AA, Ibrahim YY, Basuny NK. A review of impacts of temperature and relative humidity on various activities of honey bees. Insect Soc. 2017;64(4):455-463.
- Abrol DP. Diversity of pollinating insects visiting litchi flowers (Litchi chinensis Sonn.) and path analysis of environmental factors influencing foraging behaviour of four honeybee species. J Apic Res. 2006;45(4):180-187.
- Abrol DP. Pollination Biology. Dordrecht: Springer Netherlands; 2012.
- Anandhabhairavi N, Ambethgar V, Philip Sridhar R. Foraging behavior of Apis cerana indica Fab. (Apidae: Hymenoptera) on cucumber. J Entomol Zool Stud. 2020;8(6):189-192.
- Balfour NJ, Ratnieks FL. Wind alters plant-pollinator community structure, bee foraging rate and movements between plants. Behav Ecol. 2025;36(4).
- Chauhan DS, Negi GCS, Joshi R. Effect of honey bee (Apis cerana) dominated insect pollination on yield and quality of mustard, buckwheat and plum in a central Himalayan agro-ecosystem. Int J Ecol Environ Sci. 2024;50(4):543-556.
- Clarke D, Robert D. Predictive modelling of honey bee foraging activity using local weather conditions. Apidologie. 2018;49(3):386-396.
- Czekońska K, Łopuch S, Miścicki S. The effect of meteorological and environmental variables on food collection by honey bees (Apis mellifera). Ecol Indic. 2023;156:111140.
- De Figueiredo-Mecca G, Bego LR, do Nascimento FS. Foraging behavior of Scaptotrigona depilis (Hymenoptera, Apidae, Meliponini) and its relationship with temporal and abiotic factors. Sociobiology. 2013;60(3):267-282.
- Descamps C, Quinet M, Jacquemart AL. Climate change-induced stress reduce quantity and alter composition of nectar and pollen from a bee-pollinated species (Borago officinalis, Boraginaceae). Front Plant Sci. 2021;12:755843.
- Eswarappa G, Gagan B, Anitha S, Somashekar RK, Jagadish KS. Influence of weather parameters on pollen and nectar foraging activity of Apis and non-Apis species of honey bees in wild and cultivated varieties of jamun (Syzygium cumini L. Skeels). J Adv Biol Biotechnol. 2025;28(2):395-410.
- Farooqi MA, Aslam MN, Sajjad A, Akram W, Maqsood A. Impact of abiotic factors on the foraging behavior of two honeybee species on canola in Bahawalpur, Punjab, Pakistan. Asian J Agric Biol. 2021;9(1):1-9.
- Guezen JM, Forrest JRK. Seasonality of floral resources in relation to bee activity in agroecosystems. Ecol Evol. 2021;11(7):3130-3147.
- Heinrich B. Bumblebee Economics. Cambridge (MA): Harvard University Press; 1979. p. 109-122.
- Hennessy G, Harris C, Eaton C, Wright P, Jackson E, Goulson D, Ratnieks FF. Gone with the wind: Effects International Journal of Biology Sciences https://www.biologyjournal.net of wind on honey bee visit rate and foraging behaviour. Anim Behav. 2020;161:23-31.
- Hennessy G, Harris C, Pirot L, Lefter A, Goulson D, Ratnieks FL. Wind slows play: Increasing wind speed reduces flower visiting rate in honey bees. Anim Behav. 2021;178:87-93.
- Herrera CM. Thermal biology and foraging responses of insect pollinators to the forest floor irradiance mosaic. Oikos. 1997;80:601-611.
- Indhu A, Lazar J, Prasad S, Anupama K. Pollinators in tropical ecosystems of Southern India with emphasis on the native pollinators Apis cerana indica and Tetragonula iridipennis. Indian J Entomol. 2023;85(4):1187-1199.
- Kamaraj N, Rasappan K. Temporal and spatial foraging activity of Indian honey bee (Apis cerana indica F.) at different migratory sites. Sociobiology. 2024;71(1).
- Karbassioon A, Yearlsey J, Dirilgen T, Hodge S, Stout JC, Stanley DA. Responses in honeybee and bumblebee activity to changes in weather conditions. Oecologia. 2023;201(3):689-701.
- Klein AM, Vaissière BE, Cane JH, Steffan-Dewenter I, Cunningham SA, Kremen C, Tscharntke T. Importance of pollinators in changing landscapes for world crops. Proc R Soc B Biol Sci. 2007;274(1608):303-313.
- Layek U, Manna SS, Karmakar P. Pollen foraging behaviour of honey bee (Apis mellifera L.) in southern West Bengal, India. Palynology. 2020;44(1):114-126.
- Mattos I, de Souza J, Soares AEE. Analysis of the effects of climate variables on Apis mellifera pollen foraging performance. Arq Bras Med Vet Zootec. 2018;70(4):1301-1308.
- Nandi S, Patel P, Swain S. IMDLIB: An open-source library for retrieval, processing and spatiotemporal exploratory assessments of gridded meteorological observation datasets over India. Environ Model Softw. 2024;171:105869.
- Nuriyah S, Yusuf AA, Hermawan W, Husodo T. Ecosystem services from honey bees Apis cerana Fabr. in Taman Hutan Raya (Tahura) Ir. H. Djuanda Dago: ecological and economic perspectives. E3S Web Conf. 2021;249:03016.
- Okoye K, Hosseini S. Mann-Whitney U test and Kruskal-Wallis H test statistics in R. In: R Programming. Singapore: Springer Nature; 2024. p. 225-246.
- Pierrot LM, Schlindwein C. Variation in daily flight activity and foraging patterns in colonies of uruçuMelipona scutellaris Latreille (Apidae, Meliponini). Rev Bras Zool. 2003;20:565-571.
- Razali NM, Wah YB. Power comparisons of ShapiroWilk, Kolmogorov-Smirnov, Lilliefors and AndersonDarling tests. J Stat Model Anal. 2011;2(1):21-33.
- Schmickl T, Crailsheim K. Costs of environmental fluctuations and benefits of dynamic decentralized foraging decisions in honey bees. Adapt Behav. 2004;12(3-4):263-277.
- Stabentheiner A, Kovac H. Energetic optimisation of foraging honeybees: Flexible change of strategies in response to environmental challenges. PLoS One. 2014;9(8).
- Stabentheiner A, Kovac H. Honeybee economics: Optimisation of foraging in a variable world. Sci Rep. 2016;6(1):28339.
- Vijayan M, Saravanan PA, Srinivasan MR. Effect of season and timings on the foraging behaviour of stingless bee, Tetragonula iridipennis Smith (Hymenoptera: Apidae). Madras Agric J. 2018;105(79):286-290.
- Wood SN. mgcv: GAMs and generalized ridge regression for R. R News. 2001;1(2):20-25.
- Younas M, Israr M, Ali Y. Comparative study of foraging behavior of Apis mellifera L. at two different agro-climatic conditions in different seasons. Pure Appl Biol. 2021;11(2):548-552.
- Young AM, Kohl PL, Rutschmann B, Steffan-Dewenter I, Brockmann A, Dyer FC. Temporal and spatial foraging patterns of three Asian honey bee species in Bangalore, India. Apidologie. 2021;52(2):503-523.