
Research article · 2026 · Full text
International Journal of Geography Geology and EnvironmentTransformation of irrigation pattern in southwestern Haryana: A geographical analysis
Volume 8(6) · Pages 30–36 · DOI: 10.22271/27067483.2026.v8.i6a.782 ↗
Research areasAgricultural Economics and PracticesIrrigation Practices and Water ManagementEngineering and Agricultural Innovations
Abstract
Author-writtenIrrigation has been the foremost factor in agricultural development. In a semi-arid area such as Southwestern Haryana, a reliable irrigation transforms the agriculture by calming output and decreasing rain dependency. Irrigation transformation greatly enhanced agricultural output and cropping intensity. Haryana constitutes about 1.4% of India’s total geographical area yet contributes more than 5% of its agricultural production, which has grown five times since the formation of Haryana in 1966. About 83% of the area in the state is agricultural, and of that, 80% is cultivated. Its irrigation intensity has seen changes over the years, especially after the Green Revolution, due to the presence of canals and tubewells including other sources. This increasing irrigation intensity is due to certain factors, which need to be highlighted. Therefore, the main objective of the present study is to explore the spatial patterns of irrigation intensity in southwestern Haryana between the time periods of 1987-90 and 2017- 2020. It also aims to highlight the factors responsible for the change in irrigation intensity.
Summary
Source-checkedPlain-language reading of the full paper, prepared with AI and checked against the text. Each point links to the authors' own words.
Why it matters
- In the semi-arid region of Southwestern Haryana, reliable irrigation is critical for stabilizing agricultural output and reducing the dependence on rainfall. View evidence ↗
- Haryana is highly productive relative to its size, contributing over 5% of India's agricultural production despite occupying only about 1.4% of the country's land area. View evidence ↗
- The success of the Green Revolution was closely tied to the availability of irrigation infrastructure. View evidence ↗
The question
- The study aims to analyze the spatial patterns of irrigation intensity in southwestern Haryana between 1987-90 and 2017-2020 and identify the factors driving these changes. View evidence ↗
What they did
- The research focused on the southwestern region of Haryana, specifically the districts of Bhiwani, Rohtak, Jhajjar, Gurugram, Rewari, Mahendragarh, and Mewat. View evidence ↗
- The study utilized secondary data sourced from the Statistical Abstract of Haryana, the Directorate of Agriculture, and District Census Handbooks. View evidence ↗
What they found
- Canal irrigation's share of the net irrigated area in southwestern Haryana remained relatively stagnant, moving from 19.20% in 1987-90 to 19.41% in 2017-20. View evidence ↗
- Tubewell irrigation expanded significantly in the region, increasing from 8.5% of the net sown area in 1967-70 to 22.5% by 1987-90. View evidence ↗
What it means
- The authors conclude that while tubewells have driven agricultural growth, the heavy reliance on groundwater threatens long-term sustainability and water tables. View evidence ↗
- The authors state that the future viability of the region's agriculture depends on the implementation of sustainable irrigation practices and effective groundwater management. View evidence ↗
Visual summary
3 visualsIllustrations explain the paper; charts are replotted from the paper's own table values.
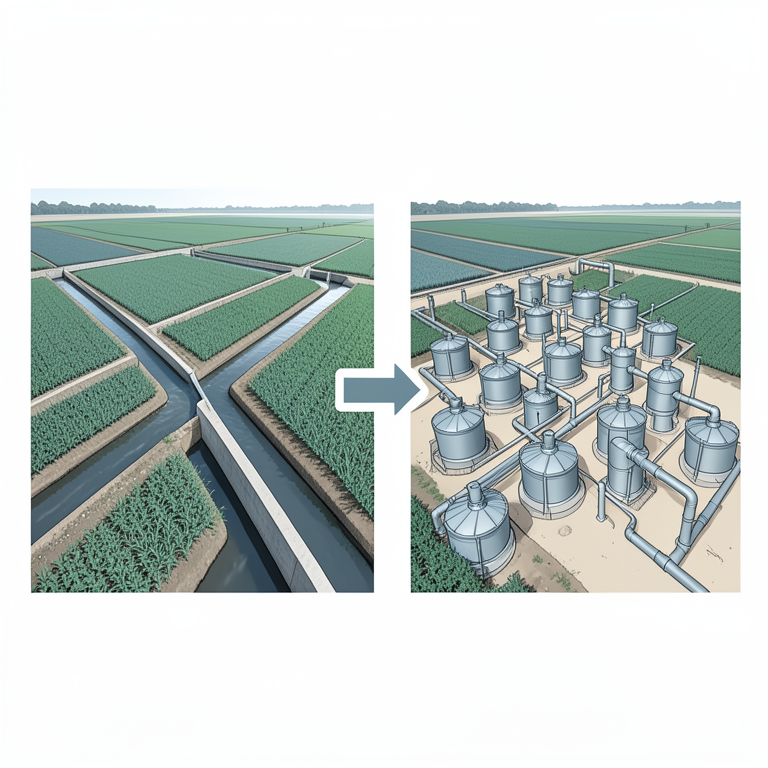
Shift in Irrigation Sources
AI-generated conceptual illustration (Agricultural fields in southwestern Haryana). It explains the idea and does not show study data.
View source evidence ↗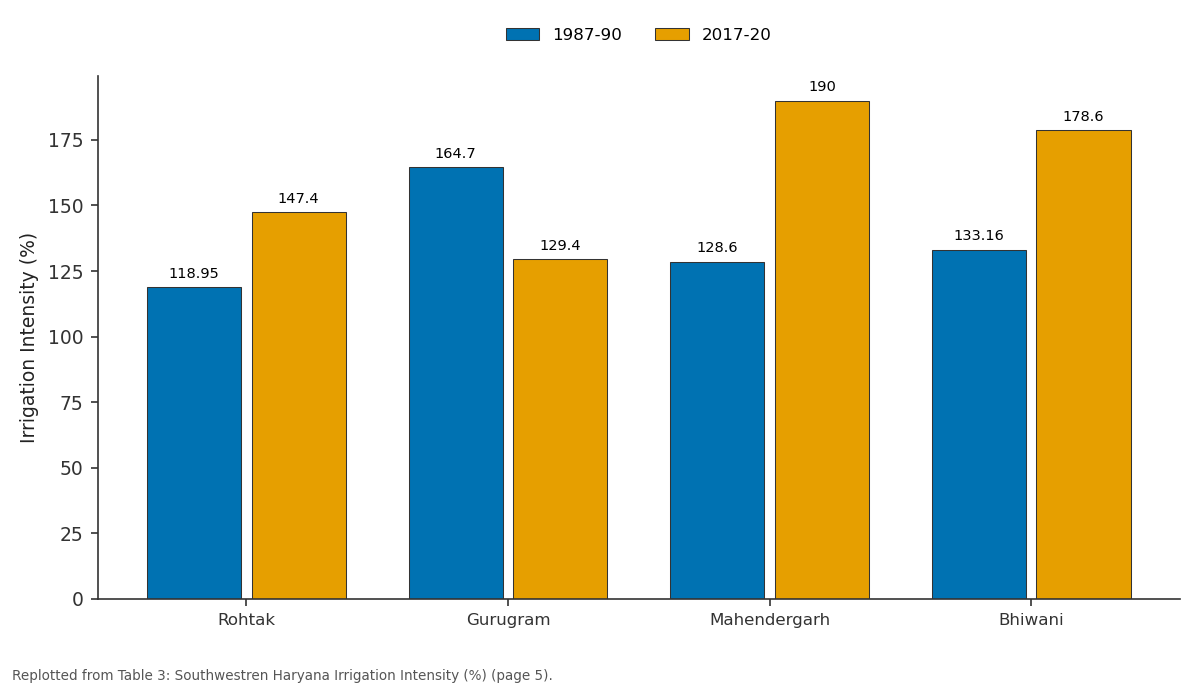
1987-90 and 2017-20: Rohtak vs Gurugram vs Mahendergarh vs Bhiwani
Replotted from Table 3 (page 5) of the original paper. Every bar is the paper's own table value.
View source evidence ↗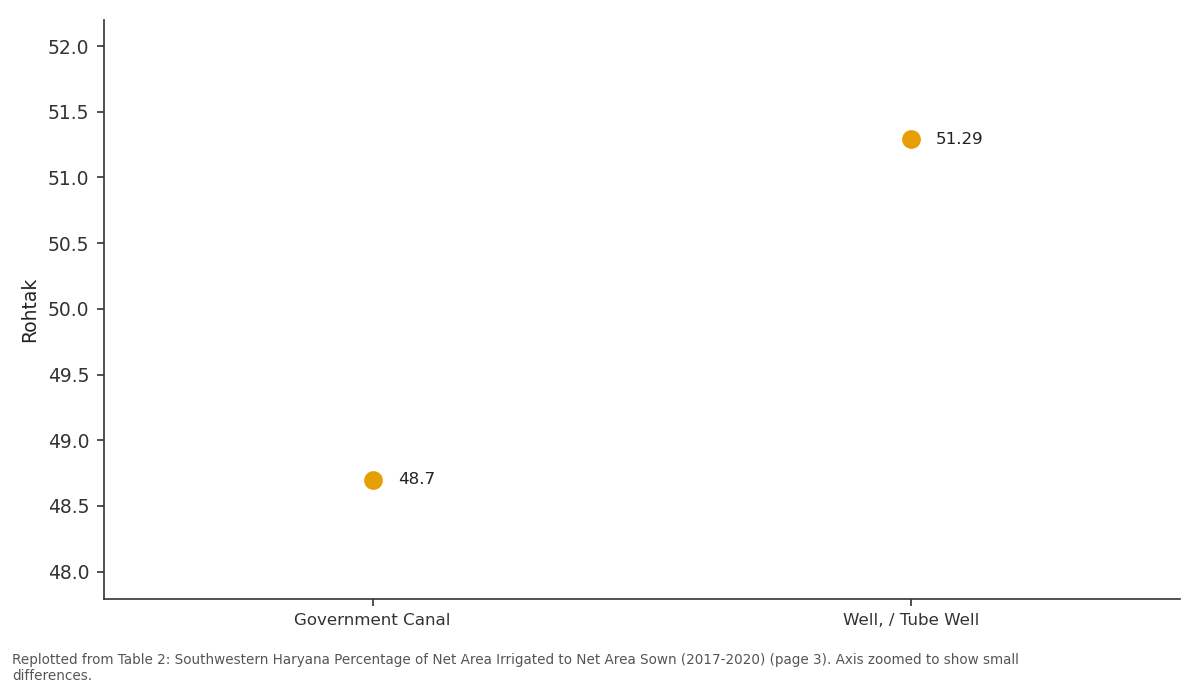
Rohtak: Government Canal vs Well, / Tube Well
Replotted from Table 2 (page 3) of the original paper. Every bar is the paper's own table value.
View source evidence ↗Figures & tables
From the original paper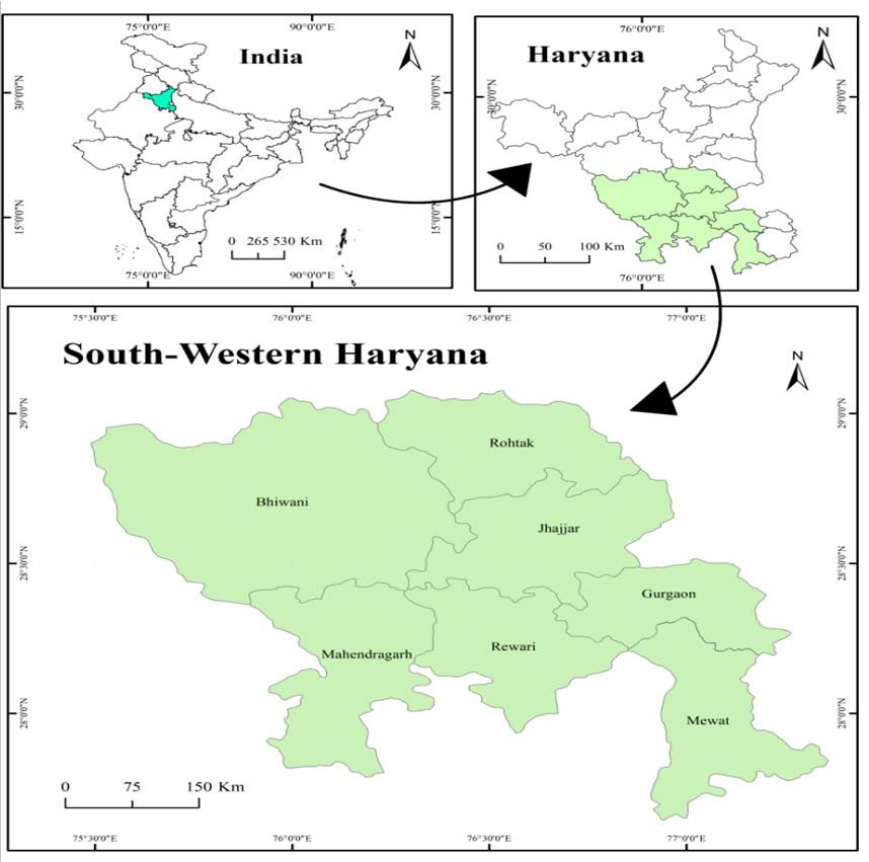 Figure 1
 Table 1
 Table 2
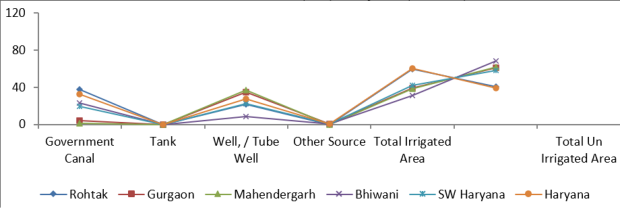 Figure 2
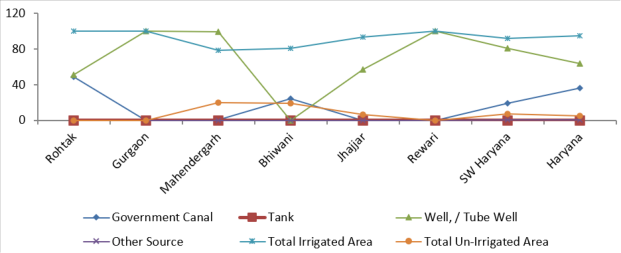 Figure 3
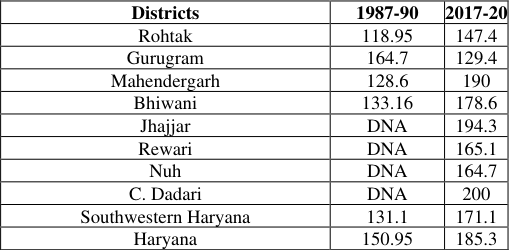 Table 3
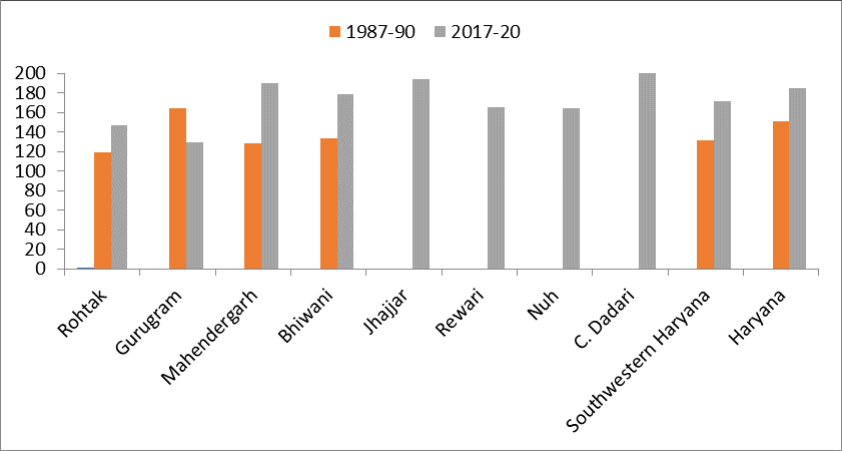 Figure 4
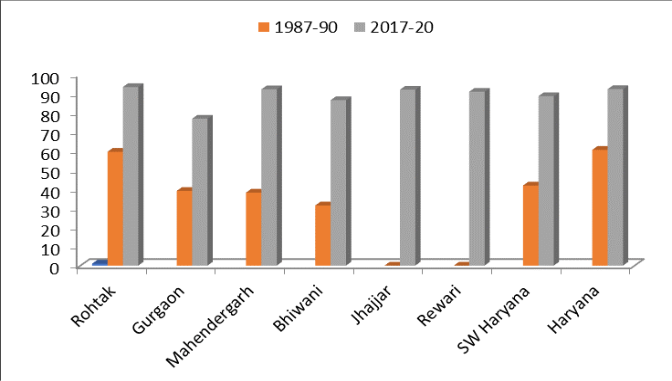 Figure 5
Introduction
Agriculture is the predominant sector in the economy of the under-developed and developing countries of the world. In India agriculture is still premier industry which has engaged 46.5 percent (Economic Survey 2020-21) of its working population. At the same time, it is contributing 20.3 percent of national income of our country. The pace of economic development of the country has been and still continues to be significantly influenced by the pace of its agricultural development. The development of agriculture in the study area is closely related to the development of irrigation resource. The importance of water can be gauged from the fact that Green Revolution took off in those areas where irrigation had been provided. In Southwestern Haryana, where water is available for supplemental irrigation, crops are grown almost throughout the year. In most parts of Southwestern Haryana, the available water resources are insufficient to meet the irrigation requirements of the cultivated land. Hence, it is necessary to utilize the available water in the study area in such a way so as to secure the maximum crop production per unit of water. Different sources of irrigation are used by farmers in the study area. A traditional method of irrigation was well where water was drawn with the help of draught animals. With the passage of time, the growing need of water was increasingly felt and canals come into existence. But the non-availability of canal water in desired amount and at desired time led to the installation of electric tube wells under public sector. There are a number of government tubewells, masonry wells, private tube wells and pump sets which together with canals provide protective irrigation. At present Haryana is a leading state in India from the view of irrigation development. The net area irrigated by different sources in the state has increased from 15.32 lakh hac. to 34.60 lakh hac. since 1967-70 to 2017-20. Tubewells and canals are the dominating source of irrigation in the state. However, due to limited availability of canal water especially during dry season, dependency on tubewells irrigation is higher than canal irrigation. The percentage share of net irrigated area by canals and tubewells in Southwestern Haryana based on triennium average (2017-20) is 19.40 percent and 80.57 percent respectively.
Objectives
• To analysis the spatio-temporal dynamics of irrigation development in Southwestern Haryana. • To examine the pattern of irrigation intensity in the study area.
Study Area
The present study is conducted in the south-western region of Haryana, India. Geographically, Haryana is located in the north-western part of the country, and the study area occupies its south-western tract. This region comprises the districts of Bhiwani, Rohtak, Jhajjar, Gurugram (Gurgaon), Rewari, Mahendragarh, and Mewat (Nuh), as depicted in Figure 1. The study area lies approximately between 28°00′N to 29°30′N latitudes and 75°30′E to 77°00′E longitudes. South-western Haryana is characterized by a predominantly semi-arid to sub-humid climate, with hot summers, mild winters, and a monsoon-dependent rainfall regime. The region forms part of the Indo-Gangetic plains, with relatively flat to gently undulating topography, though sandy and alluvial soils are common, particularly toward the western and southern margins. Agriculture is the dominant land use, supported by both canal and groundwater irrigation, while rapid urbanization and industrial growth are notable in districts such as Gurugram and Rohtak. Socioeconomically, the region exhibits a mix of rural agrarian landscapes and rapidly expanding urban centers.
Data Source
The research objectives of the present study are based on secondary data taken from the statistical abstract of Haryana, it also included directorate of Agriculture, Government of Haryana, and District Census Handbooks of the concerned districts. Southwestern districts are taken as a unit of the study. In addition, relevant data and conceptual insights have been supplemented through published research articles, books, government reports, and journals related to agricultural geography and rural development. The collected data were carefully compiled, verified, and used for districtwise and temporal analysis to ensure consistency and reliability of results.
Methodology
To calculate the irrigating intensity, the following statistical techniques have been used:
Gross Irrigated Area Irrigation Intensity = x100 Gross cropped Area After calculating the irrigation intensity value of each district for the years 1987-1990 to 2017-20, tables have been prepared to process the data. Similarly, data has been analysed using Excel sheet and GIS-based maps have been prepared to interpret the data.
Irrigation Pattern in Southwestern Haryana
The increased agricultural production is possible by combination of irrigational facilities and improved agricultural technology. Irrigation has assumed greater importance with the introduction of modern technology in agriculture i.e. high yielding varieties of seeds, chemicals fertilizers, pesticides and mechanization. The irrigation acts as a catalytic agent to boost the productivity of existing inputs and plays a crucial role for the package of improved inputs (Singh, 2004). In the agro-climatic conditions like India, without irrigation high yielding varieties don't give the optimum yield, chemical fertilizers and other inputs cannot be applied successfully. It prepares the farmers for a change over from traditional to modern agriculture. Like other parts of Haryana, irrigation is a crucial factor in agriculture of Southwestern Haryana. In semi-arid regions, the availability of water at right time and in adequate quantity is necessary input for raising agricultural production. The development of agriculture in the study area is closely related to the development of irrigation resource. The importance of water can be gauged from the fact that Green Revolution took off in those areas where irrigation had been provided. In Southwestern Haryana, where water is available for supplemental irrigation, crops are grown almost throughout the year. In most parts of Southwestern Haryana, the available water resources are insufficient to meet the irrigation requirements of the cultivated land. Hence, it is necessary to utilize the available water in the study area in such a way so as to secure the maximum crop production per unit of water. Different sources of irrigation are used by farmers in the study area.
Canals constitute an important means of inter-basin transfer of surface water and play a significant role in agricultural irrigation systems. Canals that supply water throughout the year are classified as perennial canals, whereas those that function only during the rainy season are termed nonperennial canals. The historical development of canal irrigation in the region dates back to the second half of the fourteenth century, when Sultan Feroz Tughlaq (1351-1388) initiated canal construction to promote agricultural development in the old Punjab region. One of his major contributions was the construction of the canal network now known as the Western Yamuna Canal. Despite these early developments, the dry zone adjoining the Thar Desert in southwestern Haryana remained largely outside the coverage of flow irrigation systems prior to Independence. Recognizing the need to address drought vulnerability and enhance agricultural productivity, irrigation development in this region received policy attention during the Fourth Five Year Plan . During this period, several lift-irrigation schemes were implemented to facilitate the supply of water to arid areas where natural gravity flow was not feasible. Major schemes such as the Jui, Siwani, Loharu, and Jawaharlal Nehru Lift Irrigation Schemes were constructed to irrigate droughtprone tracts. Among these, the Jawaharlal Nehru Lift Irrigation Scheme represents the largest lift-irrigation initiative in southwestern Haryana. The regional canal network indicates that irrigation coverage in the area is primarily linked to the Western Yamuna Canal system (Sindhu, 2004). Historically, the canal-commanded area in southwestern Haryana remained limited. During the period 1987-90, canal irrigation accounted for only 19.20 percent of the net irrigated area in the study region, compared to 32.80 percent at the state level (Table 1). This share increased modestly to 19.41 percent in southwestern Haryana and 36.36 percent in Haryana during 2017-20 (Table 2). Although an upward trend is evident, the rate of increase remained comparatively lower in the study region than in the state as a whole. Canal irrigation represents the second most important source of irrigation in the region; however, its contribution varies considerably across districts. Rohtak records the highest share of canal irrigation (48.70 percent), followed by Jhajjar (42.62) and Bhiwani (24.36 percent). In contrast, canal irrigation remains marginal in Mahendragarh (0.83 percent). The uneven distribution of canal irrigation reflects variations in canal network accessibility, physiographic conditions, infrastructural development, and historical investment patterns. These disparities underline the need for targeted irrigation planning and infrastructural strengthening to ensure balanced agricultural development across southwestern Haryana (Table 2). Tubewell irrigation has played a crucial role in promoting intensive cultivation, as it enables farmers to access water in the required quantity at the desired time, subject only to the regular availability of energy. It has proved especially beneficial for sub-marginal, marginal, and small farmers, who depend on timely irrigation for sustaining crop production. With advancements in irrigation technology, more efficient methods of groundwater lifting have been adopted. Mechanical lifting devices have largely replaced the traditional methods of water withdrawal, such as the use of water wheels. Farmers themselves have shown considerable enthusiasm for installing shallow tubewells because of their operational convenience and reliability. A major advantage of tubewell irrigation over canal irrigation lies in the fact that the water source is privately owned and directly controlled by the farmer. This ensures greater security and flexibility in irrigation scheduling. In addition, the shorter water conveyance channels reduce seepage losses, and no elaborate water distribution network is required. As a result, tubewell irrigation has emerged as a dependable and efficient source of irrigation in areas where canal water is either inadequate or unevenly distributed. In Southwestern Haryana, the area irrigated by tubewells has increased significantly since the mid-1960s, owing to the installation of a large number of government-owned and privately operated tubewells. During 1967-70, only about 8.5 percent of the net sown area in the region was irrigated through tubewells. This proportion rose substantially to 22.5 percent in 1987-90 (Table 1). A close examination of Table 2 further reveals that groundwater irrigation through wells and tubewells constitutes the dominant source of irrigation in Southwestern Haryana. In most districts, a very high proportion of the irrigated area depends on tubewells. For example, Gurugram and Rewari record the highest dependence, with 100 percent of its irrigated area supplied through tubewells. Likewise, Mahendergarh derives 99.16 percent of its irrigation from this source, followed by Bhiwani (75.63 percent) and Jhajjar (57.37 percent). Even in districts such as Rohtak and Bhiwani, where canal irrigation is relatively more significant, tubewells still account for a substantial share of irrigation, contributing 51.29 percent and 75.63 percent respectively during 2017-2020. This pattern clearly demonstrates that groundwater resources form the backbone of agricultural irrigation in Southwestern Haryana. The increasing dependence on tubewells reflects both the limitations of canal irrigation and the growing need for assured, flexible, and farmercontrolled water supply. However, such heavy reliance on groundwater also raises concerns regarding the long-term sustainability of aquifer resources, particularly in areas experiencing over-extraction. Therefore, while tubewell irrigation has significantly strengthened agricultural productivity in the region, its future viability will depend on effective groundwater management and the adoption of sustainable irrigation practices.
| District | Government Canal | Tank | Well, / Tube Well | Other Source | Total Irrigated Area | Total Un-Irrigated Area |
|---|---|---|---|---|---|---|
| Rohtak | 48.70 | 0 | 51.29 | 0.1 | 100 | 0.00 |
| Gurgaon | 0.00 | 0 | 100 | 0.00 | 100 | 0.00 |
| Mahendergarh | 0.83 | 0 | 99.16 | 0.1 | 78.9 | 20.1 |
| Bhiwani | 24.36 | 0 | 75.63 | 0.1 | 81.0 | 19.00 |
| Jhajjar | 42.62 | 0 | 57.37 | 0.1 | 93.8 | 6.2 |
| Rewari | 0.00 | 0 | 100 | 0.00 | 100 | 0.00 |
| SW Haryana | 19.41 | 0 | 80.57 | 0.2 | 92.28 | 7.5 |
| Haryana | 36.36 | 0 | 63.63 | 0.2 | 94.9 | 5.1 |
Table text extracted from the original PDF; superscript letters are shown inline. The original table image is below.
View original table image
| District | Government Canal | Tank | Well, / Tube Well | Other Source | Total Irrigated Area | Total Un Irrigated Area |
|---|---|---|---|---|---|---|
| Rohtak | 37.80 | 0.00 | 21.80 | 0.10 | 59.60 | 40.40 |
| Gurgaon | 4.00 | 0.00 | 34.50 | 0.60 | 39.10 | 60.90 |
| Mahendergarh | 1.30 | 0.00 | 36.80 | 0.10 | 38.20 | 61.80 |
| Bhiwani | 22.80 | 0.00 | 8.50 | 0.20 | 31.50 | 68.50 |
| SW Haryana | 19.20 | 0.00 | 22.50 | 0.20 | 41.90 | 58.10 |
| Haryana | 32.80 | 0.00 | 27.60 | 0.20 | 60.60 | 39.40 |
Table text extracted from the original PDF; superscript letters are shown inline. The original table image is below.
View original table image
Intensity of Irrigation
The intensity of irrigation influences the intensity of cropping, cropping pattern and the agriculture production. The intensity of irrigation is an indicator of irrigation efficiency. It is the ratio of gross area irrigated to net area irrigated in terms of percentage. The higher the index of the intensity of irrigation, the higher the irrigation efficiency and lower the index, the lower the irrigation efficiency (Singh, 1974). The Figure 3 illustrates the spatial and temporal variations in irrigation intensity across the districts of Southwestern Haryana for two time periods: 1987-90, and 2017-20. Irrigation intensity refers to the extent to which irrigated land is utilized for multiple cropping during an agricultural year and is generally expressed as a percentage. It represents the ratio of gross irrigated area to net irrigated area and serves as an important indicator of the degree of agricultural intensification and effective utilization of irrigation resources. During the initial period of 1967-70, irrigation intensity in the region remained relatively moderate. Most districts recorded values ranging between approximately 100 percent and 140 percent (Fig. 3). Rohtak exhibited comparatively higher irrigation intensity, indicating a relatively greater utilization of irrigated land for multiple cropping. In contrast, districts such as Mahendragarh and Gurgaon recorded lower values, reflecting the limited development of irrigation infrastructure and technological inputs during the early phase of agricultural development. The regional average for Southwestern Haryana was moderately lower than the overall state average of Haryana, suggesting that the region had not yet fully benefited from large-scale irrigation expansion. By the period 1987-90, a noticeable increase in irrigation intensity is observed across most districts. This phase coincides with the post-Green Revolution period when agricultural modernization, improved irrigation facilities, and the adoption of high-yielding varieties began to influence farming practices (Fig. 4). Districts such as Gurgaon and Bhiwani recorded considerable growth in irrigation intensity, while Mahendragarh also experienced a gradual increase compared to the earlier period. The improvement in irrigation intensity during this phase reflects the expansion of tube wells, improvements in canal irrigation, and the increasing adoption of double-cropping systems.
In the most recent period, 2017-20, irrigation intensity continues to remain high across the districts, although the growth pattern varies spatially (Fig. 4). Districts such as Charkhi Dadari, Jhajjar, Mahendragarh, and Bhiwani show relatively higher levels of irrigation intensity, indicating the widespread adoption of multiple cropping systems and improved irrigation management. Rewari and Nuh also maintain high levels of irrigation intensity, reflecting sustained agricultural development. The regional average for southwestern Haryana shows a further increase, while the overall state average of Haryana also records high irrigation intensity levels. A district-wise comparison reveals important spatial variations within the region. Gurgaon shows a dramatic increase in irrigation intensity between the earlier decades and the early twentyfirst century, reflecting rapid agricultural transformation and increased reliance on groundwater irrigation. Mahendragarh and Jhajjar demonstrate steady improvements over time, indicating progressive development of irrigation facilities and agricultural practices. Rewari also exhibits a consistent upward trend, while Rohtak maintains relatively stable but high levels of irrigation intensity across most periods.
Level of Irrigation
Figure 5 illustrates the temporal changes in the percentage of net irrigated area across the districts of southwestern Haryana for two different periods: 1987-90, and 2017-20. Net irrigated area refers to the proportion of the net sown area that receives irrigation through various sources such as canals, wells and tube wells. It is an important indicator of agricultural development and reflects the extent to which farming activities depend on controlled water supply rather than rainfall. During the initial period of 1967-70, the percentage of net irrigated area was relatively low across most districts of southwestern Haryana. Rohtak recorded comparatively higher irrigation coverage at around 41.4 percent of the net sown area, while districts such as Gurgaon and Mahendragarh showed significantly lower irrigation levels, with values around 20 percent and 10 percent respectively. Bhiwani and Rewari also exhibited limited irrigation coverage during this period. At the regional level, southwestern Haryana recorded approximately 27 percent net irrigated area, which was lower than the overall state average of Haryana. This pattern reflects the limited availability of irrigation infrastructure during the early stages of agricultural development in the region. In 1987-90, only about two-fifth of cultivable land in southwestern Haryana was under irrigation. Rohtak district was far ahead of the rest where about three-fifth of the cultivated area was irrigated. On the other hand, Bhiwani district had least irrigation facilities where only about 30 per cent area was irrigated. A noticeable improvement in irrigation coverage is observed during the period 1987-90. Most districts experienced a considerable increase in the proportion of irrigated land. Rohtak recorded nearly 60 percent irrigated area, while Gurgaon and Mahendragarh also showed significant improvements compared to the earlier period. Bhiwani displayed moderate levels of irrigation expansion, whereas Rewari continued to show gradual progress. The regional average for Southwestern Haryana increased to around 42 percent, while the state average of Haryana also rose significantly. These improvements can largely be attributed to the expansion of canal irrigation systems, the introduction of tube wells, and the impact of agricultural modernization associated with the Green Revolution. The most recent period, 2017-20, shows that irrigation coverage has reached very high levels across most districts of the region. Rohtak records more than 90 percent of the net sown area under irrigation, while Mahendragarh and Jhajjar also exhibit irrigation coverage above 90 percent. Bhiwani, Rewari, and Gurgaon show substantial improvements compared to earlier decades, although Gurgaon still records comparatively lower values within the region. The regional average for Southwestern Haryana rises to around 89 percent, approaching the overall state average of Haryana, which stands at approximately 92 percent. A district-wise analysis reveals significant spatial variations in irrigation development within the region. Rohtak consistently shows higher levels of irrigation across all periods, indicating better access to irrigation infrastructure and groundwater resources. Jhajjar and Mahendragarh display rapid improvements particularly in the later decades, reflecting the increasing reliance on tube wells and improved irrigation facilities. In contrast, Gurgaon demonstrates relatively slower progress in earlier periods, although it eventually shows considerable growth by the most recent period. Overall, the figure clearly demonstrates a steady and significant increase in the net irrigated area across Southwestern Haryana over the past five decades. This expansion reflects the growing importance of irrigation in enhancing agricultural productivity and stabilizing crop production in a semi-arid region. The widespread adoption of tube wells, expansion of canal networks, and technological advancements in agriculture has played a major role in this transformation.
Conclusion
The present study provides a detailed understanding of the changing agricultural scenario in Southwestern Haryana, focusing on irrigation pattern and irrigation intensity. In Southwestern Haryana's agricultural revolution, irrigation is the most essential aspect. Canal irrigation was effective early on, but its development was uneven and limited in many sections of the region. However, tubewell irrigation grew swiftly and dominated most districts. Groundwater irrigation provided timely and reliable water and helped expand multiple crops and sophisticated farm technologies. Over time, the percentage of irrigated land and intensity increased significantly. However, widespread use of tubewells has made agriculture more dependent on groundwater, raising concerns about falling water tables and irrigation sustainability.
Figures and tables from the paper
| Districts | 1987-90 | 2017-20 |
|---|---|---|
| Rohtak | 118.95 | 147.4 |
| Gurugram | 164.7 | 129.4 |
| Mahendergarh | 128.6 | 190 |
| Bhiwani | 133.16 | 178.6 |
| Jhajjar | DNA | 194.3 |
| Rewari | DNA | 165.1 |
| Nuh | DNA | 164.7 |
| C. Dadari | DNA | 200 |
| Southwestern Haryana | 131.1 | 171.1 |
| Haryana | 150.95 | 185.3 |
Table text extracted from the original PDF; superscript letters are shown inline. The original table image is below.
View original table image
References
12 in the original paper- Aggarwal PK, Moudgil A. Structural change and growth of agriculture in Haryana. Int J Appl Res. 2015;1(13):133-139.
- Aggrawal B. Mechanization in Indian agriculture: impact. New Delhi: Allied Publishers Pvt Ltd; 1983. p. 131-134.
- Ahlawat V, Renu. Regional disparity in cropping intensity and relative impact of irrigation in Haryana. J Bus Manag. 2016;18(9):41-45.
- Aliyev ZH. Low-intensity irrigation efficiency and their application in the conditions of mountain agriculture in Azerbaijan. Agrotechnology. 2017;6(3).
- Bezbaruah MP, Roy N. Factors affecting cropping intensity and use of fertilizers and high yielding variety seeds in Barak Valley. Indian J Agric Econ. 2002;57(2).
- Hajare R, Jaykar T, Patil V, Magdum A. Land use and cropping pattern in Kolhapur district. Online Int Interdiscip Res J. 2014;4:342-348.
- Jha BM, Sinha SK. Towards better management of ground water resources in India. Bhujal News. 2009;24(4):1-20.
- Kamble DC, Mane PS. A study of irrigation intensity of different sources in Malshiras Tehsil. Res Journey Int E-Res J. Special Issue 144;2019. p. 28-36.
- Kumar A, Kumar R, Kaur N. Changing pattern of irrigation intensity in Haryana: a geographical analysis. Indian J Sustain Dev. 2023;10(1):1-11.
- Sharma TC. Technological change in Indian agriculture. Jaipur: Rawat Publications; 1999. p. 113123.
- Singh R. Analysis of spatial-temporal changes in cropping pattern and cropping intensity in agriculture of Haryana. Online Int Interdiscip Res J. 2015;5(6):96104.
- Singh S. Agricultural productivity and agricultural intensity in Rohtas district, Bihar. Int J Eng Res Technol. 2012;1(9):1-11.