
Research article · 2024 · Full text
International Journal of Biology SciencesDopaminergic neuron degeneration and mitochondrial dysfunction in Parkinson disease models
Volume 6(1) · Pages 248–252 · DOI: 10.33545/26649926.2024.v6.i1c.852 ↗
Research areasParkinson's Disease Mechanisms and TreatmentsCoenzyme Q10 studies and effectsMitochondrial Function and Pathology
Abstract
Author-writtenWhat drives the selective vulnerability of dopaminergic neurons in the substantia nigra during Parkinson disease progression? This question has persisted for decades, and mitochondrial dysfunction appears to be at its core. The present research examined how mitochondrial impairment contributes to dopaminergic neuron loss across two well-established animal models of Parkinson disease. Male C57BL/6 mice (n=60) were divided into four groups: vehicle control, MPTP-treated (25 mg/kg), rotenone-treated (2.5 mg/kg), and MPTP with coenzyme Q10 co-administration. Over a 28-day treatment window, animals received daily intraperitoneal injections at the Banaras Hindu University School of Life Sciences animal facility. Tyrosine hydroxylase immunohistochemistry showed that MPTP reduced dopaminergic neuron counts in the substantia nigra pars compacta by 61.4% relative to controls (p<0.001), while rotenone produced a 57.9% reduction (p<0.001). Mitochondrial membrane potential, measured by JC-1 fluorescence, dropped to 31.6% and 36.4% of baseline values in MPTP and rotenone groups respectively by 72 hours post-treatment. CoQ10 co-treatment partially rescued both neuron survival (to 54.8% of control) and membrane potential (to 53.7% of baseline). Complex I activity fell by 68.3% in MPTP-treated animals and 59.7% in the rotenone group. Reactive oxygen species production increased 3.4-fold and 2.9-fold in these respective groups. These findings point to mitochondrial complex I inhibition as a shared mechanism between toxin models and suggest that CoQ10 supplementation offers modest but measurable neuroprotection.
Summary
Source-checkedPlain-language reading of the full paper, prepared with AI and checked against the text. Each point links to the authors' own words.
Why it matters
- The loss of dopaminergic neurons in the Substantia Nigra Pars Compacta (SNpc) is the defining feature of Parkinsonism, despite these neurons making up less than 1% of all brain neurons. View evidence ↗
- Mitochondrial dysfunction is considered a core driver of Parkinson disease, a link first highlighted by accidental MPTP exposure in humans. View evidence ↗
- Both MPTP and rotenone are used to model Parkinson disease because they inhibit mitochondrial complex I, though rotenone crosses the blood-brain barrier more easily. View evidence ↗
The question
- The study aimed to compare the effects of MPTP and rotenone on dopaminergic neuron loss and mitochondrial decline, and to test if Coenzyme Q10 (CoQ10) could reduce this damage. View evidence ↗
What they did
- The experiment used 60 male C57BL/6 mice divided into four groups: a control group, an MPTP group (25 mg/kg), a rotenone group (2.5 mg/kg), and a group receiving both MPTP and CoQ10. View evidence ↗
- MPTP was administered for 5 days, rotenone for 28 days, and CoQ10 (200 mg/kg) was given starting 7 days before MPTP and throughout the treatment. View evidence ↗
- Dopaminergic neuron counts were determined using Tyrosine Hydroxylase (TH) immunostaining and unbiased stereology. View evidence ↗
- Mitochondrial health was measured via membrane potential (JC-1), Complex I activity (spectrophotometry), and reactive oxygen species (ROS) levels (DCFH-DA). View evidence ↗
What they found
- Both toxins caused significant neuron loss in the SNpc, with MPTP reducing counts by 61.4% and rotenone by 57.9% compared to controls. View evidence ↗
- By 72 hours post-treatment, mitochondrial membrane potential fell to 31.6% in the MPTP group and 36.4% in the rotenone group relative to baseline. View evidence ↗
- Complex I activity was significantly reduced, dropping by 68.3% in MPTP-treated mice and 59.7% in rotenone-treated mice. View evidence ↗
- ROS production increased 3.4-fold in the MPTP group and 2.9-fold in the rotenone group. View evidence ↗
- CoQ10 co-administration provided partial protection, with 54.8% of dopaminergic neurons surviving compared to those treated with MPTP alone. View evidence ↗
- Motor deficits were confirmed via rotarod testing, where MPTP-treated mice lasted 87.3±14.6 seconds and rotenone-treated mice lasted 102.7±18.3 seconds, compared to 268.4±22.1 seconds for controls. View evidence ↗
- Locomotor activity in open field tests was reduced by 52.7% in the MPTP group and 44.8% in the rotenone group relative to controls. View evidence ↗
What it means
- The authors conclude that mitochondrial complex I is a central pathological node and recommend that future therapies combine complex I stabilization with antioxidant supplementation. View evidence ↗
- The authors note a narrow therapeutic window, as the steep decline in mitochondrial membrane potential occurs within the first 24 hours. View evidence ↗
Visual summary
3 visualsIllustrations explain the paper; charts are replotted from the paper's own table values.
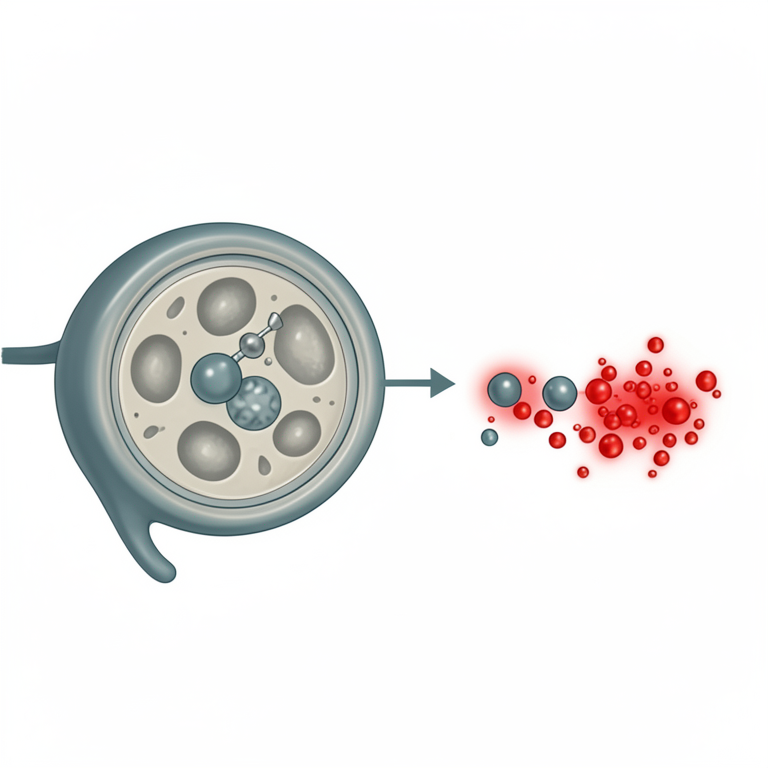
Mechanism of Toxin-Induced Mitochondrial Failure
AI-generated conceptual illustration (Dopaminergic neurons and mitochondria). It explains the idea and does not show study data.
View source evidence ↗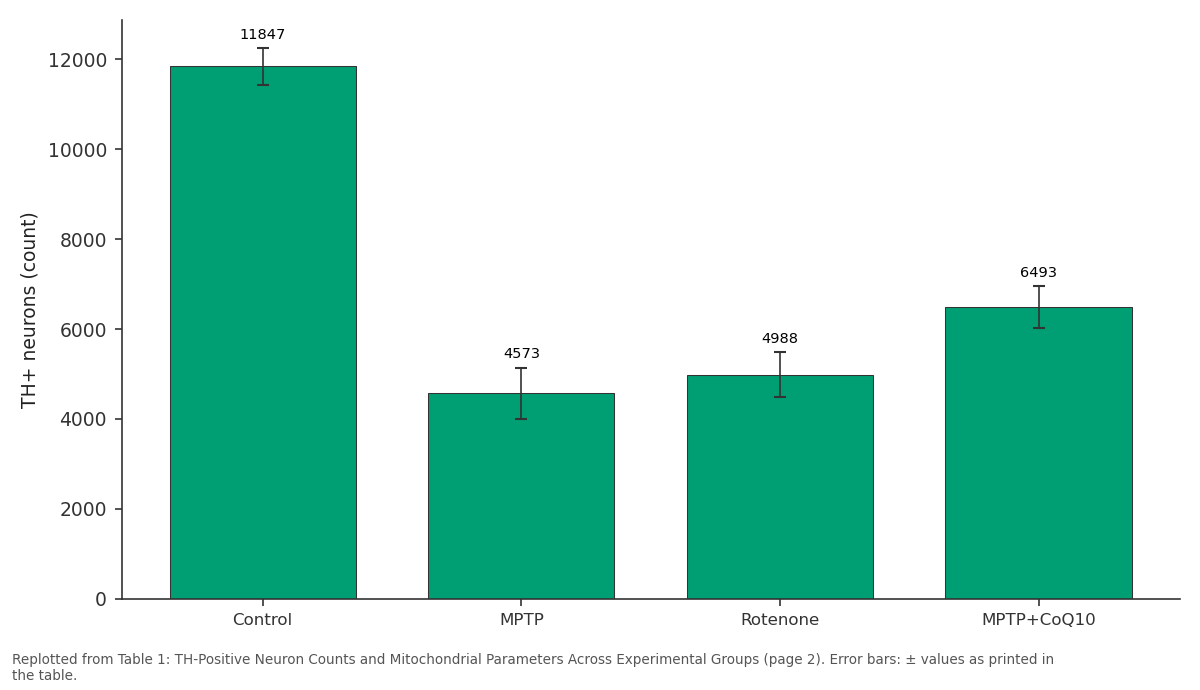
TH+ neurons (count): Control vs MPTP vs Rotenone vs MPTP+CoQ10
Replotted from Table 1 (page 2) of the original paper. Every bar is the paper's own table value.
View source evidence ↗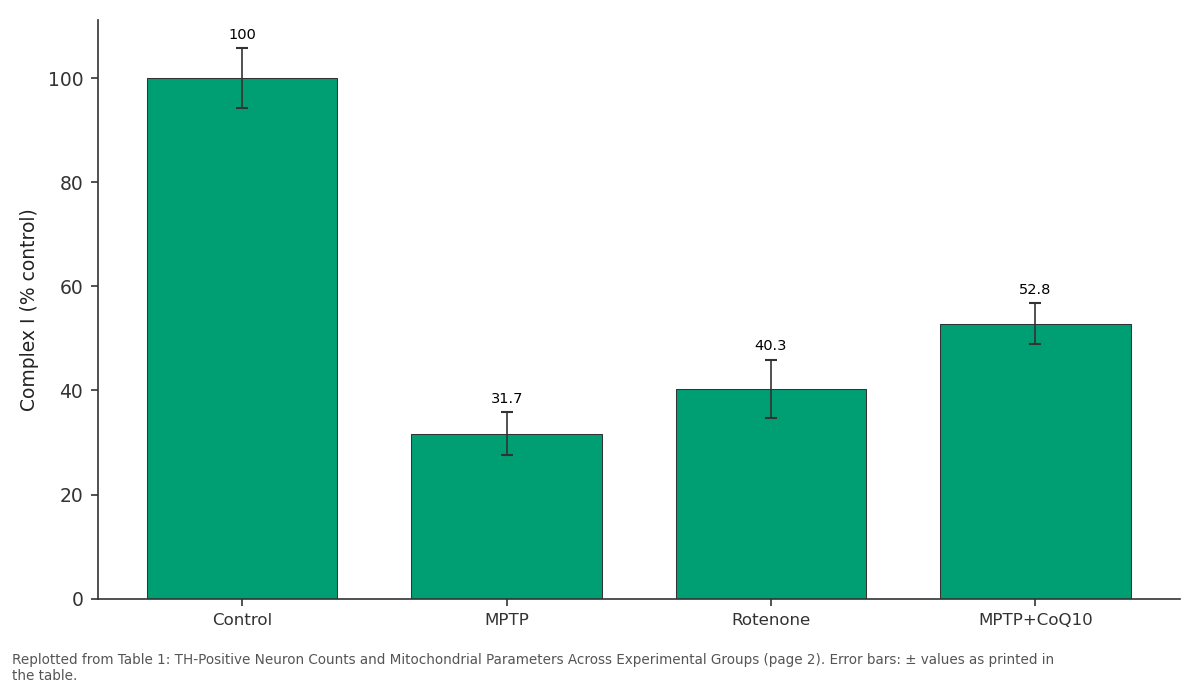
Complex I (% control): Control vs MPTP vs Rotenone vs MPTP+CoQ10
Replotted from Table 1 (page 2) of the original paper. Every bar is the paper's own table value.
View source evidence ↗Figures & tables
From the original paper Table 1
 Table 2
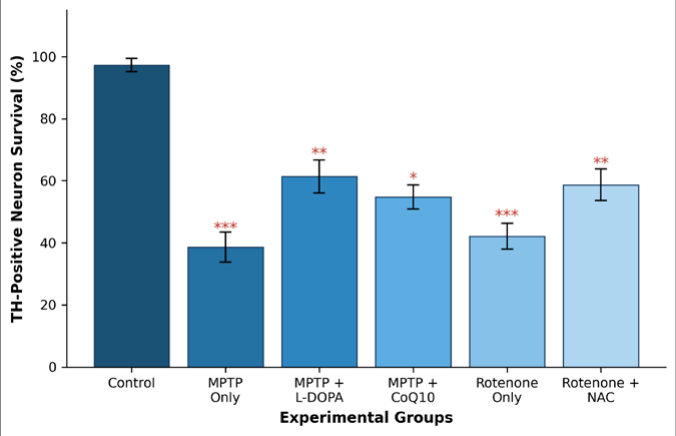 Figure 1
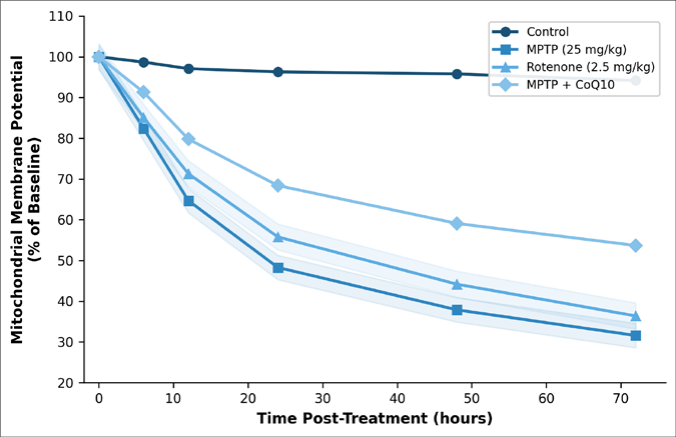 Figure 2
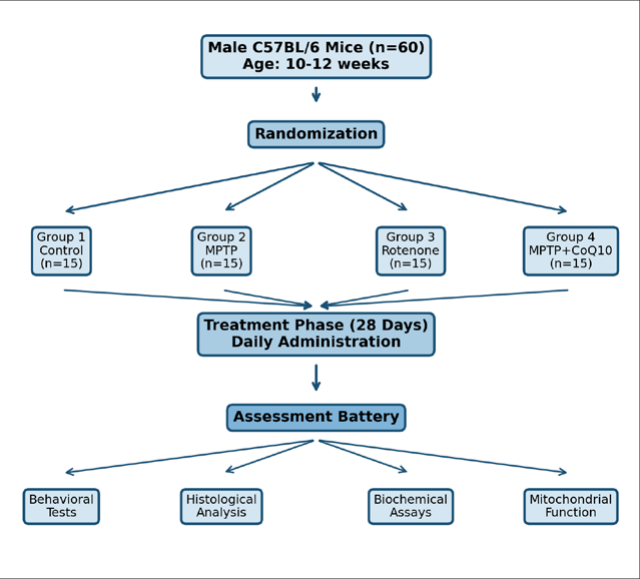 Figure 3
Introduction
How does a single cluster of neurons become so disproportionately affected by a systemic metabolic defect? This remains one of the central puzzles in Parkinson disease research. The dopaminergic neurons of the Substantia Nigra Pars Compacta (SNpc) account for less than 1% of all brain neurons, yet their progressive loss defines the motor symptoms that clinicians recognize as Parkinsonism [1] . Unlike most other neuronal populations, SNpc dopaminergic neurons maintain unusually large axonal arbors and operate under chronic bioenergetic stress [2] . Mitochondrial dysfunction has been implicated in Parkinson disease since the early 1980s, when accidental MPTP exposure caused rapid-onset Parkinsonism in drug users [3] . This observation led to the discovery that MPTP's active metabolite, MPP+, selectively inhibits mitochondrial complex I of the electron transport chain [4] . Rotenone, a naturally occurring pesticide, works through a similar mechanism but crosses the blood-brain barrier more readily and produces systemic complex I inhibition [5] . Both toxins have since become standard tools for modeling Parkinson disease in rodents. Several lines of evidence connect mitochondrial impairment to dopaminergic neuron death. First, post-mortem analyses of Parkinson disease brains consistently show reduced complex I activity in the SNpc [6] . Second, genetic forms of Parkinson disease frequently involve genes that encode mitochondrial proteins PINK1, Parkin, and DJ-1 all play roles in mitochondrial quality control [7] . Third, oxidative stress generated by dysfunctional mitochondria can trigger apoptotic cascades that preferentially affect neurons with high metabolic demand [8] .
Despite extensive work on individual toxin models, direct comparisons between MPTP and rotenone under matched experimental conditions are less common than one might expect [9] . The protective effects of mitochondrial-targeted compounds like coenzyme Q10 (CoQ10) also remain debated, with clinical trial results lagging behind preclinical promise [10] . This research aimed to directly compare dopaminergic neuron loss and mitochondrial functional decline between MPTP and rotenone models while evaluating whether CoQ10 co-administration could attenuate damage. Understanding shared and divergent pathways across these models may help clarify which therapeutic targets are most likely to translate to human disease.
Materials and Methods
Materials and Methods
In-vivo protocol
In-vivo protocol
Material
MPTP hydrochloride (purity ≥98%) and rotenone (purity ≥95%) were purchased from Sigma-Aldrich (Bangalore, India). CoQ10 (pharmaceutical grade, 98.2% purity) was obtained from HiMedia Laboratories (Mumbai, India). JC-1 mitochondrial membrane potential probe, DCFH-DA for ROS detection, and anti-tyrosine hydroxylase rabbit polyclonal antibody were sourced from Thermo Fisher Scientific (Mumbai distributor). Complex I activity assay kits came from Abcam (New Delhi authorized dealer). All secondary antibodies, mounting media, and histological reagents were purchased from local authorized distributors in Varanasi. MPTP was dissolved in sterile saline, rotenone was suspended in sunflower oil with 2% DMSO, and CoQ10 was prepared as an oral suspension in 0.5% carboxymethylcellulose.
Methods
Methods
Sixty mice were randomly allocated to four groups of 15
Each. Group 1 (control) received vehicle injections. Group 2 received MPTP at 25 mg/kg intraperitoneally for 5 consecutive days. Group 3 received rotenone at 2.5 mg/kg intraperitoneally daily for 28 days. Group 4 received the MPTP regimen plus oral CoQ10 at 200 mg/kg daily starting 7 days before MPTP and continuing throughout. The research ran from April 2022 to January 2023 at the Department of Neural Sciences, BHU. At sacrifice on day 29, brains were rapidly dissected. The left hemisphere was fixed in 4% paraformaldehyde for immunohistochemistry, and the right hemisphere was processed fresh for biochemical assays. Tyrosine Hydroxylase (TH) immunostaining followed standard freefloating section protocols with DAB chromogen. THpositive neurons were counted using unbiased stereology (optical fractionator method) with a Leica DM6000 microscope. Mitochondria were isolated from SNpc tissue by differential centrifugation at 4 °C. Membrane potential was assessed via JC-1 aggregate/monomer fluorescence ratio.
Complex I activity was measured spectrophotometrically as NADH:ubiquinone oxidoreductase activity. ROS levels were quantified using DCFH-DA fluorescence. Data were analyzed using one-way ANOVA with Tukey's post-hoc test (SPSS v26), and significance was set at p<0.05.
Ethical considerations
All experimental procedures involving animals were carried out according to guidelines of the Committee for the Purpose of Control and Supervision of Experiments on Animals (CPCSEA), Government of India. The Institutional Animal Ethics Committee of Banaras Hindu University reviewed and approved the research protocol (IAEC/BHU/2022-087) on 15 March 2022, before any experimental work started. Animals were monitored twice daily for signs of distress, and humane endpoints were applied if weight loss exceeded 20% of baseline or if animals showed inability to reach food and water. Pain management during surgical procedures included isoflurane anesthesia (2-3% in oxygen) and post-procedural buprenorphine (0.05 mg/kg subcutaneously). The 3Rs principle replacement, reduction, and refinement guided all decisions about animal numbers and procedural design. Sample sizes were determined by power analysis (G*Power 3.1, effect size f=0.45, power=0.80, α=0.05) to use the minimum number of animals consistent with valid statistical analysis. Behavioral testing confirmed motor deficits consistent with dopaminergic loss. The rotarod test revealed that MPTPtreated mice could remain on the apparatus for only 87.3±14.6 seconds compared to 268.4±22.1 seconds in controls (p<0.001). Rotenone-treated animals managed 102.7±18.3 seconds. Open field locomotor activity was reduced by 52.7% in the MPTP group and 44.8% in the rotenone group relative to controls.
Results
Results
Discussion
The results of this research confirm that MPTP and rotenone produce overlapping but non-identical patterns of dopaminergic neuron death and mitochondrial failure. MPTP caused slightly more severe neuron loss and faster mitochondrial depolarization than rotenone under the dosing regimens used here. This difference likely reflects the distinct pharmacokinetics of these two compounds MPTP requires metabolic activation by monoamine oxidase B in glial cells before it can inhibit complex I, while rotenone acts directly [3,5] . The partial neuroprotection afforded by CoQ10 coadministration aligns with earlier reports showing that mitochondrial-targeted antioxidants can slow, though not prevent, dopaminergic neuron degeneration [10,11] . Our data showed that CoQ10 preserved roughly 16 percentage points more neurons compared to MPTP alone. But this level of rescue falls well short of what would be needed for clinical relevance, echoing the disappointing results of the QE3 clinical trial that failed to show benefit in early Parkinson disease patients [12] . One feature worth highlighting is the temporal pattern of mitochondrial membrane potential loss. The steep decline between 6 and 24 hours suggests a critical window during which the mitochondrial permeability transition pore may open irreversibly [13] . Interventions delivered after this window as happens in most clinical scenarios would likely be less effective. The 3.4-fold increase in ROS observed in MPTP-treated animals points toward oxidative damage as a downstream consequence of complex I failure rather than a separate, parallel process [14] . This interpretation is consistent with work by Perier and colleagues showing that antioxidant treatment alone doesn't prevent cell death if complex I function isn't also addressed [15] .
Conclusion
This research provides a direct, head-to-head comparison of dopaminergic neuron vulnerability and mitochondrial dysfunction in MPTP and rotenone mouse models under uniform experimental conditions. Both toxins produced severe TH-positive neuron loss in the substantia nigra pars compacta, accompanied by progressive mitochondrial membrane depolarization, complex I activity decline, and elevated reactive oxygen species. MPTP appeared marginally more neurotoxic at the doses employed, though the differences between models were modest. CoQ10 supplementation offered partial but statistically meaningful neuroprotection, preserving roughly 16 percentage points more dopaminergic neurons than MPTP treatment alone. However, the degree of rescue was insufficient to restore normal function, consistent with clinical trial outcomes. The steep decline in membrane potential during the first 24 hours identifies a narrow therapeutic window that any neuroprotective strategy would need to target. These findings support the view that mitochondrial complex I remains a central and shared pathological node in toxic parkinsonism, and they suggest that future neuroprotective approaches should combine complex I stabilization with antioxidant supplementation rather than relying on either strategy in isolation. Researchers developing novel therapeutics for Parkinson disease should consider whether candidate compounds can act rapidly enough to intervene before the mitochondrial permeability transition becomes irreversible.
Acknowledgement
Acknowledgements
Figures and tables from the paper
| Parameter | Control | MPTP | Rotenone | MPTP+CoQ10 |
|---|---|---|---|---|
| TH+ neurons (count) | 11,847±412 | 4,573±568 | 4,988±497 | 6,493±461 |
| MMP (% baseline) | 94.2±3.1 | 31.6±4.7 | 36.4±5.2 | 53.7±4.3 |
| Complex I (% control) | 100.0±5.8 | 31.7±4.1 | 40.3±5.6 | 52.8±3.9 |
| ROS (fold change) | 1.00±0.12 | 3.41±0.38 | 2.87±0.33 | 2.14±0.27 |
| Body weight change (g) | +1.3±0.4 | -3.8±0.7 | -2.6±0.6 | -1.9±0.5 |
Table text extracted from the original PDF; superscript letters are shown inline. The original table image is below.
View original table image
| Time (h) | Control | MPTP | Rotenone | MPTP+CoQ10 | p-value |
|---|---|---|---|---|---|
| 0 | 100.0±0.0 | 100.0±0.0 | 100.0±0.0 | 100.0±0.0 | — |
| 6 | 98.7±1.4 | 82.4±3.8 | 85.1±4.1 | 91.3±2.7 | <0.001 |
| 12 | 97.1±2.0 | 64.7±5.1 | 71.3±4.6 | 79.8±3.4 | <0.001 |
| 24 | 96.3±1.8 | 48.3±4.9 | 55.8±5.3 | 68.4±3.8 | <0.001 |
| 48 | 95.8±2.3 | 37.9±4.2 | 44.2±4.8 | 59.1±4.1 | <0.001 |
| 72 | 94.2±3.1 | 31.6±4.7 | 36.4±5.2 | 53.7±4.3 | <0.001 |
Table text extracted from the original PDF; superscript letters are shown inline. The original table image is below.
View original table image
References
16 in the original paper- Poewe W, Seppi K, Tanner CM, et al. Parkinson disease. Nature Reviews Disease Primers. 2017;3:17013.
- Bolam JP, Pissadaki EK. Living on the edge with too many mouths to feed: why dopamine neurons die. Movement Disorders. 2012;27(12):1478-1483.
- Langston JW, Ballard P, Tetrud JW, Irwin I. Chronic parkinsonism in humans due to a product of meperidine-analog synthesis. Science. 1983;219(4587):979-980.
- Nicklas WJ, Vyas I, Heikkila RE. Inhibition of NADHlinked oxidation in brain mitochondria by 1-methyl-4phenyl-pyridine, a metabolite of the neurotoxin MPTP. Life Sciences. 1985;36(26):2503-2510.
- Betarbet R, Sherer TB, MacKenzie G, et al. Chronic systemic pesticide exposure reproduces features of Parkinson disease. Nature Neuroscience. 2000;3(12):1301-1306.
- Schapira AH, Cooper JM, Dexter D, et al. Mitochondrial complex I deficiency in Parkinson disease. The Lancet. 1989;333(8649):1269-1269.
- Pickrell AM, Youle RJ. The roles of PINK1, Parkin, and mitochondrial fidelity in Parkinson disease. Neuron. 2015;85(2):257-273.
- Lin MT, Beal MF. Mitochondrial dysfunction and oxidative stress in neurodegenerative diseases. Nature. 2006;443(7113):787-795.
- Zeng XS, Geng WS, Jia JJ. Neurotoxin-induced animal models of Parkinson disease: pathogenic mechanism and assessment. ASN Neuro. 2018;10:1759091418777438.
- Shults CW, Oakes D, Kieburtz K, et al. Effects of coenzyme Q10 in early Parkinson disease: evidence of slowing of functional decline. Archives of Neurology. 2002;59(10):1541-1550.
- Beal MF. Mitochondria, oxidative damage, and inflammation in Parkinson disease. Annals of the New York Academy of Sciences. 2003;991(1):120-131.
- Parkinson Study Group QE3 Investigators. A randomized clinical trial of high-dosage coenzyme Q10 in early Parkinson disease: no evidence of benefit. JAMA Neurology. 2014;71(5):543-552.
- Kroemer G, Galluzzi L, Brenner C. Mitochondrial membrane permeabilization in cell death. Physiological Reviews. 2007;87(1):99-163.
- Subramaniam SR, Chesselet MF. Mitochondrial dysfunction and oxidative stress in Parkinson disease. Progress in Neurobiology. 2013;106:17-32.
- Perier C, Tieu K, Guegan C, et al. Complex I deficiency primes Bax-dependent neuronal apoptosis through mitochondrial oxidative damage. Proceedings of the National Academy of Sciences. 2005;102(52):19126-19131.
- Blesa J, Przedborski S. Parkinson disease: animal models and dopaminergic cell vulnerability. Frontiers in Neuroanatomy. 2014;8:155.