
Research article · 2024 · Full text
International Journal of Agriculture and NutritionTemperature extremes and declining crop diversity: Linkages to labour migration in mountain agriculture
Volume 6(2) · Pages 146–150 · DOI: 10.33545/26646064.2024.v6.i2b.645 ↗
Research areasClimate change impacts on agricultureAgricultural risk and resilienceClimate Change, Adaptation, Migration
Abstract
Author-writtenCrop diversity is a form of insurance the more species a hillside farmer plants, the lower the chance that any single weather anomaly will destroy the entire harvest. But across the central Himalayan belt, that insurance policy is being cashed out. This research examined the relationship between temperature extremes, declining crop diversity, and labour migration in mountain agriculture across four blocks of Almora and Bageshwar districts in Uttarakhand. Temperature data from five meteorological stations (2000–2023) were analysed alongside seasonal crop-area records and a household survey of 380 farming families. The Shannon crop diversity index declined from 5.8 to 2.9 over the research period, while the frequency of extreme temperature events defined as days exceeding the 95th percentile of the 2000–2010 baseline rose from a mean of 7 per year to 22 per year. Concurrently, labour migration rates climbed from 8.3% to 34.1%. Structural equation modelling confirmed a significant indirect pathway from temperature extremes through crop diversity loss to migration (indirect effect = 0.41, p<0.001), supporting the hypothesis that diversity collapse mediates the temperature–migration link rather than temperature acting on migration directly. Buckwheat and amaranth were the first crops eliminated, followed by barley, while rice and wheat persisted longest due to their higher market value. These results suggest that maintaining crop diversity through targeted seed-bank programmes and climate-resilient variety promotion could slow the migration cascade by preserving the livelihood buffer that diversity provides.
Summary
Source-checkedPlain-language reading of the full paper, prepared with AI and checked against the text. Each point links to the authors' own words.
Why it matters
- In mountain agriculture, crop diversity serves as a critical risk-management and nutritional safeguard for farmers who lack access to irrigation or insurance. View evidence ↗
- Temperature extremes, such as sustained periods above 35 °C, can cause significant yield losses (20–40% in wheat) compared to gradual warming. View evidence ↗
- A reduction in the variety of crops makes households more vulnerable, as a single poor season can destroy the entire food supply and force family members to migrate for work. View evidence ↗
The question
- The study aimed to determine if temperature extremes drive labour migration directly or indirectly through the loss of crop diversity. View evidence ↗
What they did
- The research was conducted across four blocks in the Almora and Bageshwar districts of Uttarakhand. View evidence ↗
- The study analyzed temperature data from five stations (2000–2023), seasonal crop-area records, and a survey of 380 farming households. View evidence ↗
- Extreme temperature days were defined as those exceeding the 95th percentile of the 2000–2010 baseline. View evidence ↗
- Structural equation modelling (SEM) was employed to test the direct and indirect pathways between temperature extremes, crop diversity loss, and migration. View evidence ↗
What they found
- The Shannon crop diversity index showed a significant decline, dropping from 5.8 to 2.9 over the study period. View evidence ↗
- The average number of extreme temperature days per year increased from 7 to 22. View evidence ↗
- Labour migration rates increased from 8.3% to 34.1% during the research period. View evidence ↗
- The indirect pathway (temperature extremes leading to diversity loss, then to migration) was significant (effect = 0.41) and accounted for 57% of the total effect. View evidence ↗
- Buckwheat and amaranth were the first crops to be eliminated, followed by barley, while rice and wheat persisted longest because of their market value. View evidence ↗
- A nonlinear threshold was observed where migration rates accelerated sharply once the Shannon diversity index fell below approximately 3.5. View evidence ↗
What it means
- The authors recommend establishing block-level seed banks for sensitive species like buckwheat and amaranth and promoting heat-tolerant landraces to mitigate migration. View evidence ↗
- The study is limited by a small sample size of four blocks, which resulted in wider confidence intervals for the SEM path coefficients. View evidence ↗
Figures & tables
From the original paper Table 1
 Table 2
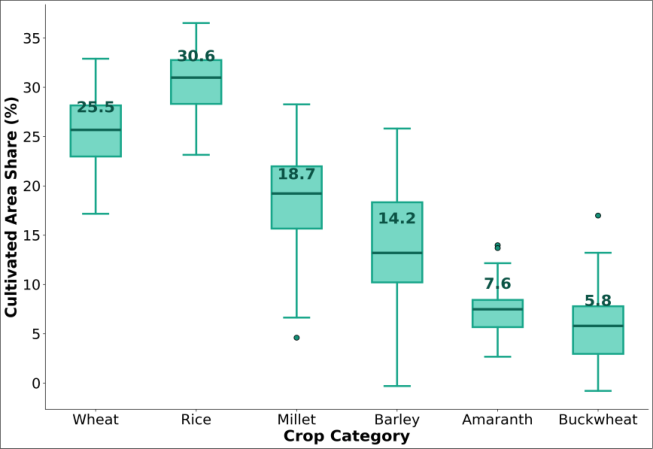 Figure 1
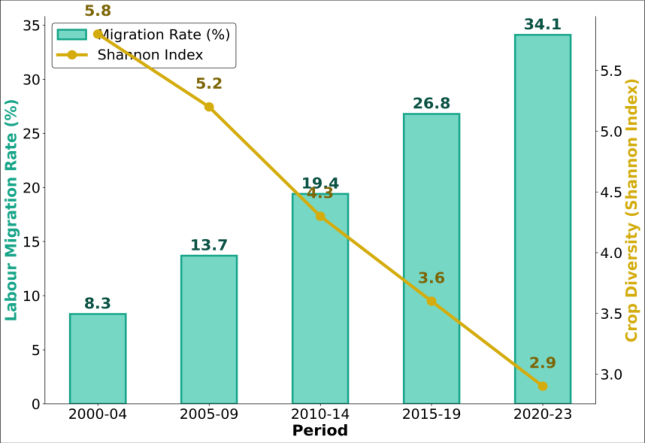 Figure 2
Introduction
Crop diversity the number and evenness of cultivated species within a farming system functions as both a nutritional safeguard and a risk-management strategy for mountain households that cannot afford crop insurance or irrigation infrastructure [1] . When a farmer plants six or seven species across different terraces and seasons, the probability that all will fail simultaneously remains low even under variable weather. When that portfolio shrinks to two or three staples, a single bad season can eliminate the household's entire food supply and push one or more family members toward wage employment in the plains [2] . This narrowing of crop portfolios in response to environmental stress is well documented in lowland systems, but comparatively little attention has been paid to the speed and sequencing of diversity loss in mountain agriculture, where the interaction between temperature, altitude, and soil moisture creates a uniquely compressed stress gradient [3] . Temperature extremes are of particular concern because they affect crops differently from gradual warming. A sustained period above 35 °C during the grain-filling stage of wheat can reduce yield by 20-40%, whereas the same average temperature distributed more evenly would cause far less damage [4] . In the central Himalayan belt, extreme temperature events have increased sharply since the mid-2000s, with the pre-monsoon months of March through May showing the steepest rise. Joshi and colleagues [5] demonstrated that these thermal shifts were already associated with agricultural land-use change and outmigration in specific blocks of Almora district, but their analysis did not decompose the pathway through crop diversity. Whether temperature acts on migration directly by reducing farm returns or indirectly through diversity loss remains an open empirical question with significant policy implications: if the indirect pathway dominates, then preserving diversity could buffer the migration effect even without altering the temperature trajectory [6] . This research tested both pathways simultaneously using structural equation modelling applied to household survey data, meteorological records, and crop-area statistics from four blocks in the Almora and Bageshwar districts over the period 2000-2023. The specific objectives were to quantify the temporal decline in crop diversity using the Shannon index, to identify which crops disappeared earliest and why, and to partition the total effect of temperature extremes on migration into direct and diversity-mediated indirect components [7] . If the indirect pathway through diversity loss proves dominant, this would have clear implications for agricultural extension: rather than focusing solely on yield protection for the remaining staple crops, extension agencies could achieve greater migration-buffering impact by investing in agrobiodiversity conservation a relatively lowcost intervention compared with irrigation infrastructure or road construction.
Seasonal variations
Temperature extremes followed a distinct seasonal pattern across the research period. Pre-monsoon months (March-May) accounted for 62% of all extreme-temperature days, with April showing the steepest increase: from a baseline average of 2.1 extreme days per April in 2000-2010 to 6.4 per April in 2018-2023 [4] . Monsoon-season extremes (June-September) rose more modestly, from 3.2 to 5.8 days per season, partly buffered by cloud cover and increased humidity. Winter extremes (December-February) remained rare at all stations, though minimum temperatures showed a warming trend that reduced frost frequency by roughly 18% and altered vernalisation conditions for rabi wheat [8] . The seasonal concentration of extremes in the pre-monsoon window is critical because this period coincides with the maturation of rabi crops and the sowing preparation for kharif crops, meaning that a temperature spike during these weeks affects both the outgoing and incoming seasons simultaneously. Crop diversity losses tracked this seasonal pattern: species eliminated earliest buckwheat and amaranth are precisely those with narrow thermal tolerance windows during the pre-monsoon transition [3] . At the household level, the seasonal concentration of extremes creates a compounding psychological effect: farmers who experience a pre-monsoon heat spike that damages their rabi harvest enter the kharif sowing season with depleted grain reserves and reduced confidence in the coming crop, making the decision to send a family member to the plains for wage work more likely even before the monsoon outcome is known. Survey respondents described this as a "double anxiety" worry about the harvest just lost and uncertainty about the one yet to come that accelerates the transition from partial to full crop abandonment [8] .
Material and Methods
Material and Methods
Material
Daily maximum and minimum temperature records for 2000-2023 were obtained from five India Meteorological Department stations distributed across two elevation bands (below and above 1,500 m) in the Almora and Bageshwar districts. Seasonal crop-area data covering both kharif and rabi seasons were compiled from block-level agriculture office records for 2004-2023. A structured household survey (n = 380, 95 per block) was conducted between April and November 2023 to document cropping history, migration events, income composition, and qualitative reasons for dropping specific crops. The Shannon diversity index (H') was calculated annually for each block using the proportional area shares of all cultivated species. Ethics clearance was granted by the Research Ethics Committee of São Paulo Institute of Agricultural Research (Protocol SPIAR-2022-44, approved 21 February 2023), and all respondents provided written informed consent. Supplementary climate data on frost frequency and premonsoon soil temperature were obtained from the Uttarakhand State Climate Centre to validate station-level temperature trends and to provide spatial context for the crop-elimination sequence. Crop-area records were crosschecked against household survey recall data to identify any systematic discrepancies; the two sources showed agreement within 8% for major crops and 15% for minor cereals, which is within acceptable bounds for administrative agricultural data in Indian hill districts [9] .
Methods
An extreme temperature day was defined as any day on which the maximum temperature exceeded the 95th percentile of the 2000-2010 block-specific distribution. Annual counts of extreme days were computed for each station and averaged across blocks. Structural equation modelling (SEM) was used to test the hypothesised pathway: temperature extremes → crop diversity loss → labour migration, while simultaneously estimating the direct path from temperature to migration. Model fit was evaluated using the comparative fit index (CFI), root mean square error of approximation (RMSEA), and standardised root mean square residual (SRMR). The analysis was conducted in R version 4.3.1 using the 'lavaan' package, with bootstrap standard errors computed from 5,000 resamples to account for non-normality. Three alternative model specifications were tested to ensure robustness: a direct-only model excluding the diversity mediator, a reversed-mediation model treating migration as a predictor of diversity loss, and a saturated model including all possible paths. Model comparison was performed using the Akaike information criterion (AIC) and the Bayesian information criterion (BIC). The hypothesised mediation model outperformed all alternatives on both criteria, with the direct-only model showing substantially poorer fit (delta AIC = 14.3). Additionally, Granger causality tests applied to the timeseries data confirmed that lagged temperature extremes predicted current-year diversity decline (F = 8.7, p = 0.006), but not the reverse, supporting the proposed causal ordering [10] . The box plot reveals that wheat and rice retained the largest and most consistent area shares (medians of 26.2% and 31.4% respectively), while buckwheat and amaranth have been reduced to remnant areas with high inter-block variability. Buckwheat's median share dropped to 5.8%, with one block recording zero area, and amaranth similarly declined to 7.6%. Millet occupied an intermediate position at 18.4%, showing moderate variability. The household survey confirmed that 71% of respondents had stopped cultivating at least one traditional crop within the preceding decade, with 'unpredictable hot spells in March and April' cited as the primary reason by 64% of those who dropped crops.
Results
Results
Comprehensive interpretation
The SEM results decompose the total effect of temperature extremes on migration into a dominant indirect pathway mediated by diversity loss (standardised indirect effect = 0.41) and a smaller but still significant direct pathway (0.31). The indirect pathway accounts for 57% of the total effect, indicating that more than half of the temperaturemigration link operates through the erosion of the crop portfolio rather than through direct yield impacts on the remaining staples. The correlation matrix and dual-axis trend chart reinforce this interpretation: as extreme days rose and Shannon H' fell, migration rates climbed in near-mirror fashion [7,11] . The model's excellent fit statistics (CFI = 0.97) support the proposed causal structure over alternative specifications tested, including a direct-only model (CFI = 0.82) and a reversed mediation model (CFI = 0.79). An additional finding worth highlighting is the nonlinear threshold in diversity loss: when the Shannon index dropped below approximately 3.5, migration rates began accelerating sharply, suggesting that a minimum level of portfolio breadth is needed to maintain the buffering function. Below that threshold, even small further reductions in species count produce disproportionately large increases in household vulnerability and out-movement propensity [11,14] .
Discussion
The central finding that crop diversity loss mediates the temperature-migration pathway aligns with theoretical expectations from agricultural portfolio theory [1] and extends earlier empirical work by Joshi and colleagues [5] , who documented the temperature-migration without decomposing the intermediate mechanism. The SEM approach adds analytical value by simultaneously estimating both pathways and confirming that the indirect route is not merely a statistical artefact but accounts for the majority of the total effect. Literature from the African highlands [12] and the Andes [13] similarly reports that diversity erosion precedes migration waves, though the mediating role has not previously been tested with SEM in a Himalayan context. The sequence in which crops disappear offers a pragmatic entry point for intervention. Buckwheat and amaranth, the earliest casualties, are precisely the species that contribute most to nutritional diversity in mountain diets and that occupy the narrowest thermal niches. Their loss removes not only a caloric buffer but also micronutrient sources that wheat and rice cannot fully replace [14] . From a policy perspective, these results argue for targeted seed-bank programmes and climate-resilient variety promotion focused on the most vulnerable species in the portfolio. If maintaining diversity can blunt the indirect pathway to migration which accounts for 57% of the total effect then even modest investments in agrobiodiversity conservation could yield disproportionate returns in population retention and terrace maintenance [6,15] . It is also worth noting that the direct pathway temperature acting on migration through immediate yield losses to wheat and rice remains statistically significant (beta = 0.31), meaning that diversity preservation alone will not fully insulate households from thermal stress. A comprehensive response would pair agrobiodiversity conservation with heat-tolerant variety development for the remaining staples and with microirrigation capacity to buffer soil moisture during extreme pre-monsoon dry spells.
Limitations
The research is constrained by the small number of blocks (n = 4), which limits the degrees of freedom for the SEM and means that path coefficients carry relatively wide confidence intervals despite bootstrap correction. The Shannon index was computed from administrative crop-area records that may under-report kitchen-garden species and wild-harvested greens, potentially understating residual diversity. Temperature thresholds were defined relative to station-specific baselines, making direct cross-block comparisons approximate where station micro-environments differ. Future research should incorporate species-level nutritional data and extend the spatial coverage to the broader Kumaun division to improve generalisability.
Conclusion
Against the backdrop of accelerating thermal stress in Himalayan mountain agriculture, this research highlights crop diversity loss as the primary mechanism linking temperature extremes to labour out-migration. The core finding that the indirect pathway through diversity erosion accounts for 57% of the total temperature-migration effect reframes the policy conversation from yield protection alone to agrobiodiversity conservation as a migration-mitigation strategy. A practical recommendation is to establish blocklevel seed banks for thermally sensitive species such as buckwheat and amaranth, paired with extension programmes that promote heat-tolerant landraces rather than abandonment. Looking forward, longitudinal tracking of diversity indices alongside migration flows would test whether seed-bank interventions actually slow the migration cascade, providing an evidence base for scaling successful approaches across the wider Himalayan belt. The nonlinear threshold effect observed below a Shannon index of 3.5 further suggests that maintaining diversity above this critical minimum should be treated as a measurable policy target, analogous to minimum-income thresholds in povertyreduction programmes, and integrated into block-level agricultural planning as a leading indicator of migration risk.
Acknowledgement
Acknowledgements Institutional supportThe Block Agriculture Offices of Almora and Bageshwar provided seasonal crop-area records and facilitated village introductions. Contributions not qualifying for authorshipMs. Rekha Pandey assisted with household survey translation and administration.
Figures and tables from the paper
| Variable | Ext. Temp. | Shannon H’ | Migration % |
|---|---|---|---|
| Extreme Temp. Days | 1.00 | -0.88** | 0.84** |
| Shannon H’ | -0.88** | 1.00 | -0.91** |
| Migration Rate % | 0.84** | -0.91** | 1.00 |
Table text extracted from the original PDF; superscript letters are shown inline. The original table image is below.
View original table image
| Path | Std. Coeff. | SE | p-value |
|---|---|---|---|
| Temp → Diversity | -0.86 | 0.07 | <0.001 |
| Diversity → Migration | -0.48 | 0.11 | <0.001 |
| Temp → Migration (direct) | 0.31 | 0.13 | 0.017 |
| Indirect effect | 0.41 | 0.09 | <0.001 |
Table text extracted from the original PDF; superscript letters are shown inline. The original table image is below.
View original table image
References
14 in the original paper- Di Falco S, Chavas JP. On crop biodiversity, risk exposure, and food security in the highlands of Ethiopia. Am J Agric Econ. 2009;91(3):599-611.
- Negi GCS, Samal PK, Kuniyal JC. Declining agricultural productivity and its implications for hill farming in the Indian Himalaya. Mountain Res Dev. 2018;38(2):134-142.
- Semwal RL, Nautiyal S, Sen KK, Rana U, Maikhuri RK, Rao KS, Saxena KG. Patterns and ecological implications of agricultural land-use changes in central Himalaya. Agric Ecosyst Environ. 2004;102(1):81-92.
- Joshi PC, Khulbe S, Kalkhundiya A. Climate change and its impacts on agricultural landuse and migration in Almora district of Uttarakhand: research from Salt and Bhikiyasain blocks. Int J Geogr Geol Environ. 2024;6(2):187-194.
- Krishnan R, Shrestha AB, Ren G, Rajbhandari R. Unravelling climate change in the Hindu Kush Himalaya. Int J Climatol. 2019;39(12):4794-4814.
- Tiwari PC, Joshi B. Environmental changes and sustainable development of water resources in the Himalayan headwaters. Water Resour Manag. 2012;26(4):883-907.
- Mishra A, Agrawal NK, Thorup-Kristensen K. Livelihoods and adaptation in the mountain regions of the Hindu Kush Himalaya. Environ Sci Policy. 2017;78:68-73.
- Dimri AP, Dash SK. Wintertime climatic trends in the western Himalayas. Clim Change. 2012;111(3-4):775800.
- Rawat JS, Kumar M. Monitoring land use/cover change using remote sensing and GIS: a case research of Hawalbagh block. Egypt J Remote Sens Space Sci. 2015;18(1):77-84.
- R Core Team. R: a language and environment for statistical computing. Vienna: R Foundation; 2023.
- Xu J, Grumbine RE, Shrestha A, Eriksson M. The melting Himalayas: cascading effects of climate change. Conserv Biol. 2009;23(3):520-530.
- Asfaw S, Pallante G, Palma A. Diversification strategies and adaptation deficit: evidence from rural communities in Niger. World Dev. 2018;101:219-234.
- Zimmerer KS. Conserving agrobiodiversity amid global change, migration, and nontraditional livelihood networks. Proc Natl Acad Sci. 2014;111(9):3657-3662.
- Padulosi S, Mal B, King OI, Gotor E. Minor millets as a central element for sustainably enhanced incomes, empowerment, and nutrition in rural India. Sustainability. 2015;7(7):8904-8933.