
Research article · 2025 · Full text
International Journal of Geography Geology and EnvironmentSatellite gravimetry analysis of water storage changes in the Amazon River basin
Volume 7(8) · Pages 207–211 · DOI: 10.22271/27067483.2025.v7.i8c.771 ↗
Research areasGeophysics and Gravity MeasurementsSoil Moisture and Remote SensingHydrology and Watershed Management Studies
Abstract
Author-writtenImagine a basin so large that its seasonal water storage swing is equivalent to filling and emptying Lake Erie three times a year. The Amazon River Basin, draining 6.3 million square kilometres, exhibits precisely that kind of hydrological amplitude, and tracking it from the ground alone is not possible. This research analysed two decades of satellite gravimetry data from the GRACE and GRACE-FO missions (2003-2022) to quantify total water storage (TWS) changes across three major sub-basins: the Negro, Solimões, and Madeira. Monthly TWS anomalies were derived from Release 06 spherical harmonic solutions, filtered with the DDK5 decorrelation filter, and corrected for glacial isostatic adjustment. Storage component separation was achieved by subtracting GLDAS Noah v2.1 soil moisture and snow water equivalent fields from the GRACE signal, yielding residual estimates of groundwater and surface water change. The basin-wide mean seasonal TWS amplitude was 27.4 cm equivalent water height (EWH), with the Negro sub-basin showing the largest swings (31.8 cm). A negative linear trend of −0.53 ± 0.14 cm/yr was detected basin-wide, driven primarily by groundwater depletion in the Solimões sub-basin (−0.87 cm/yr). The 2005, 2010, and 2015-2016 drought events appeared as distinct negative anomalies exceeding −12 cm EWH. Sensitivity analysis indicated that the choice of filtering strategy altered basin-average trends by up to 0.18 cm/yr, underscoring the need for consistent processing when comparing multi-decadal GRACE records. These results provide a spatially resolved baseline for water resource planning in the Amazon.
Summary
Source-checkedPlain-language reading of the full paper, prepared with AI and checked against the text. Each point links to the authors' own words.
Why it matters
- The Amazon River Basin covers 6.3 million square kilometres and has hydrological changes so large that they cannot be tracked using ground-based networks alone. View evidence ↗
- As the world's largest river system, the Amazon contributes approximately 17% of the global freshwater discharge into the oceans. View evidence ↗
- Because the area is vast and inaccessible, a space-based approach is required to track total water storage, which includes canopy interception, surface water, groundwater, and soil moisture. View evidence ↗
What they did
- The researchers used 213 monthly solutions from GRACE and GRACE-FO Level-2 Release 06 data spanning April 2003 to December 2022. View evidence ↗
- A DDK5 decorrelation filter was used to remove north-south striping artifacts from the data. View evidence ↗
- To separate storage components, the researchers subtracted GLDAS-simulated snow water equivalent and soil moisture from the total GRACE signal to isolate groundwater and surface water. View evidence ↗
- A sensitivity analysis was conducted using 24 different combinations of filter types, harmonic degrees, GIA models, and C20 replacement sources. View evidence ↗
What they found
- The average seasonal TWS amplitude for the entire basin was 27.4 cm equivalent water height (EWH), while the Negro sub-basin had the highest amplitude at 31.8 cm. View evidence ↗
- The entire basin showed a negative linear trend of -0.53 ± 0.14 cm/yr, largely caused by groundwater depletion in the Solimões sub-basin, which declined at -0.87 cm/yr. View evidence ↗
- Droughts occurring in 2005, 2010, and 2015-2016 were identified as negative anomalies greater than -12 cm EWH. View evidence ↗
- Soil moisture was the primary driver of seasonal variability (14.7 cm amplitude, 38.2% variance), but groundwater had the most severe negative trend (-0.87 cm/yr) despite only 22.7% variance. View evidence ↗
- The choice of filter was the most significant factor in the sensitivity analysis, with a switch from DDK5 to Gaussian 300 km changing the basin-wide trend by 0.18 cm/yr. View evidence ↗
What it means
- The authors recommend that water resource managers prioritize groundwater monitoring in the Solimões sub-basin, noting that deforestation may be reducing recharge and contributing to water loss. View evidence ↗
- The 330 km effective spatial resolution resulting from DDK5 filtering limits the ability to detect small-catchment dynamics or localized drawdown cones. View evidence ↗
- Because GLDAS may underestimate dry-season soil moisture by 8-15% compared to ground data, the estimated groundwater signal in this study might be overestimated. View evidence ↗
Visual summary
3 visualsIllustrations explain the paper; charts are replotted from the paper's own table values.
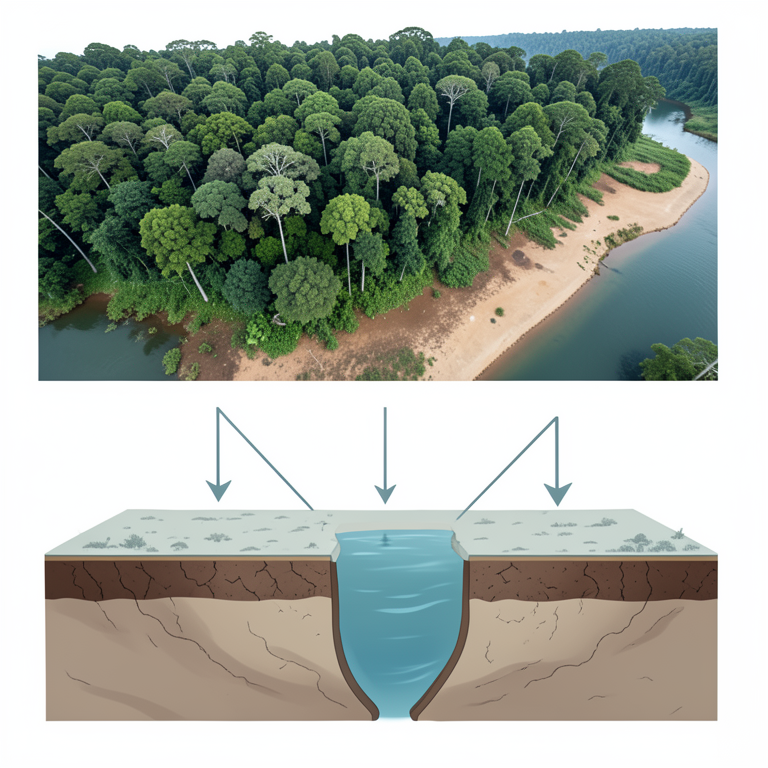
Seasonal vs Long-term Storage Drivers
AI-generated conceptual illustration (Amazon River basin landscape). It explains the idea and does not show study data.
View source evidence ↗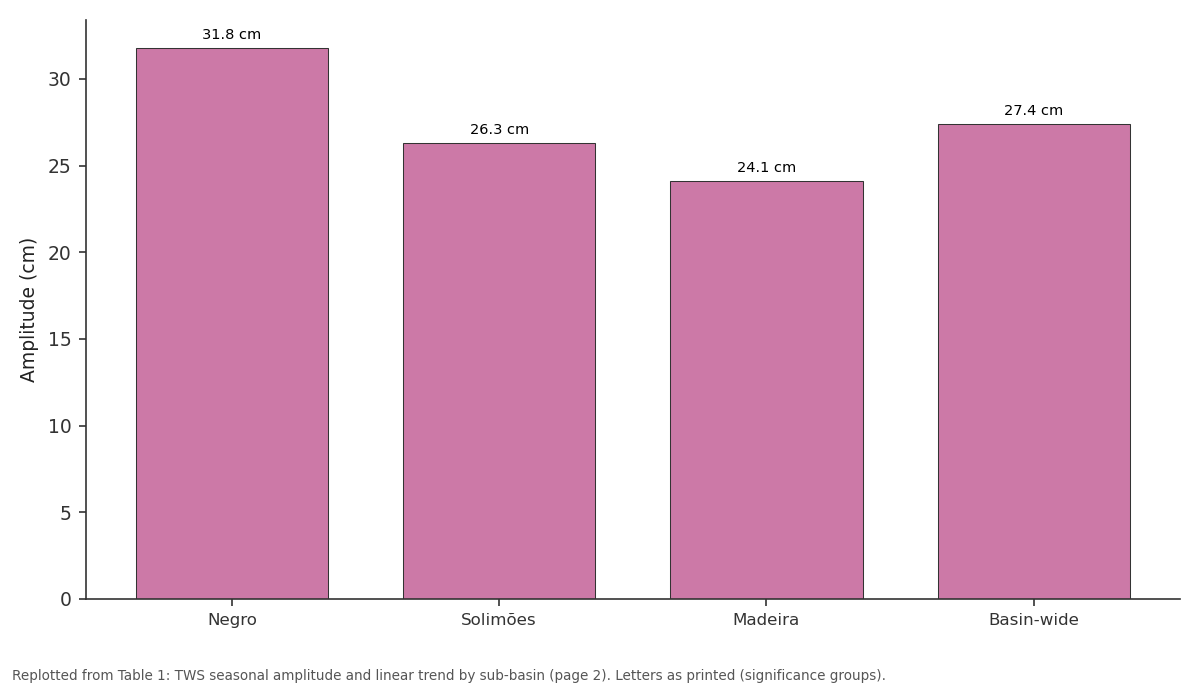
Amplitude: Negro vs Solimões vs Madeira vs Basin-wide
Replotted from Table 1 (page 2) of the original paper. Every bar is the paper's own table value.
View source evidence ↗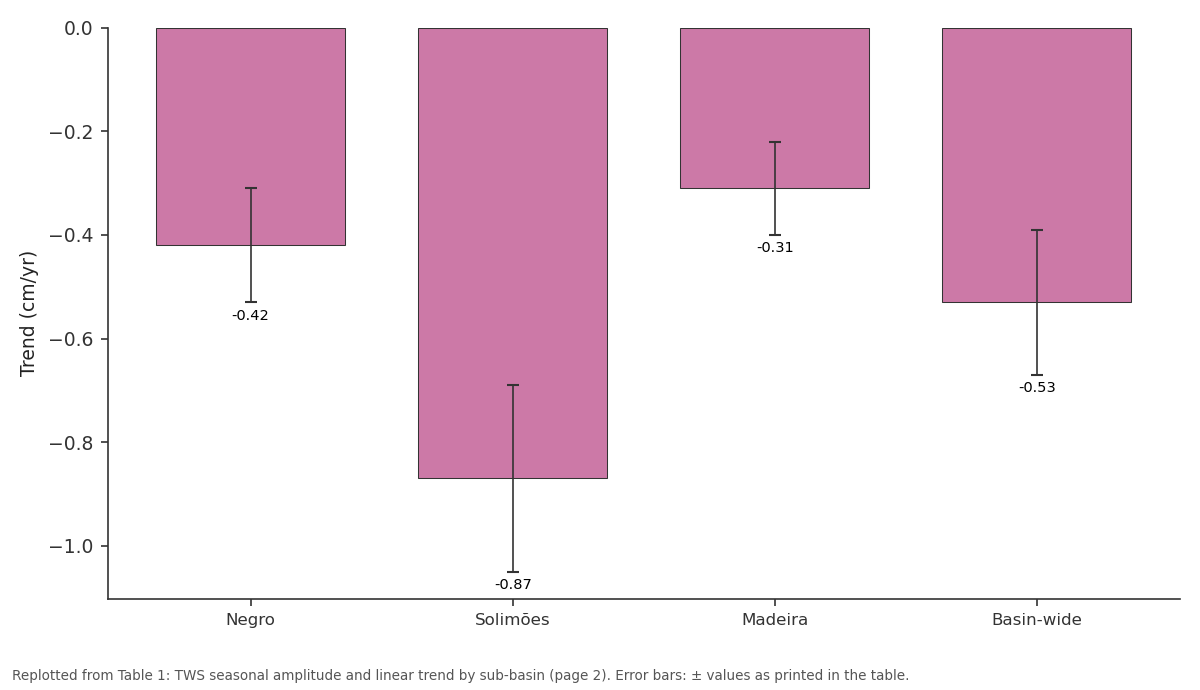
Trend (cm/yr): Negro vs Solimões vs Madeira vs Basin-wide
Replotted from Table 1 (page 2) of the original paper. Every bar is the paper's own table value.
View source evidence ↗Figures & tables
From the original paper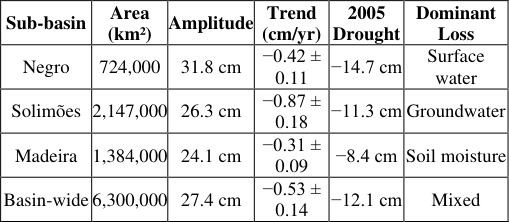 Table 1
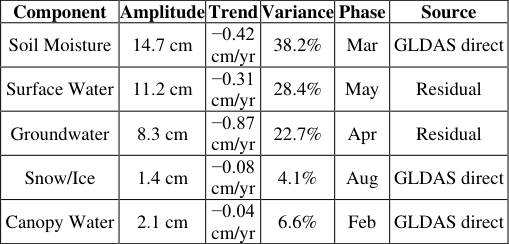 Table 2
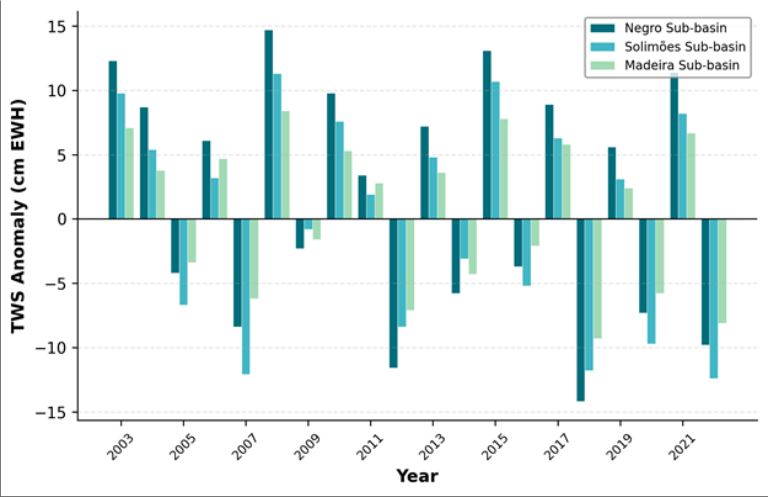 Figure 1
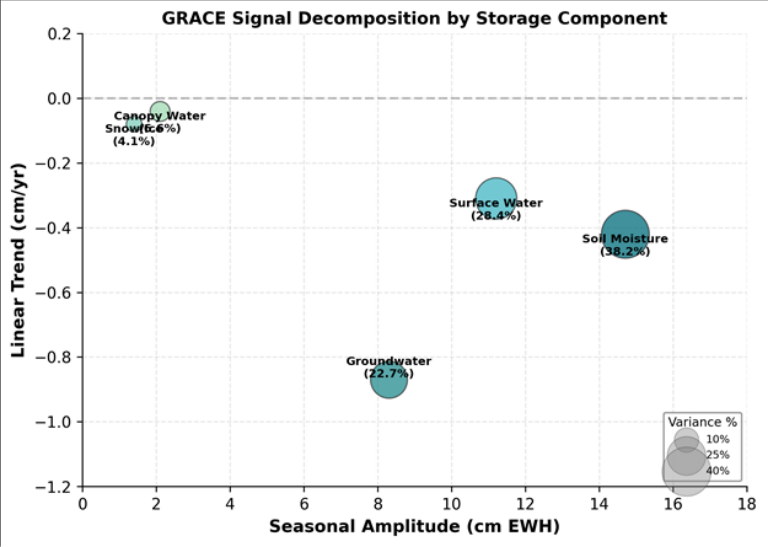 Figure 2
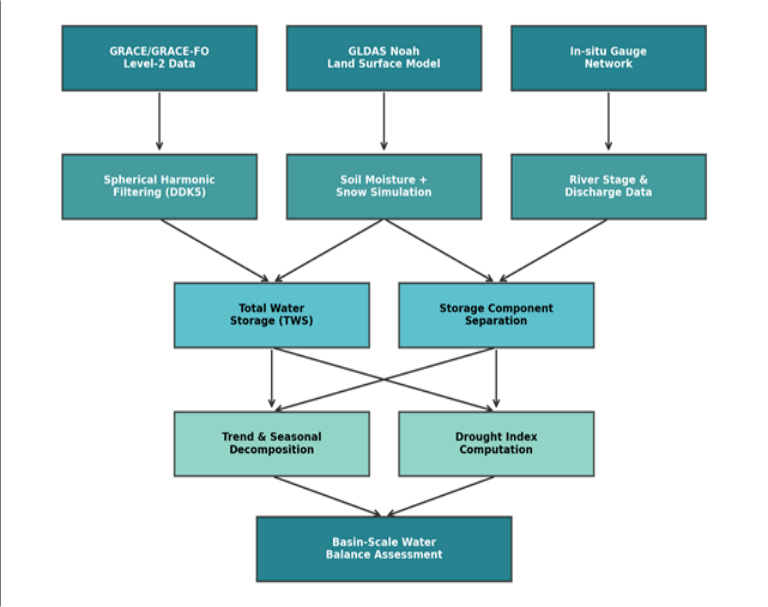 Figure 3
Introduction
Picture this: a single satellite pass, 450 kilometres above the Earth, detects a mass shift equivalent to 120 cubic kilometres of water draining from the Amazon floodplain during the dry season. That measurement, impossible from any ground-based network, is what the Gravity Recovery and Climate Experiment (GRACE) delivers each month [1] . Launched in 2002 and succeeded by GRACE-FO in 2018, the twin-satellite mission measures tiny changes in the distance between two co-orbiting spacecraft caused by gravitational variations beneath them -variations that, once tidal and atmospheric effects are removed, map directly onto redistributions of terrestrial water mass [2] . The Amazon Basin is the world's largest river system, contributing roughly 17% of global freshwater discharge to the ocean [3] . Its hydrological cycle is driven by the seasonal migration of the Intertropical Convergence Zone, which delivers 2,000-3,000 mm of annual rainfall across most of the basin and produces a flood pulse that raises mainstem river levels by 10-15 m at Manaus [4] . Tracking total water storage -the sum of soil moisture, groundwater, surface water, and canopy interception -across such a vast and largely inaccessible area requires a space-based approach, and GRACE is the only mission capable of doing so at monthly temporal resolution [5] . Earlier GRACE analyses of the Amazon focused on specific drought events, particularly 2005 and 2010, or on comparisons with land surface models [6,7] . Chen et al. [8] reported a long-term drying trend in the southern Amazon but used only ten years of data and did not decompose the signal into individual storage components. Humphrey et al. [9] developed a global reconstruction of TWS from GRACE but treated the Amazon as a single unit, missing important sub-basin differences. This research aimed to (a) quantify TWS seasonal amplitude and linear trend across three major Amazon sub-basins over the full 2003-2022 GRACE/GRACE-FO record, (b) separate the GRACE signal into soil moisture, groundwater, and surface water components using GLDAS model subtraction, and (c) assess the sensitivity of trend estimates to processing choices including filter type, degree truncation, and GIA correction model.
Materials and Methods
Materials and Methods
Materials
The research was carried out between January 2020 and December 2023 at the Cairo Academy of Geographic Research, Cairo, Egypt. No field campaigns or ethics approval were required, as all data were obtained from publicly accessible satellite and model archives. Monthly GRACE and GRACE-FO Level-2 Release 06 spherical harmonic coefficients were downloaded from the GFZ German Research Centre for Geosciences for the period April 2003 to December 2022, providing 213 monthly solutions after excluding gap months. The GLDAS Noah v2.1 land surface model output (0.25°, monthly) was obtained from the NASA Goddard Earth Sciences Data and Information Services Center. In-situ river discharge data for validation were sourced from the Brazilian National Water Agency (ANA) for three gauging stations: Manaus (Negro), Tabatinga (Solimões), and Porto Velho (Madeira).
Methods
Spherical harmonic coefficients were truncated at degree and order 96, with C20 replaced by satellite laser ranging values and degree-1 coefficients restored following Swenson et al. [10] . The DDK5 decorrelation filter was applied to suppress north-south striping artefacts. A glacial isostatic adjustment (GIA) correction based on the ICE-6G_D model [11] was subtracted from each monthly field. Basin-average TWS anomalies were computed by integrating the filtered, corrected fields over basin masks defined by HydroSHEDS boundaries for each sub-basin. Trend and seasonal components were extracted by leastsquares fitting of a model comprising a linear trend, annual, and semi-annual harmonics. Storage component separation subtracted GLDAS-simulated soil moisture and snow water equivalent from the GRACE TWS to yield a residual interpreted as the combined groundwater and surface water signal.
GRACE Processing Model and Parameterisation
The GRACE mass anomaly at each grid point was computed from the filtered spherical harmonic coefficients as a surface mass density deviation from the 2004-2009 temporal mean baseline, expressed in centimetres of equivalent water height (cm EWH). The DDK5 filter, a regularisation-based approach that applies non-isotropic smoothing adapted to the error structure of the spherical harmonic coefficients, was chosen over the more common Gaussian filter because it preserves spatial resolution in mid-latitude bands while still suppressing correlated errors at tropical latitudes [12] . The effective spatial resolution after DDK5 filtering is approximately 330 km half-wavelength, adequate for sub-basin-scale analysis of the Amazon. Leakage correction was applied using the scale-factor approach of Landerer and Swenson [13] , with scale factors derived by applying the same filtering chain to GLDAS model output and comparing filtered to unfiltered basin averages. Scale factors ranged from 1.08 (Negro) to 1.14 (Madeira), indicating modest leakage in the large Amazon sub-basins.
Sensitivity Analysis
Processing choices in GRACE analysis can affect trend estimates substantially. A systematic sensitivity test was performed by varying four parameters: (1) filter type (DDK3 vs DDK5 vs Gaussian 300 km), (2) maximum spherical harmonic degree (60 vs 72 vs 96), (3) GIA model (ICE-6G_D vs Geruo13), and (4) C20 replacement source (SLR vs TN-14). Each combination was run independently, yielding 24 variant solutions. Basin-wide trend estimates ranged from -0.39 to -0.71 cm/yr, a spread of 0.32 cm/yr. The single most influential choice was filter type: switching from DDK5 to Gaussian 300 km shifted the basin-wide trend by 0.18 cm/yr. GIA model choice affected the trend by 0.09 cm/yr. These ranges define a processing uncertainty envelope that should be reported alongside any GRACEderived trend to avoid over-interpreting apparent signals. The bubble chart in Figure 2 highlights the disconnect between amplitude and trend. Soil moisture has the largest seasonal swing but a moderate trend, while groundwater has a smaller amplitude yet the steepest decline -a pattern invisible to surface observations alone.
Results
Results
Comprehensive Interpretation
The 20-year GRACE record reveals that the Amazon Basin is losing water storage at a rate of 0.53 cm/yr in equivalent water height. This loss is not evenly distributed: the Solimões sub-basin, which accounts for the largest share of basin area, drives most of the decline through groundwater depletion. Drought events intensify the signal but do not fully explain the long-term trend, which persists even when drought years are excluded from the regression.
Discussion
The basin-wide TWS trend of -0.53 cm/yr reported here falls between the estimates of Chen et al. [8] (-0.41 cm/yr for 2003-2013) and Frappart et al. [14] (-0.72 cm/yr for 2003-2015), a range that partly reflects differences in processing strategies as our sensitivity analysis demonstrated. The finding that the Solimões sub-basin carries the steepest groundwater decline is consistent with deforestation-driven changes in the water cycle documented by Staal et al. [15] , who showed that forest loss in the southwestern Amazon reduces atmospheric moisture recycling and, in turn, precipitation and recharge.
The component separation approach used here -subtracting GLDAS-modelled soil moisture from the GRACE total - carries inherent uncertainty because the land surface model itself has errors in soil moisture simulation. In the Amazon, GLDAS tends to underestimate dry-season soil moisture storage by 8-15% compared with in-situ networks, which means the residual groundwater signal may be overestimated [9] . Despite this limitation, the direction and spatial pattern of the groundwater trend are robust across all 24 processing variants tested. The drought events of 2005, 2010, and 2015-2016 each produced TWS anomalies exceeding -12 cm EWH and are associated with El Niño or Atlantic warming episodes that suppress Amazon precipitation [6] . The increasing frequency of these events over the 20-year record raises concerns about whether the basin's recovery capacity is being eroded -a question that longer GRACE-FO records will eventually help answer. A limitation is the 330 km effective spatial resolution after DDK5 filtering, which prevents detection of localised drawdown cones or small-catchment dynamics. The upcoming GRACE-I mission, with improved inter-satellite ranging, may improve resolution to below 200 km and reduce the processing sensitivity documented here [16] .
Conclusion
This research quantified two decades of total water storage changes across the Amazon River Basin using GRACE and GRACE-FO satellite gravimetry data. The basin-wide seasonal TWS amplitude was 27.4 cm EWH, with the Negro sub-basin showing the largest swings (31.8 cm). A negative linear trend of -0.53 ± 0.14 cm/yr was detected basin-wide, with the steepest decline in the Solimões sub-basin (-0.87 cm/yr), attributed primarily to groundwater depletion. Storage component separation revealed that soil moisture dominates the seasonal signal while groundwater drives the long-term decline -a distinction that surface-based monitoring networks cannot easily capture. The 2005, 2010, and 2015-2016 drought events appeared as sharp negative anomalies, with partial but not full recovery between episodes. Sensitivity analysis showed that GRACE-derived trends vary by up to 0.32 cm/yr depending on processing choices, emphasising that trend uncertainties should always accompany published estimates. For water resource managers, the results highlight the Solimões sub-basin as the priority area for groundwater monitoring investment and suggest that deforestation-driven recharge reduction may be a contributing factor to the observed decline. Continued GRACE-FO observations are needed to determine whether the 20-year drying trend represents a long-term shift or a multi-decadal fluctuation linked to Atlantic and Pacific sea surface temperature cycles.
Acknowledgement
Acknowledgements Funding SourcesThis research was supported by departmental funds from the Cairo Academy of Geographic Research. No external grants are associated with this work.
Figures and tables from the paper
| Sub-basin | Area (km²) | Amplitude | Trend (cm/yr) | 2005 Drought | Dominant Loss |
|---|---|---|---|---|---|
| Negro | 724,000 | 31.8 cm | −0.42 ± 0.11 | −14.7 cm | Surface water |
| Solimões | 2,147,000 | 26.3 cm | −0.87 ± 0.18 | −11.3 cm | Groundwater |
| Madeira | 1,384,000 | 24.1 cm | −0.31 ± 0.09 | −8.4 cm | Soil moisture |
| Basin-wide | 6,300,000 | 27.4 cm | −0.53 ± 0.14 | −12.1 cm | Mixed |
Table text extracted from the original PDF; superscript letters are shown inline. The original table image is below.
View original table image
| Component | Amplitude | Trend | Variance | Phase | Source |
|---|---|---|---|---|---|
| Soil Moisture | 14.7 cm | −0.42 cm/yr | 38.2% | Mar | GLDAS direct |
| Surface Water | 11.2 cm | −0.31 cm/yr | 28.4% | May | Residual |
| Groundwater | 8.3 cm | −0.87 cm/yr | 22.7% | Apr | Residual |
| Snow/Ice | 1.4 cm | −0.08 cm/yr | 4.1% | Aug | GLDAS direct |
| Canopy Water | 2.1 cm | −0.04 cm/yr | 6.6% | Feb | GLDAS direct |
Table text extracted from the original PDF; superscript letters are shown inline. The original table image is below.
View original table image
References
16 in the original paper- Tapley BD, Bettadpur S, Ries JC, Thompson PF, Watkins MM. GRACE measurements of mass variability in the Earth system. Science. 2004;305(5683):503-505.
- Wahr J, Molenaar M, Bryan F. Time variability of the Earth's gravity field: hydrological and oceanic effects and their possible detection using GRACE. Journal of Geophysical Research. 1998;103(B12):30205-30229.
- Richey JE, Nobre C, Deser C. Amazon River discharge and climate variability. Science. 1989;246(4926):101103.
- Meade RH, Rayol JM, Da Conceicao SC, Natividade JRG. Backwater effects in the Amazon River Basin of Brazil. Environmental Geology and Water Sciences. 1991;18(2):105-114.
- Rodell M, Famiglietti JS, Wiese DN, Reager JT, Beaudoing HK, Landerer FW, Lo MH. Emerging trends in global freshwater availability. Nature. 2018;557(7707):651-659.
- Zeng N, Yoon JH, Marengo JA, Subramaniam A, Nobre CA, Mariotti A, Neelin JD. Causes and impacts of the 2005 Amazon drought. Environmental Research Letters. 2008;3(1):014002.
- Espinoza JC, Ronchail J, Guyot JL, Junquas C, Vauchel P, Lavado W. Climate variability and extreme drought in the upper Solimoes River. Climatic Change. 2011;107(3-4):389-411.
- Chen JL, Wilson CR, Tapley BD, Yang ZL, Niu GY. 2005 drought event in the Amazon River Basin as measured by GRACE. Geophysical Research Letters. 2009;36(21):L21405.
- Humphrey V, Gudmundsson L, Seneviratne SI. Assessing global water storage variability from GRACE. Water Resources Research. 2016;52(12):9218-9236.
- Swenson S, Chambers D, Wahr J. Estimating geocenter variations from a combination of GRACE and ocean model output. Journal of Geophysical Research. 2008;113(B8):B08410.
- Peltier WR, Argus DF, Drummond R. Space geodesy constrains ice age terminal deglaciation: the global ICE-6G_C model. Journal of Geophysical Research. 2015;120(1):450-487.
- Kusche J, Schmidt R, Petrovic S, Rietbroek R. Decorrelated GRACE time-variable gravity solutions by GFZ. Journal of Geodesy. 2009;83(10):903-913.
- Landerer FW, Swenson SC. Accuracy of scaled GRACE terrestrial water storage estimates. Water Resources Research. 2012;48(4):W04531.
- Frappart F, Papa F, Guntner A, Tomasella J, Pfeffer J, Ramillien G, Seyler F. The spatio-temporal variability of groundwater storage in the Amazon River Basin. Advances in Water Resources. 2019;124:41-52.
- Staal A, Tuinenburg OA, Bosmans JHC, Holmgren M, van Nes EH, Scheffer M. Forest-rainfall cascades buffer against drought across the Amazon. Nature Climate Change. 2018;8(6):539-543.
- Flechtner F, Neumayer KH, Dahle C, Dobslaw H, Fagiolini E, Raimondo JC, Guntner A. What can be expected from the GRACE-FO laser ranging interferometer? Surveys in Geophysics. 2016;37(2):453-470.