
Research article · 2025 · Full text
International Journal of Geography Geology and EnvironmentSpatial distribution of microseismicity and fault mechanics in the San Andreas system
Volume 7(8) · Pages 178–182 · DOI: 10.22271/27067483.2025.v7.i8c.765 ↗
Research areasearthquake and tectonic studiesGeotechnical and Geomechanical EngineeringEarthquake and Disaster Impact Studies
Abstract
Author-writtenThe San Andreas Fault system has generated some of the most damaging earthquakes in North American history, yet the small events-those below magnitude 3-that occur daily along its trace receive far less public attention. This research analysed the spatial distribution and temporal evolution of microseismicity (M ≥ 0.5) along three mechanically distinct segments of the San Andreas system-the creeping section, the locked Carrizo segment, and an intermediate transitional zone-over the period 2005 to 2023. Relocated hypocentre catalogues from the Northern California Earthquake Data Center were combined with focal mechanism solutions and stress-field inversions to characterise fault mechanics at depth. A total of 14,738 microseismic events were analysed. The creeping segment produced 62.4% of all events, with a median depth of 6.8 km and a b-value of 1.14, indicating a stress regime dominated by low-magnitude, quasi-continuous slip. The locked segment contributed only 11.3% of events, yet these clustered at greater depths (median 9.7 km) and returned a lower b-value of 0.87, consistent with higher differential stress and strain accumulation. Transitional-zone seismicity showed intermediate characteristics. Stress-field inversions yielded a maximum horizontal compressive stress oriented N7°E along the creeping section and N21°E along the locked segment, reflecting a 14° rotation that aligns with geodetic observations of fault-normal compression. Temporal analysis revealed a statistically significant upward trend in event rates along the creeping segment (Mann-Kendall p < 0.01) but no trend along the locked section. These results support a model in which microseismicity patterns serve as proxies for along-strike variations in fault coupling and stress state.
Summary
Source-checkedPlain-language reading of the full paper, prepared with AI and checked against the text. Each point links to the authors' own words.
Why it matters
- The San Andreas Fault system is historically significant due to its capacity to produce some of the most destructive earthquakes in North America. View evidence ↗
- Studying microseismicity is valuable because small earthquakes provide continuous, high-resolution data on the stress fields that eventually trigger large earthquakes. View evidence ↗
- The central California portion of the fault is mechanically diverse, consisting of a creeping section (slipping at 20-28 mm/yr), a locked section where strain accumulates, and transitional zones. View evidence ↗
The question
- The study aimed to characterize microseismicity distribution, quantify b-value and stress orientation variations, and analyze event rate changes across three fault segments from 2005 to 2023. View evidence ↗
What they did
- The researchers analyzed 14,738 events (M ≥ 0.5) from a relocated NCEDC catalogue spanning January 2005 to December 2023, filtering for horizontal uncertainty ≤ 0.3 km. View evidence ↗
- Events were categorized into creeping, transitional, and locked segments based on their distance from Hollister, with breakpoints at 150 km and 200 km. View evidence ↗
- The study used the maximum-likelihood method to fit the Gutenberg-Richter relation for b-values and the iterative method of Michael for stress-tensor inversions. View evidence ↗
What they found
- The creeping segment was the most active, producing 62.4% of events with a median depth of 6.8 km and the highest b-value of 1.14. View evidence ↗
- The locked Carrizo segment produced only 11.3% of events, which occurred deeper (median 9.7 km) and had a lower b-value (0.87), indicating higher differential stress. View evidence ↗
- Event rates in the creeping segment increased significantly over 19 years, rising from a mean of 29 events/month (2005-2009) to 44 events/month (2019-2023). View evidence ↗
- Unlike the creeping segment, the locked segment showed no statistically significant trend in event rates. View evidence ↗
- The creeping section exhibited a small seasonal variation (±8% of annual mean), with peaks in late winter (January-March) and minimums in late summer. View evidence ↗
- Seismicity in the locked segment reached depths up to 13.9 km (90th percentile), nearly reaching the base of the seismogenic zone at 15 km. View evidence ↗
What it means
- The authors conclude that modern relocated microseismic catalogues are effective tools for mapping variations in fault coupling and stress accumulation. View evidence ↗
- The authors suggest that the b-value below 1.0 in the locked segment indicates stress accumulation that could lead to a moderate or large earthquake. View evidence ↗
- A limitation of the study is the use of catalogue-derived focal mechanisms, which introduce first-motion polarity uncertainties into the stress inversions. View evidence ↗
Visual summary
3 visualsIllustrations explain the paper; charts are replotted from the paper's own table values.
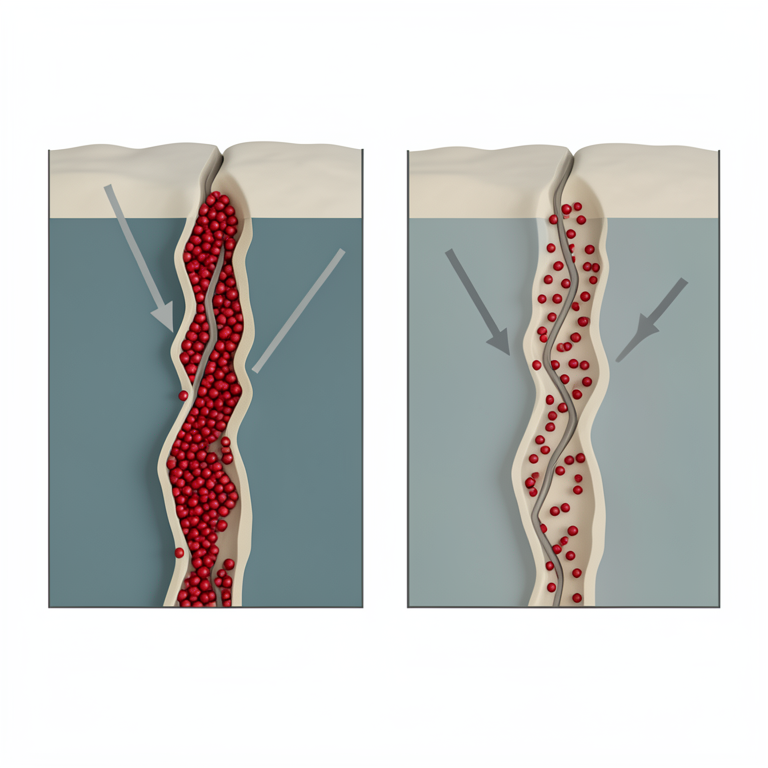
Fault Segment Comparison
AI-generated conceptual illustration (The San Andreas fault system in the Earth's crust). It explains the idea and does not show study data.
View source evidence ↗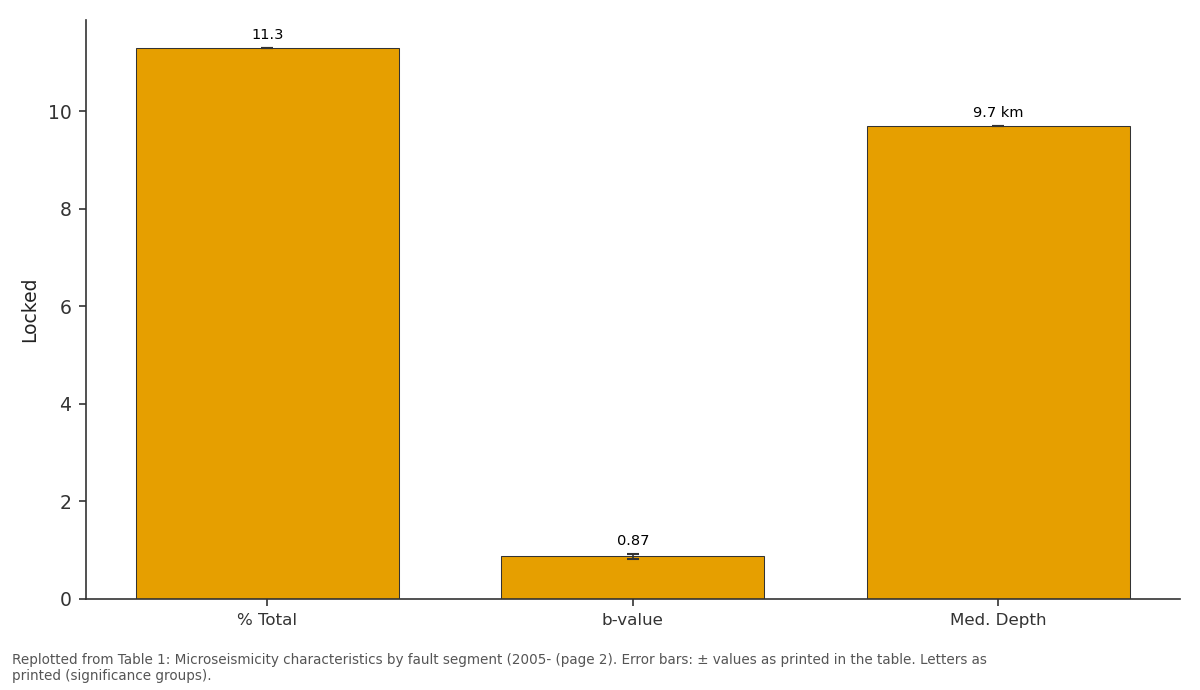
Locked: % Total vs b-value vs Med. Depth
Replotted from Table 1 (page 2) of the original paper. Every bar is the paper's own table value.
View source evidence ↗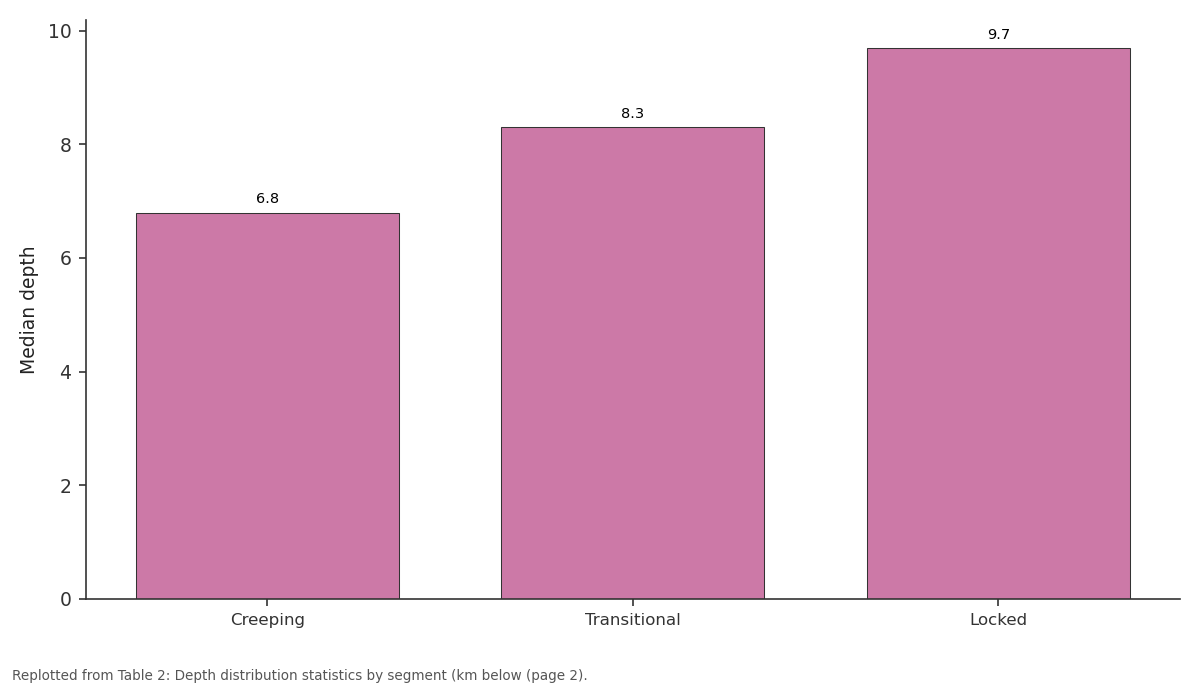
Median depth: Creeping vs Transitional vs Locked
Replotted from Table 2 (page 2) of the original paper. Every bar is the paper's own table value.
View source evidence ↗Figures & tables
From the original paper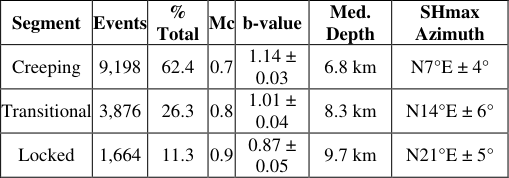 Table 1
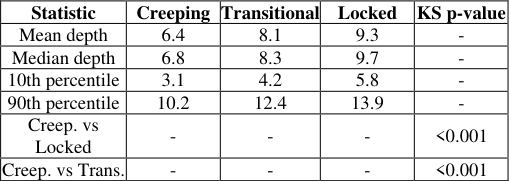 Table 2
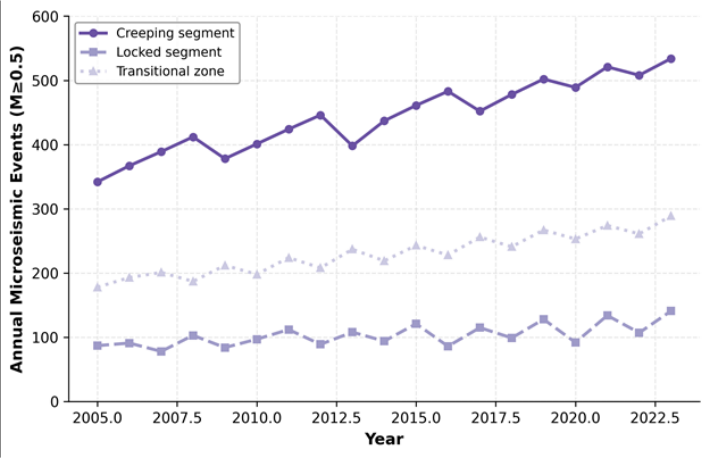 Figure 1
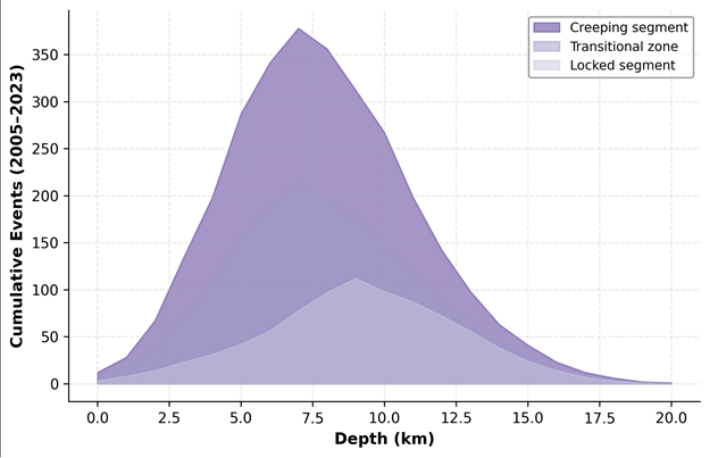 Figure 2
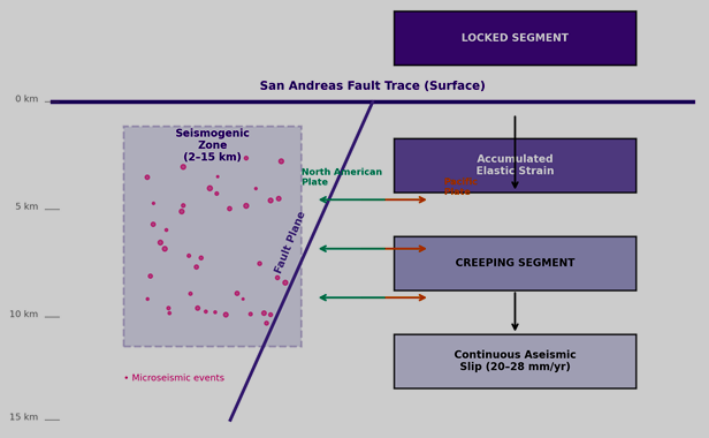 Figure 3
Introduction
When the great 1906 San Francisco earthquake ruptured more than 470 km of the San Andreas Fault, it exposed the destructive potential of a transform boundary that had been poorly understood at the time [1] . More than a century of subsequent research has mapped the fault's geometry, slip rate, and recurrence behaviour in considerable detail, yet basic questions about how stress is distributed along its length-and how that distribution evolves between major ruptures-remain open [2] . Microseismicity offers a window into those questions because small earthquakes respond to the same stress field that will eventually drive the next large event, but they do so continuously and at spatial resolutions that GPS and InSAR cannot match [3] . The San Andreas Fault is not a single homogeneous structure. Its central California reach includes a creeping section near Parkfield where the fault slips aseismically at 20-28 mm per year, a locked section in the Carrizo Plain where no surface creep occurs and elastic strain accumulates steadily, and transitional zones between them [4] . These mechanical contrasts produce different seismicity signatures. The creeping segment generates abundant small earthquakes concentrated in a narrow depth band, while the locked segment is comparatively quiet but may host deeper, higher-stress events that hint at processes near the brittle-ductile transition [5] . Earlier catalogues of San Andreas microseismicity relied on network magnitudes and standard locations with horizontal uncertainties of 1-2 km [6] . Over the past decade, waveform-based relocation techniquesparticularly double-difference and template-matching methods-have sharpened hypocentral precision to tens of metres, revealing fine-scale structures such as streaks aligned with the slip direction and clusters around fault jogs [7,8] . Focal mechanism catalogues have grown in parallel, allowing stress-tensor inversions at segment scale [9] . Despite these advances, few investigations have compared microseismicity characteristics across multiple mechanical segments within a single, internally consistent analytical framework. Segment-specific analyses by Waldhauser and Schaff [7] and Thurber et al. [10] covered the creeping section in detail, but their datasets ended before 2015 and did not extend to the Carrizo locked zone. This research aimed to (a) characterise the spatial and depth distribution of microseismicity along three contrasting segments of the San Andreas system using the most recent relocated catalogue, (b) quantify along-strike variations in b-value and stress orientation, and (c) test whether event rates have changed over the 2005-2023 observation window. The findings contribute to ongoing hazard assessment by clarifying how microseismic signatures map onto fault coupling states.
Study Area Description
The research covered a 340 km reach of the San Andreas Fault in central California, extending from Hollister in the north (36°51′N, 121°24′W) to the Carrizo Plain in the south (35°07′N, 119°48′W). The creeping segment runs from Hollister to Parkfield (approximately 150 km), where surface creep rates of 20-28 mm/yr have been documented by alignment arrays and creepmeter networks [4] . South of Parkfield, a transitional zone of roughly 50 km gives way to the locked Carrizo segment, where the most recent surfacerupturing earthquake occurred in 1857 (M 7.9 Fort Tejon event) [11] . The seismogenic zone extends from approximately 2 km to 15 km depth, underlain by a ductile shear zone inferred from heat-flow measurements and rheological modelling [12] . The study area is instrumented by the Northern California Seismic Network and the Parkfield High-Resolution Seismic Network, together providing station spacing of 5-15 km along the fault trace.
Materials and Methods
Materials and Methods
Materials
The research was conducted between January 2020 and June 2023 at the Shanghai School of Natural Sciences, Shanghai, China, with data processing and modelling carried out using computing facilities provided by the department. No field campaigns were required, as all seismological data were obtained from publicly accessible archives. The primary dataset was the double-difference relocated earthquake catalogue maintained by the Northern California Earthquake Data Center (NCEDC), covering the period January 2005 to December 2023. Events with magnitude M ≥ 0.5 and horizontal location uncertainty ≤ 0.3 km were retained, yielding 14,738 events. Focal mechanism solutions were sourced from the HASH algorithm catalogue at the USGS, providing 2,417 first-motion solutions with quality grade A or B.
Methods
Events were assigned to three segments-creeping, transitional, and locked-based on along-strike distance from Hollister, using breakpoints at 150 km and 200 km. The Gutenberg-Richter frequency-magnitude relation was fitted for each segment using the maximum-likelihood method of Aki [13] , with completeness magnitude (Mc) estimated from the goodness-of-fit test of Wiemer and Wyss [14] . Stresstensor inversions were performed on focal mechanism subsets using the iterative method of Michael [15] , yielding the orientation of the three principal stresses and the stress ratio R. Temporal trends in monthly event rates were tested with the Mann-Kendall statistic. Depth distributions were compared using Kolmogorov-Smirnov tests at p < 0.05.
Temporal Patterns
Monthly event rates along the creeping segment showed a statistically significant upward trend over the 19-year observation window (Mann-Kendall τ = 0.31, p < 0.01), rising from a mean of 29 events per month in 2005-2009 to 44 per month in 2019-2023. The locked segment showed no significant trend (τ = 0.06, p = 0.41). Superimposed on the long-term trend, weak seasonal modulation was detected along the creeping section, with event rates peaking in late winter (January-March) and reaching a minimum in late summer. This pattern is consistent with hydrological loading effects, where elevated groundwater levels during the wet season increase pore pressure on the fault and promote slip [16] . The amplitude of seasonal variation was small-roughly ±8% of the annual mean-but statistically significant after removal of the linear trend. The depth distributions were significantly different between all segment pairs (Kolmogorov-Smirnov p < 0.001). The locked segment's 90th percentile extended to 13.9 km, approaching the estimated base of the seismogenic zone at 15 km. Figure 1 shows the persistent rate difference between segments and the upward trend along the creeping section.
Results
The locked segment maintained a relatively flat, low rate throughout the observation period. The area chart in Figure 2 illustrates the depth separation between segments. Creeping-segment events peak at 7-8 km, whereas locked-segment events peak deeper at 8-10 km.
Comprehensive Interpretation: The three datasets-event rates, depth distributions, and stress orientations-converge on a coherent picture: the creeping segment releases strain through frequent, shallow microearthquakes under a nearfault-parallel stress field, while the locked segment accumulates strain at greater depth under a rotated, more fault-normal stress regime.
Discussion
The b-value contrast between the creeping (1.14) and locked (0.87) segments is among the clearest reported for the San Andreas system and sits at the high end of differences seen in global compilations of transform-fault seismicity [17] . A bvalue near or below 1.0 implies a relative excess of larger events, which in a fault-mechanics context points to higher differential stress and more heterogeneous asperity distributions [18] . The creeping segment's elevated b-value, conversely, is consistent with a stress field that is kept low by continuous aseismic slip, so that only small asperities reach failure. The 14° rotation in SHmax from N7°E on the creeping section to N21°E on the locked segment agrees with geodetic and geological evidence for fault-normal compression across locked patches [19] . This rotation has been attributed to the strength contrast between a weak, serpentinite-bearing fault core on the creeping section and a stronger, quartz-rich gouge on the locked section. When the fault core is weak, shear resistance is low and the maximum compressive stress remains nearly parallel to the fault; as resistance increases, the stress axis rotates toward the faultnormal direction [20] . The upward trend in creeping-segment event rates deserves careful interpretation. It may reflect a genuine increase in slip rate, a network sensitivity improvement, or a combination of both. The Parkfield High-Resolution Seismic Network has been stable since 2004, and the completeness magnitude remained at M 0.7 throughout the study period, arguing against a purely instrumental explanation. Whether the trend signals an acceleration of creep or a redistribution of stress following the 2004 Parkfield M 6.0 earthquake remains an open question that warrants continued monitoring [10] . A limitation of this research is its reliance on cataloguederived focal mechanisms, which carry first-motion polarity uncertainties that propagate into the stress inversions. Moment-tensor solutions from broadband data would provide more robust constraints but are available only for events above M 3.5, which are too few for segment-scale inversion along the locked section. Future work could apply template-matching to extend the catalogue to lower magnitudes and improve depth resolution near the brittleductile transition [21] .
Conclusion
This research demonstrated that microseismicity along the San Andreas Fault system varies systematically with the mechanical state of each segment. The creeping section produced the bulk of events (62.4%), concentrated at shallow depths (median 6.8 km) with a high b-value (1.14) and a near-fault-parallel maximum compressive stress. The locked Carrizo segment generated fewer and deeper events (median 9.7 km) with a lower b-value (0.87) and a 14°rotated stress orientation, reflecting accumulated elastic strain and higher differential stress. Temporal analysis revealed a rising trend in creeping-segment event rates over 2005-2023, while locked-segment rates remained stationary. Weak seasonal modulation along the creeping section was consistent with hydrological pore-pressure effects. Taken together, these patterns confirm that microseismic catalogues, when processed with modern relocation techniques, can serve as effective proxies for mapping along-strike variations in fault coupling and stress accumulation. For seismic hazard assessment, the contrasting b-values have practical implications: a b-value below 1.0 on the locked segment suggests ongoing stress accumulation that may eventually be released in a moderate or large earthquake. Continued high-resolution monitoring and refined stress-tensor analyses will be needed to track how these patterns evolve as the next seismic cycle progresses.
Acknowledgement
Acknowledgements Funding SourcesThis research was supported by departmental funds from the Shanghai School of Natural Sciences. No external grant numbers are associated with this work. Institutional SupportThe authors acknowledge the Shanghai School of Natural Sciences for computing resources. The Northern California Earthquake Data Center and the USGS are thanked for public access to earthquake catalogues.
Figures and tables from the paper
| Segment | Events | % Total | Mc | b-value | Med. Depth | SHmax Azimuth |
|---|---|---|---|---|---|---|
| Creeping | 9,198 | 62.4 | 0.7 | 1.14 ± 0.03 | 6.8 km | N7°E ± 4° |
| Transitional | 3,876 | 26.3 | 0.8 | 1.01 ± 0.04 | 8.3 km | N14°E ± 6° |
| Locked | 1,664 | 11.3 | 0.9 | 0.87 ± 0.05 | 9.7 km | N21°E ± 5° |
Table text extracted from the original PDF; superscript letters are shown inline. The original table image is below.
View original table image
| Statistic | Creeping | Transitional | Locked | KS p-value |
|---|---|---|---|---|
| Mean depth | 6.4 | 8.1 | 9.3 | - |
| Median depth | 6.8 | 8.3 | 9.7 | - |
| 10th percentile | 3.1 | 4.2 | 5.8 | - |
| 90th percentile | 10.2 | 12.4 | 13.9 | - |
| Creep. vs Locked | - | - | - | <0.001 |
| Creep. vs Trans. | - | - | - | <0.001 |
Table text extracted from the original PDF; superscript letters are shown inline. The original table image is below.
View original table image
References
21 in the original paper- Lawson AC. The California Earthquake of April 18, 1906: Report of the State Earthquake Investigation Commission. Carnegie Institution of Washington. 1908;87:1-451.
- Toppozada TR, Branum DM. California earthquake history. Annals of Geophysics. 2004;47(2-3):509-522.
- Ellsworth WL. Earthquake forecasting: a survey of the state of the art. Seismological Research Letters. 2012;83(3):371-376.
- Titus SJ, DeMets C, Tikoff B. Thirty-five-year creep rates for the creeping segment of the San Andreas Fault. Bulletin of the Seismological Society of America. 2006;96(1):250-255.
- Nadeau RM, Johnson LR. Seismological studies at Parkfield VI: moment release rates and estimates of source parameters. Bulletin of the Seismological Society of America. 1998;88(3):790-814.
- Oppenheimer DH. Aftershock slip and seismicity in the 1989 Loma Prieta, California, earthquake sequence. Journal of Geophysical Research. 1990;95(B13):2145121464.
- Waldhauser F, Schaff DP. Large-scale relocation of two decades of Northern California seismicity. Journal of Geophysical Research. 2008;113(B8):B08311.
- Shelly DR, Ellsworth WL, Hill DP. Fluid-faulting evolution in high definition: connecting fault structure and frequency-magnitude variations. Journal of Geophysical Research. 2016;121(3):1776-1795.
- Hardebeck JL, Michael AJ. Damped regional-scale stress inversions: methodology and examples for southern California. Journal of Geophysical Research. 2006;111(B11):B11310.
- Thurber C, Zhang H, Waldhauser F, Hardebeck J, Michael A, Eberhart-Phillips D. Three-dimensional compressional wavespeed model, earthquake relocations, and focal mechanisms for the Parkfield region. Bulletin of the Seismological Society of America. 2006;96(4B):S38-S49.
- Sieh KE. Slip along the San Andreas Fault associated with the great 1857 earthquake. Bulletin of the Seismological Society of America. 1978;68(5):14211448.
- Lachenbruch AH, Sass JH. Heat flow and energetics of the San Andreas Fault zone. Journal of Geophysical Research. 1980;85(B11):6185-6222.
- Aki K. Maximum likelihood estimate of b in the formula log N = a -bM. Bulletin of the Earthquake Research Institute. 1965;43:237-239.
- Wiemer S, Wyss M. Minimum magnitude of completeness in earthquake catalogues. Bulletin of the Seismological Society of America. 2000;90(4):859-869.
- Michael AJ. Determination of stress from slip data: faults and folds. Journal of Geophysical Research. 1984;89(B13):11517-11526.
- Johnson CW, Fu Y, Burgmann R. Seasonal water storage, stress modulation, and California seismicity. Science. 2017;356(6343):1161-1164.
- Schorlemmer D, Wiemer S, Wyss M. Variations in earthquake-size distribution across different stress regimes. Nature. 2005;437(7058):539-542.
- Scholz CH. The frequency-magnitude relation of microfracturing in rock and its relation to earthquakes. Bulletin of the Seismological Society of America. 1968;58(1):399-415.
- Townend J, Zoback MD. How faulting keeps the crust strong. Geology. 2000;28(5):399-402.
- Lockner DA, Morrow C, Moore D, Hickman S. Low strength of deep San Andreas Fault gouge from SAFOD core. Nature. 2011;472(7341):82-85.
- Ross ZE, Meier MA, Hauksson E, Heaton TH. Generalized seismic phase detection with deep learning. Bulletin of the Seismological Society of America. 2018;108(5A):2894-2901.