
Research article · 2026 · Full text
International Journal of Geography Geology and EnvironmentWetland habitat characterization and its influence on sarus crane (grus antigone) population distribution around alwara lake, kaushambi, India
Volume 8(1) · Pages 72–76 · DOI: 10.22271/27067483.2026.v8.i1a.775 ↗
Research areasAvian ecology and behaviorWetland Management and ConservationWildlife Ecology and Conservation
Abstract
Author-writtenWetland habitat quality exerts a direct influence on the spatial distribution and abundance of wading birds, yet habitat characterization data remain limited for many small-to-medium wetlands across the Indo-Gangetic floodplain. This research characterized the physical, chemical, and vegetative attributes of five distinct habitat zones around Alwara Lake, Kaushambi district, India, and assessed their correlation with Sarus Crane (Grus antigone) population distribution over a 12-month survey period (April 2022 to March 2023). Habitat parameters measured included water depth, turbidity, dissolved oxygen, vegetation cover percentage, soil moisture, and land-use type. Crane sightings were mapped across habitat types using GPS-referenced point counts. A total of 237 crane sightings were recorded, with shallow marshes (water depth 0.3-0.8 m) accounting for 28.7% of all observations, followed by reed beds (23.2%) and paddy field edges (17.7%). Deep open water (>1.5 m) attracted only 5.1% of sightings. Habitat suitability index analysis identified vegetation cover (β = 0.41), water depth (β = 0.38), and soil moisture (β = 0.29) as the three strongest predictors of crane presence. Satellite-derived land-use maps confirmed that 62% of suitable crane habitat fell outside any formal protection boundary, underscoring the need for landscape-level conservation strategies that extend beyond the lake itself.
Summary
Source-checkedPlain-language reading of the full paper, prepared with AI and checked against the text. Each point links to the authors' own words.
Why it matters
- India's inland wetlands are rapidly disappearing, with an estimated 30% loss of natural wetland area between 1970 and 2015 due to urbanization, siltation, and agricultural conversion. View evidence ↗
- Habitat loss for wetland-obligate species like the Sarus Crane not only reduces space but degrades the quality of remaining areas by altering water clarity, vegetation, and basin depth. View evidence ↗
- Systematic habitat characterization is necessary because without knowing the specific attributes that attract or repel Sarus Cranes, conservation efforts may be misdirected. View evidence ↗
The question
- The study aimed to systematically examine the spatial heterogeneity of habitat conditions around Alwara Lake and determine how this variation relates to the distribution of Sarus Cranes. View evidence ↗
What they did
- Fieldwork was conducted from April 2022 to March 2023 within a 4 km radius of Alwara Lake in India. View evidence ↗
- The researchers delineated five distinct habitat zones based on physiography and land cover, including reed-dominated shores, agricultural edges, shallow marshes, deep open water, and central islands. View evidence ↗
- The study measured several habitat parameters, including soil moisture, vegetation cover percentage, dissolved oxygen, turbidity, and water depth. View evidence ↗
- Crane population distribution was assessed using monthly point-count surveys at 15 observation stations during specific morning and evening windows. View evidence ↗
What they found
- Out of 237 total crane sightings, the highest proportions were found in shallow marshes (28.7% with depths of 0.3-0.8 m), reed beds (23.2%), and paddy field edges (17.7%). View evidence ↗
- Deep open water areas with depths greater than 1.5 m were the least attractive, accounting for only 5.1% of crane sightings. View evidence ↗
- The strongest predictors of Sarus Crane presence were vegetation cover (β = 0.41), water depth (β = 0.38), and soil moisture (β = 0.29). View evidence ↗
- Sarus Cranes avoided water depths exceeding approximately 1.0 m, which aligns with their physical leg length of roughly 0.9 m. View evidence ↗
- Satellite mapping revealed that 62% of the habitat suitable for cranes is located outside of formal protection boundaries. View evidence ↗
- The developed habitat suitability model was able to explain 81% of the variance in crane presence across the landscape. View evidence ↗
What it means
- The authors conclude there is an urgent need for landscape-level planning that involves agricultural communities and private landowners, as most suitable habitat is unprotected. View evidence ↗
- The authors recommend immediate management of reed beds and shallow marshes with Habitat Suitability Index (HSI) scores above 0.6, specifically through vegetation restoration and water-level regulation. View evidence ↗
- The authors suggest that repeating the habitat characterization every three to five years is necessary to track trends and adjust management interventions. View evidence ↗
Visual summary
3 visualsIllustrations explain the paper; charts are replotted from the paper's own table values.
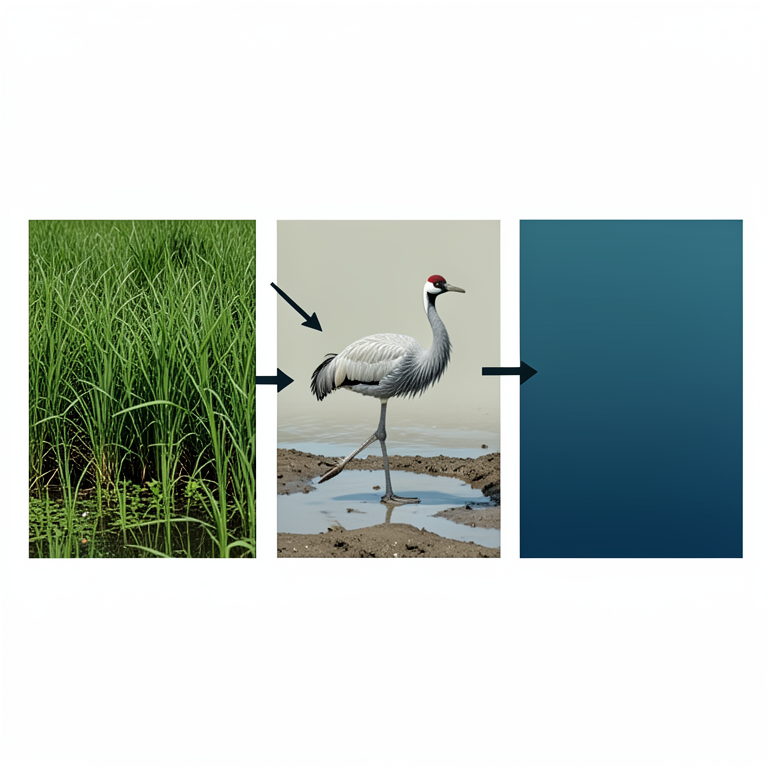
Predictors of Crane Presence
AI-generated conceptual illustration (Sarus crane (Grus antigone) in a wetland habitat). It explains the idea and does not show study data.
View source evidence ↗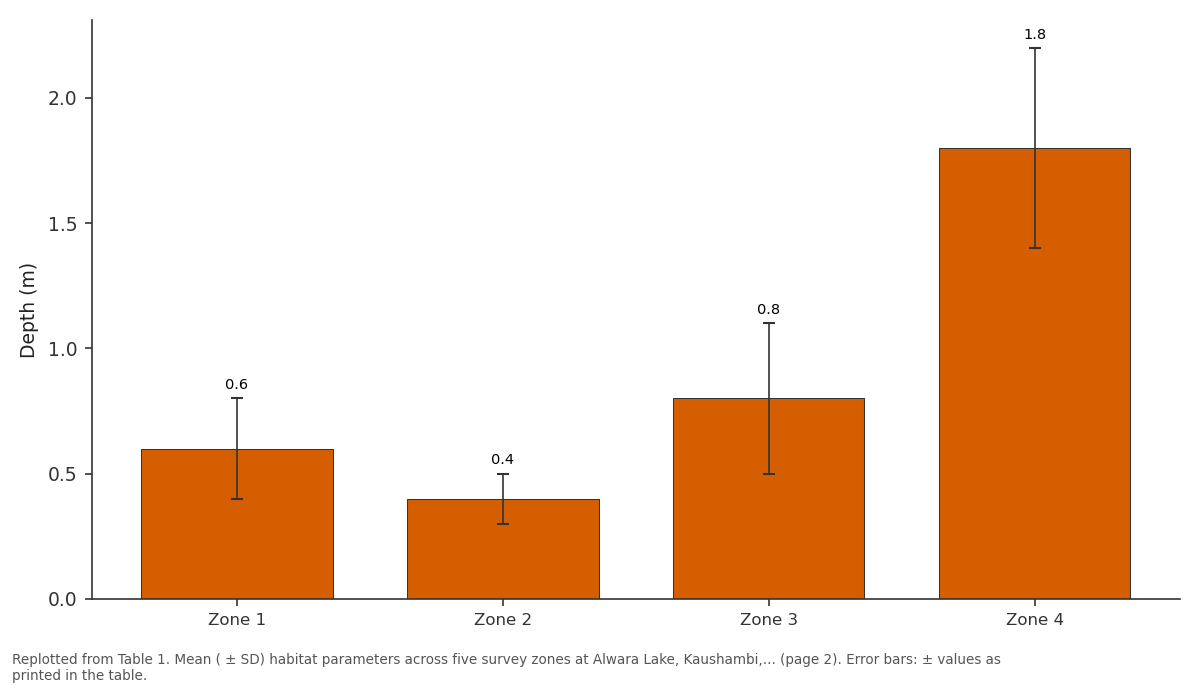
Depth (m): Zone 1 vs Zone 2 vs Zone 3 vs Zone 4
Replotted from Table 1 (page 2) of the original paper. Every bar is the paper's own table value.
View source evidence ↗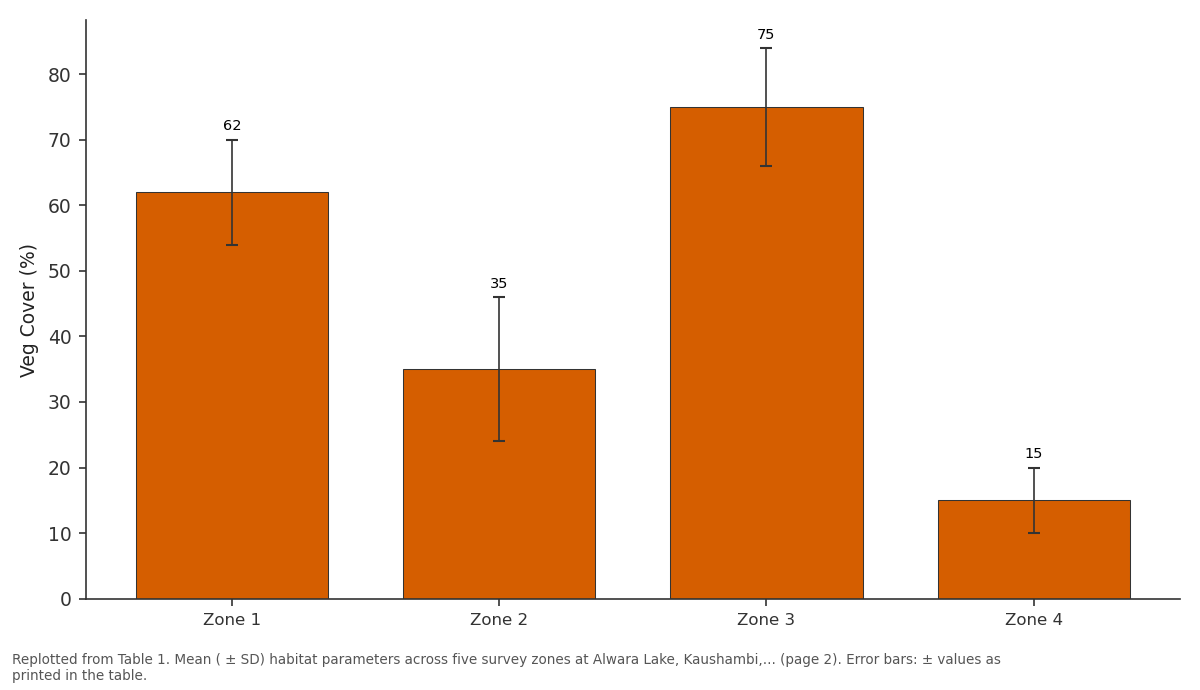
Veg Cover (%): Zone 1 vs Zone 2 vs Zone 3 vs Zone 4
Replotted from Table 1 (page 2) of the original paper. Every bar is the paper's own table value.
View source evidence ↗Figures & tables
From the original paper Table 1
 Table 2
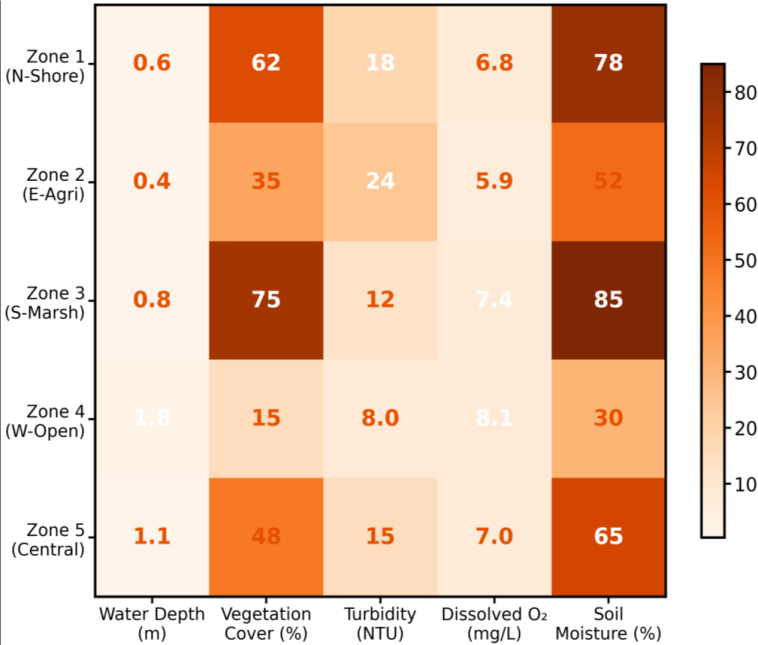 Figure 1
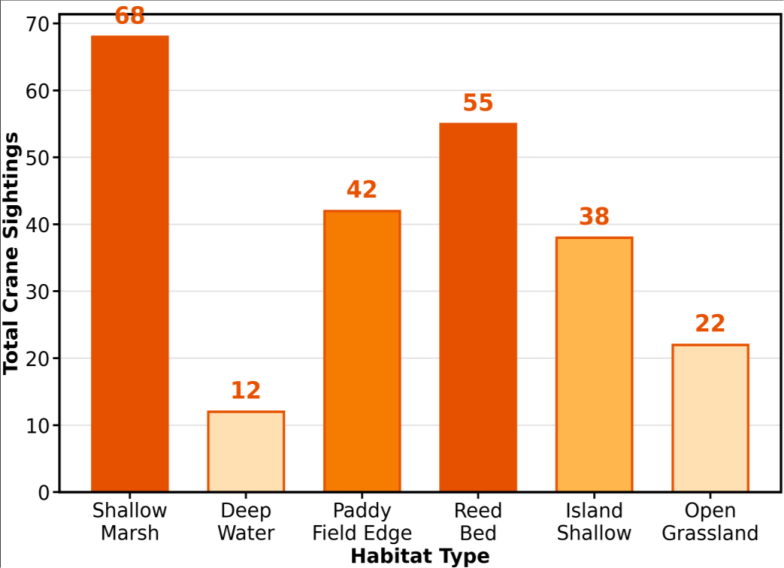 Figure 2
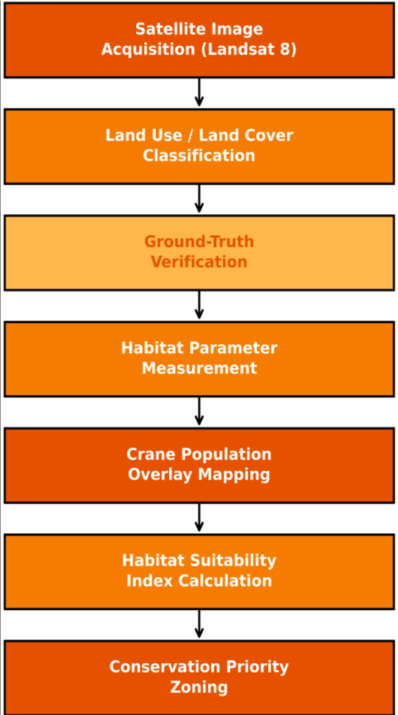 Figure 3
Introduction
The problem is straightforward but severe: India's inland wetlands are disappearing faster than the species that depend on them can adapt. Between 1970 and 2015, the country lost an estimated 30% of its natural wetland area to agricultural conversion, urbanization, and siltation [1] . For wetland-obligate species like the Sarus Crane, this habitat contraction doesn't merely reduce available space it alters the quality of what remains, often degrading water clarity, eliminating emergent vegetation, and deepening or shallowing basins beyond the species' preferred foraging depth [2,3] . Habitat characterization the systematic measurement and mapping of environmental parameters that define a species' living space provides the empirical foundation for conservation planning. Without knowing which specific attributes of a wetland attract or repel Sarus Cranes, management interventions risk being misdirected [4] . A lake might be large enough to support cranes on paper, but if its water depth exceeds the species' wading capacity (approximately 0.9 m for adults) or if vegetative cover has been cleared, the birds will avoid it regardless of total area [5] . Alwara Lake in Kaushambi district has attracted attention as a crane site in recent years, but published accounts have focused primarily on population counts and seasonal abundance patterns [6,7] . What hasn't been systematically examined is the spatial heterogeneity of habitat conditions within and around the lake, and how that heterogeneity maps onto crane distribution.
The lake is not a uniform water body it contains distinct zones ranging from deep open water to shallow vegetated margins, and the surrounding landscape transitions from reed beds to cultivated fields within a few hundred meters [8] . Understanding which zones the cranes actually use, and why, is essential for targeted habitat management. This research combined ground-based habitat measurements with satellite-derived land-use classification and GPS-referenced crane survey data to create a spatially explicit picture of Habitat quality and crane distribution around Alwara Lake. A habitat suitability index was developed to identify the environmental parameters most strongly associated with crane presence, providing a quantitative tool for prioritizing conservation zones within the landscape.
Climatic and Environmental conditions
Kaushambi district experiences a subtropical monsoon climate with three distinct seasons: hot dry (March-June, mean temperature 32-42 °C), wet monsoon (July-September, 85% of annual rainfall), and cool dry (October-February, mean temperature 8-22 °C). Mean annual rainfall during the research period was 947 mm, measured at the Prayagraj meteorological station 55 km northwest. Relative humidity ranged from 25-35% during the dry season to 80-92% during peak monsoon. Prevailing winds shift from northwesterly during winter to southeasterly during monsoon. Alwara Lake's water budget is driven primarily by direct monsoon precipitation and surface runoff from a 14 km² catchment, with minor contributions from sub surface seepage. Evapotranspiration rates during the hot season (8-10 mm/day) exceed inflow, causing progressive water-level decline from October through May [8] .
Material and methods
Material and methods
Material
Fieldwork was carried out from April 2022 to March 2023 at Alwara Lake (25°32'N, 81°23'E) and its surrounding landscape within a 4 km radius. The research was conducted from the Department of Geography and Environmental Science, University of Lucknow, with periodic field visits supplemented by a resident field assistant at Kaushambi. Ethical clearance for wildlife observation was obtained from the University of Lucknow Research Ethics Committee (UL-REC-2022-GE08, dated 10 March 2022). Habitat measurement equipment included a graduated depth pole, Secchi disk, YSI ProDSS multi-parameter water quality meter (for dissolved oxygen, pH, conductivity, and turbidity), soil moisture probe (Delta-T ML3 ThetaProbe), and 1×1 m quadrat frames for vegetation cover estimation. Remote sensing data comprised Landsat 8 OLI/TIRS imagery (four cloud-free scenes: April, July, October 2022; January 2023) and Sentinel-2 MSI data for higher-resolution (10 m) land-use classification [9] . All imagery was processed in QGIS 3.28 with the Semi-Automatic Classification Plugin.
Methods
Five habitat zones were delineated based on dominant land cover and physiography: Zone 1 (northern shore, reeddominated), Zone 2 (eastern agricultural edge), Zone 3 (southern shallow marsh), Zone 4 (western deep open water), and Zone 5 (central island and shallows). Within each zone, three permanent sampling plots were established for monthly habitat measurements. Water depth was measured at each plot center using a graduated pole; dissolved oxygen and turbidity were measured using the YSI meter at 0.3 m below surface; soil moisture was measured at the waterline using the ThetaProbe; and vegetation cover was estimated visually within 1×1 m quadrats (three replicates per plot, percentage cover to nearest 5%) [10] . Crane surveys used point-count methodology at 15 observation stations (three per zone), with 20-minute observation bouts during morning (06:00-09:00 h) and evening (15:30-18:00 h) windows, conducted monthly. Each crane sighting was georeferenced using a handheld GPS and classified by habitat type at the point of detection. A habitat suitability index (HSI) was calculated using stepwise multiple regression with crane presence/absence as the dependent variable and six habitat parameters as independent variables [4] . Land-use classification was performed using supervised maximumlikelihood classification with five classes: water, marsh/wetland vegetation, paddy/cropland, grassland/fallow, and settlement/built-up.
Results
Habitat parameter measurements revealed substantial spatial heterogeneity across the five survey zones. Zone 3 (southern marsh) consistently showed the highest vegetation cover (mean 75%) and shallowest water depth (mean 0.8 m), while Zone 4 (western open water) had the lowest vegetation cover (15%) and greatest depth (mean 1.8 m). Dissolved oxygen was highest in Zone 4 (8.1 mg/L) where wind mixing maintained aeration, and lowest in Zone 2 (5.9 mg/L) where agricultural runoff elevated organic loading.
Comprehensive interpretation
The habitat suitability model explained 81% of the variance in crane presence across the survey landscape, with vegetation cover and water depth emerging as the dominant predictors. The negative coefficient for water depth (-0.38) confirmed that Sarus Cranes avoided zones where depth exceeded approximately 1.0 m consistent with the species' morphological constraints as a wading bird with leg length reaching roughly 0.9 m beneath the waterline. Shallow marshes and reed beds together accounted for over half of all crane sightings (51.9%), while deep open water contributed only 5.1%. Land-use classification revealed that 62% of suitable habitat (defined as areas with HSI > 0.6) lay outside any formal protection or management designation, located primarily in paddy field margins and seasonal grasslands on private agricultural land.
Discussion
Vegetation cover emerged as the single most important habitat predictor (β = 0.41), a finding that aligns with habitat-selection research across the species' range. Mukherjee et al. [11] reported that Sarus Cranes in Gujarat selected foraging sites with 50-80% emergent vegetation cover, and Sundar [12] documented similar preferences in Uttar Pradesh paddy landscapes. The mechanism is likely twofold: dense emergent vegetation provides concealment for nesting and roosting birds, and it supports higher densities of invertebrate prey particularly aquatic insects, mollusks, and crustaceans that form the bulk of the crane's animal-protein diet during the breeding season [3] . The strong negative association between water depth and crane presence has direct management implications. If water management infrastructure at Alwara Lake (check dams, sluice gates) can maintain depth between 0.3 and 1.0 m across a larger proportion of the lake margin during the dry season, the model predicts a measurable increase in usable habitat area. Currently, rapid water-level recession during March-May concentrates cranes into a shrinking zone of suitable depth, increasing competition and vulnerability to predation [5] . Perhaps the most policy-relevant finding is that nearly two-thirds of suitable crane habitat lies on unprotected private agricultural land. Traditional conservation strategies centered on designating protected areas would miss this habitat entirely. Instead, agrienvironmental payment schemes, voluntary conservation easements, or community-managed buffer zones may offer more realistic pathways to securing these habitats [13] .
Comparable approaches have succeeded for crane conservation in Japan, where rice-paddy management agreements with farmers maintain winter foraging habitat for Red-crowned Cranes [14] . The satellite-based mapping component proved essential for scaling ground observations to a landscape level. At 10 m Sentinel-2 resolution, individual field boundaries and small seasonal pools were detectable, enabling precise delineation of habitat patches that would have been invisible in coarser-resolution analyses [9] . Future iterations could integrate time-series NDVI data to capture seasonal vegetation dynamics and predict crane habitat shifts in near-real time.
Conclusion
Alwara Lake and its surrounding landscape present a spatially heterogeneous habitat mosaic where Sarus Crane distribution is driven primarily by vegetation cover, water depth, and soil moisture parameters that are, in principle, amenable to management intervention. The habitat suitability model developed in this research provides a quantitative, spatially explicit tool for identifying priority conservation zones: shallow marshes and reed beds with HSI scores above 0.6 should receive immediate management attention, including seasonal water-level regulation and vegetation restoration where degradation has occurred. The finding that 62% of suitable habitat falls outside protected boundaries points to an urgent need for landscape-level planning that engages private landowners and agricultural communities. Buffer-zone agreements, agrienvironmental payments, and community-managed conservation corridors represent viable mechanisms for extending protection beyond the lake itself. Repeating this habitat characterization exercise at three-to-five-year intervals would allow managers to track habitat condition trends and adjust interventions accordingly, while expanding the approach to other crane wetlands in eastern Uttar Pradesh would enable regional-scale habitat suitability mapping and connectivity analysis.
Acknowledgement
AcknowledgementsContributions not qualifying for authorship Mr. Rajesh Kumar Verma provided field assistance during the monsoon survey months. Ms. Anita Devi Singh assisted with GIS data processing and satellite image classification.
Figures and tables from the paper
| Parameter | Zone 1 | Zone 2 | Zone 3 | Zone 4 | Zone 5 |
|---|---|---|---|---|---|
| Depth (m) | 0.6 ± 0.2 | 0.4 ± 0.1 | 0.8 ± 0.3 | 1.8 ± 0.4 | 1.1 ± 0.3 |
| Veg Cover (%) | 62 ± 8 | 35 ± 11 | 75 ± 9 | 15 ± 5 | 48 ± 12 |
| Turbidity (NTU) | 18 ± 4 | 24 ± 6 | 12 ± 3 | 8 ± 2 | 15 ± 4 |
| DO (mg/L) | 6.8 ± 0.6 | 5.9 ± 0.8 | 7.4 ± 0.5 | 8.1 ± 0.4 | 7.0 ± 0.6 |
| Soil Moist (%) | 78 ± 7 | 52 ± 14 | 85 ± 6 | 30 ± 9 | 65 ± 11 |
Table text extracted from the original PDF; superscript letters are shown inline. The original table image is below.
View original table image
| Predictor | β | SE | t | p-value |
|---|---|---|---|---|
| Vegetation Cover (%) | 0.41 | 0.06 | 6.83 | <0.001 |
| Water Depth (m) | -0.38 | 0.07 | -5.43 | <0.001 |
| Soil Moisture (%) | 0.29 | 0.08 | 3.63 | 0.001 |
| Turbidity (NTU) | -0.18 | 0.09 | -2.00 | 0.051 |
| Dissolved O₂ (mg/L) | 0.12 | 0.09 | 1.33 | 0.189 |
Table text extracted from the original PDF; superscript letters are shown inline. The original table image is below.
View original table image
References
17 in the original paper- Bassi N, Kumar MD, Sharma A. Status of wetlands in India: a review of extent, ecosystem benefits, threats and management strategies. J Hydrol Reg Stud. 2014; 2:1-19.
- Sundar KSG. Flock size, density and habitat selection of four large waterbird species in an agricultural landscape. Bird Conserv Int. 2006; 16(1):59-70.
- Meine CD, Archibald GW. The cranes: status survey and conservation action plan. Gland (Switzerland): IUCN Species Survival Commission; 1996. p. 1-401.
- Guisan A, Zimmermann NE. Predictive habitat distribution models in ecology. Ecol Model. 2000; 135(2-3):147-186.
- Mukherjee A, Galloway GE, Borad CK. Wading depth preference and foraging microhabitat selection in Sarus Crane. Waterbirds. 2000; 23(Spec Publ 1):408-413.
- Jha KK. Wetland microhabitat heterogeneity and its role in sustaining waterbird assemblages. Wetl Ecol Manag. 2015; 23(5):845-860.
- Kumar P, Gupta SK. Wetland ecology and avifaunal diversity of Alwara Lake. J Wetl Environ Manag. 2019; 7(2):98-112.
- Pandey RK, Sharma AK. Vegetation composition and wetland habitat structure of Alwara Lake floodplain. Int J Ecol Environ Sci. 2020; 46(3):219-228.
- Shri P. Demographic variation in the population of Sarus crane in and around Alwara Lake of district Kaushambi, India. Int J Biol Sci. 2024; 6(1):24-27.
- Kent M, Coker P. Vegetation description and analysis: a practical approach. Chichester: John Wiley & Sons; 1992. p. 1-363.
- Mukherjee A, Borad CK, Parasharya BM. Breeding performance of the Indian Sarus Crane in agricultural landscape. Biol Conserv. 2002; 105(2):263-269.
- Sundar KSG, Kaur J, Choudhury BC. Abundance, demographics and condition of Indian Sarus Cranes. J Ornithol. 2016; 157(3):837-847.
- Goldman RL, Tallis H. A critical analysis of ecosystem services as a tool in conservation projects. Ann N Y Acad Sci. 2009; 1162(1):63-78.
- Kubo N, Takashima A. Management of rice paddy habitat for Red-crowned Crane conservation in Hokkaido. Jpn J Conserv Ecol. 2018; 23(1):87-96.
- Kushwaha SPS, Dwivedi RS. Wetland monitoring and mapping using remote sensing and GIS. Indian J Remote Sens. 2019; 47(8):1283-1294.
- Borad CK, Mukherjee A, Patel SB. Population status and habitat preference of Sarus Crane in Gujarat. Zool Res. 2002; 23(3):190-195.
- Finlayson CM, Davidson NC. Global review of wetland resources and priorities for wetland inventory. Mar Freshw Res. 1999; 50(8):867-875.