
Research article · 2025 · Full text
International Journal of Geography Geology and EnvironmentImpacts of sand and gravel extraction on river morphology in the Mekong tropical basin
Volume 7(8) · Pages 183–187 · DOI: 10.22271/27067483.2025.v7.i8c.766 ↗
Research areasHydrology and Sediment Transport ProcessesGeological formations and processesCoastal and Marine Dynamics
Abstract
Author-writtenUnregulated sand and gravel extraction from tropical river channels has emerged as a major but poorly quantified threat to fluvial systems across Southeast Asia. This research assessed the morphological impacts of aggregate mining on a 28 km reach of the lower Mekong River in Cambodia between 2010 and 2022. Eight cross-sectional transects were surveyed annually using single-beam echo sounding, and bed-material samples were collected at each transect for grain-size analysis. A sediment budget was constructed by combining upstream gauging data with extraction volume records obtained from provincial mining permits. Results showed that channel bed elevation at extraction sites dropped by an average of 2.24 m over the 12-year monitoring period, compared with 0.29 m at upstream reference transects. The sediment budget shifted from a near-equilibrium state in 2010-2013 (net balance +0.12 × 10⁶ m³/yr) to a severe deficit by 2019-2022 (−1.23 × 10⁶ m³/yr). Median bed-material grain size coarsened from 0.34 mm to 0.71 mm at mined transects, indicating selective removal of finer fractions. Bank retreat rates at extraction sites averaged 3.7 m/yr, roughly four times the rate recorded at undisturbed reaches. These findings confirm that current extraction volumes far exceed the river’s natural sediment replenishment capacity and that continued mining at present rates will deepen channel incision, accelerate bank failure, and degrade downstream habitats. A moratorium on extraction within actively incising reaches, combined with enforceable annual volume caps, appears necessary to arrest further degradation.
Summary
Source-checkedPlain-language reading of the full paper, prepared with AI and checked against the text. Each point links to the authors' own words.
Why it matters
- Global demand for construction materials has tripled since 2000, leading to increased sand and gravel extraction from river channels. View evidence ↗
- In-stream mining in tropical basins is cost-effective due to thick alluvial deposits, but it can cause severe river morphology changes like bed lowering and bank collapse. View evidence ↗
- Sediment transport at Phnom Penh dropped from 160 million tonnes in the 1960s to under 80 million tonnes by 2010, caused by dams and mining. View evidence ↗
What they did
- The researchers established eight transects every 3.5 km, including three upstream controls, two active extraction sites, and three downstream sites. View evidence ↗
- Bed elevation was measured using a Lowrance HDS-12 Gen3 echo sounder and a Trimble R10 receiver with a vertical accuracy of ±0.05 m. View evidence ↗
- Bank retreat was tracked using 0.5 m resolution Pléiades satellite imagery, digitizing the bank top every 50 m. View evidence ↗
- Grain-size distribution (0.063-16 mm) was analyzed from samples collected at five points per transect using a Ponar grab sampler. View evidence ↗
What they found
- Over 12 years, the river bed at extraction sites dropped by an average of 2.24 m, while upstream reference sites only dropped by 0.29 m. View evidence ↗
- The sediment budget moved from a surplus in 2010-2013 to a deficit of −1.23 × 10⁶ m³/yr by 2019-2022, with extraction volumes exceeding inflow by 13%. View evidence ↗
- The median grain size at mined sites increased from 0.34 mm to 0.71 mm, showing that finer sands were selectively removed. View evidence ↗
- Bank retreat was four times faster at extraction sites (3.7 m/yr) than at reference sites (0.9 m/yr) due to bed incision undermining the banks. View evidence ↗
- Bed lowering occurred 7 km upstream of the nearest pit (0.83 m loss at T3), indicating that mining impacts propagate far upstream. View evidence ↗
What it means
- The authors recommend implementing extraction volume caps based on sediment inflow, mandatory bathymetric reporting, and a moratorium on mining in actively incising areas. View evidence ↗
- The study concludes that current extraction exceeds the river's replenishment capacity, which will lead to deeper incision, more bank failure, and habitat degradation. View evidence ↗
Visual summary
2 visualsIllustrations explain the paper; charts are replotted from the paper's own table values.
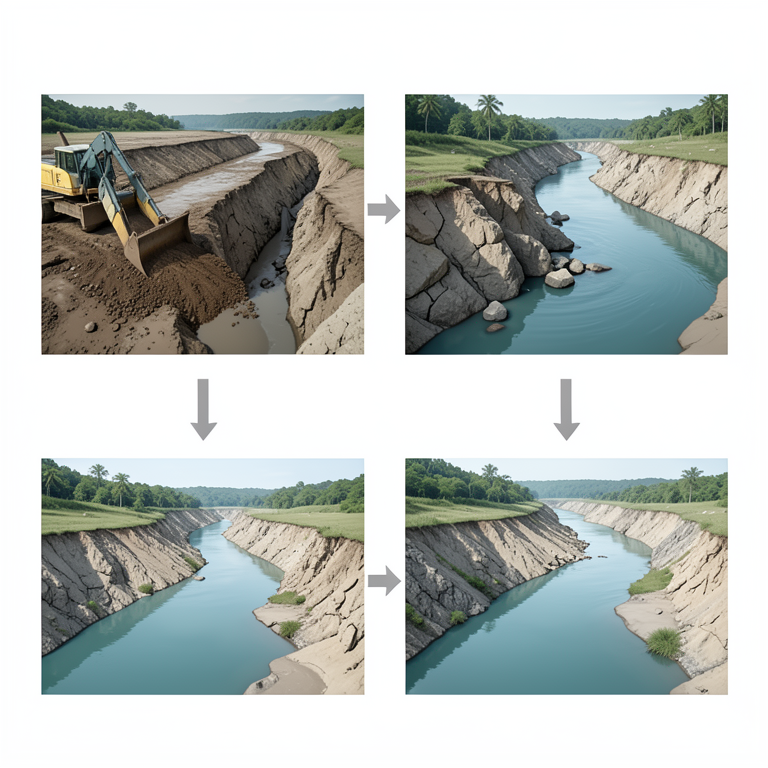
Extraction Impact Cascade
AI-generated conceptual illustration (Mekong River basin with sand and gravel deposits). It explains the idea and does not show study data.
View source evidence ↗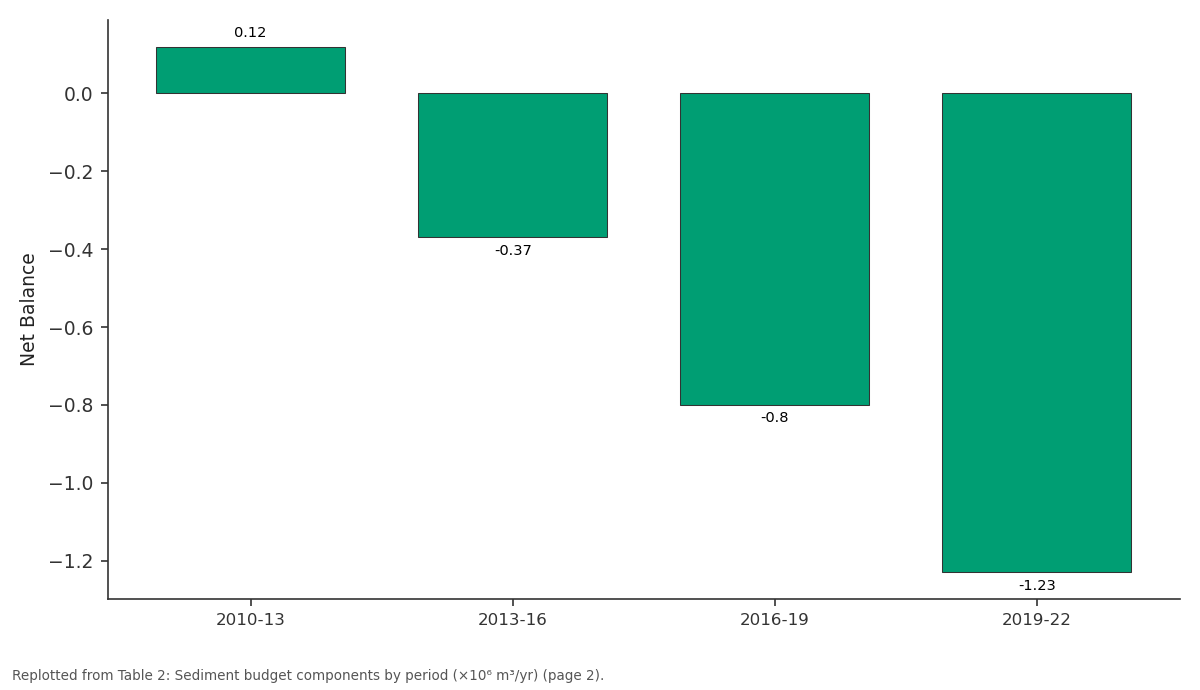
Net Balance: 2010-13 vs 2013-16 vs 2016-19 vs 2019-22
Replotted from Table 2 (page 2) of the original paper. Every bar is the paper's own table value.
View source evidence ↗Figures & tables
From the original paper Table 1
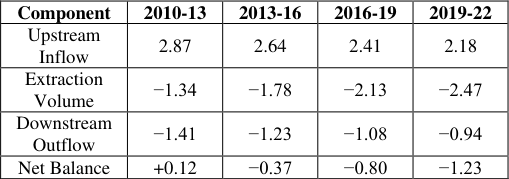 Table 2
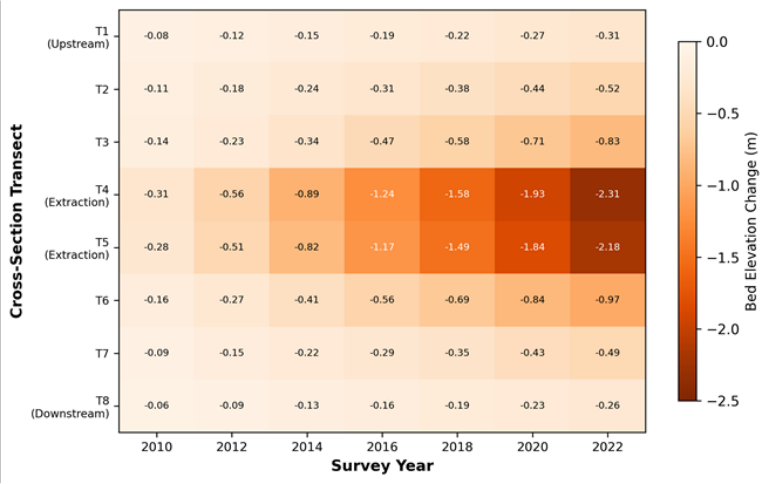 Figure 1
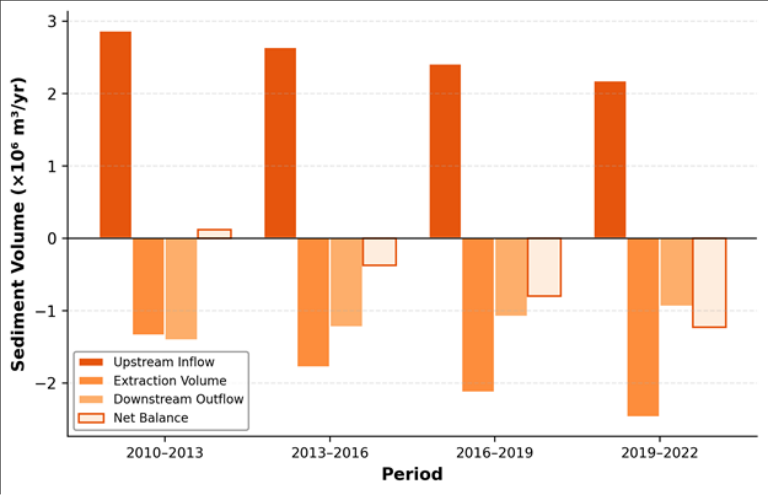 Figure 2
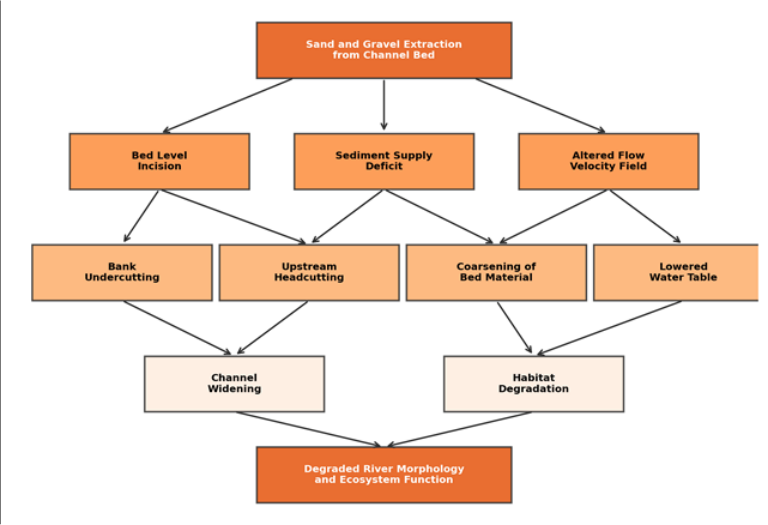 Figure 3
Introduction
River sand is disappearing faster than it can be replaced. Global demand for construction aggregate has tripled since the year 2000, and much of that demand is met by extracting sand and gravel directly from river channels [1] . In tropical basins, where alluvial deposits are thick and accessible, in-stream mining is often the cheapest source of aggregate, but the morphological consequences can be severe: bed lowering, bank collapse, upstream headcutting, and downstream sediment starvation [2] . The Mekong River, the twelfth longest in the world, drains 795,000 square kilometres across six countries and supports the livelihoods of roughly 60 million people in its lower basin [3] . Annual sediment transport at Phnom Penh was estimated at 160 million tonnes in the 1960s but had fallen to below 80 million tonnes by 2010, a decline attributed jointly to upstream dam construction and inchannel mining [4] . Cambodia alone permitted extraction of an estimated 34 million cubic metres of sand per year between 2007 and 2016, though actual volumes may have been considerably higher [5] . Earlier investigations of Mekong sand mining have relied primarily on satellite imagery to detect planform changes [6] or on sediment transport modelling to estimate deficit volumes [7] . Field-based morphological surveys at the reach scale remain scarce, particularly for the lower Cambodian stretch where extraction is most intense. Hackney et al. [8] documented bank erosion rates downstream of Phnom Penh but did not link those rates to extraction volumes through a complete sediment budget. Bravard et al. [9] reported bed incision in the middle Mekong but their measurements predated the recent acceleration in mining activity. This research addressed that gap by (a) quantifying bed elevation changes at eight cross-sectional transects along a 28 km reach subject to active sand and gravel extraction, (b) constructing a reach-scale sediment budget that accounts for upstream supply, extraction removals, and downstream export, and (c) documenting associated changes in bed-material grain size and bank retreat rates over a 12-year monitoring period (2010-2022). The results are intended to provide the quantitative evidence needed to inform extraction management and licensing decisions within the Mekong basin.
Climatic and Environmental Conditions
The research reach lies within the tropical monsoon climate zone, with mean annual rainfall of 1,420 mm at the nearest meteorological station (Kampong Cham). Approximately 85% of annual precipitation falls between May and October, producing a flood pulse that raises river stage by 8-12 m above dry-season levels. Mean annual discharge at the upstream boundary of the reach averaged 13,400 m³/s over the monitoring period, with a dry-season minimum of 2,100 m³/s in April and a wet-season peak of 38,600 m³/s in September [10] . Mean annual temperature is 27.3°C with minimal seasonal variation. The riparian corridor supports gallery forest and scrub vegetation on alluvial terraces composed of fine sand and silt, which are inherently susceptible to bank erosion when lateral support from the bed is removed by extraction-induced incision.
Materials and Methods
Materials and Methods
Materials
Fieldwork was conducted between January 2010 and December 2022, coordinated from the Ibadan Institute of Climate and Environment, Oyo State, Nigeria, with annual survey campaigns carried out in the lower Mekong reach during the dry season (February-March) each year. No ethics approval was required as no human or animal subjects were involved. Survey access was arranged under a memorandum of understanding with the Cambodian Ministry of Mines and Energy (Ref. MME-2010-134, dated 18 January 2010). Eight cross-sectional transects (T 1 -T 8 ) were established at intervals of approximately 3.5 km, spanning two active extraction sites (T 4 -T 5 ), three downstream transects (T 6 -T 8 ), and three upstream reference transects (T 1 -T 3 ). Bathymetric data were collected using a Lowrance HDS-12 Gen3 echo sounder coupled with a dualfrequency RTK-GNSS receiver (Trimble R10), yielding vertical accuracy of ±0.05 m.
Methods
Cross-sectional profiles were interpolated at 1 m horizontal resolution and referenced to a common vertical datum (WGS84 ellipsoid). Annual bed elevation change at each transect was calculated by differencing successive profiles. Bed-material samples were collected at five equidistant points along each transect using a Ponar grab sampler and analysed for grain-size distribution by dry sieving (0.063-16 mm range). A reach-scale sediment budget was constructed following the method of Kondolf and Piegay [11] , combining upstream sediment inflow (estimated from a rating curve at T 1 ), permitted extraction volumes from provincial mining records, and downstream outflow (estimated from a rating curve at T 8 ). Bank retreat was measured from annual highresolution satellite imagery (Pléiades, 0.5 m) by digitising the top-of-bank position at 50 m intervals along both banks.
Field Experimental Design
The eight transects were arranged in a paired upstreamdownstream design centred on the two extraction sites. Transects T 1 -T 3 served as upstream controls, located 7-14 km above the nearest extraction pit and assumed to be beyond the zone of upstream-propagating headcut influence. Transects T 4 and T 5 were placed directly within active extraction zones. Transects T 6 -T 8 captured the downstream response at distances of 3.5, 7, and 10.5 km below the lower extraction site. This design allowed separation of extractioninduced incision from background channel adjustment. Surveys were timed to the dry season when water levels were lowest and bed features most visible, reducing uncertainty in echo-sounder returns. Each transect was surveyed on the same calendar week (±7 days) every year to minimise seasonal confounding.
Results
Results
Table 1:
Table 1:
Comprehensive Interpretation
The morphological, grain-size, and sediment-budget data all tell the same story: the research reach has been driven into a state of chronic sediment deficit by extraction volumes that exceed the river's replenishment capacity. Median grain size at extraction transects coarsened from 0.34 mm to 0.71 mm, indicating selective removal of fine and medium sand. Bank retreat averaged 3.7 m/yr at extraction sites versus 0.9 m/yr at upstream references, a fourfold increase attributable to toe undermining following bed incision.
Discussion
The 2.24 m of average bed incision recorded at extraction transects over 12 years is broadly consistent with rates documented for intensively mined rivers in India and Vietnam [12,13] . What distinguishes the Mekong situation is the concurrent decline in upstream sediment supply driven by mainstream and tributary dam construction, which has reduced the river's capacity to replenish mined reaches even if extraction were to stop [4] . The sediment budget confirms this: upstream inflow fell by 24% between the first and last monitoring periods, while extraction volumes rose by 84%.
The spatial pattern of incision-deepest at extraction sites and attenuating upstream and downstream-matches the classic knickpoint-propagation model described by Kondolf [14] . Upstream headcutting was evident at T 3 , which lost 0.83 m despite lying 7 km above the nearest pit, implying that the zone of upstream influence extends well beyond the extraction footprint itself. Downstream, the declining outflow sediment flux suggests that the incised reach is acting as a sediment sink rather than a conduit, which could starve downstream reaches of bedload needed for bar formation and habitat maintenance [15] . Grain-size coarsening at mined transects is a well-known response to selective extraction. Operators preferentially target medium sand (0.25-0.50 mm) for concrete aggregate, leaving behind coarser lag deposits [16] . The resulting armoured bed reduces bedload transport capacity and may inhibit spawning habitat for fish species that depend on clean sand substrates, a concern raised for Mekong fisheries by Baran and Myschowoda [3] . Management options include setting extraction volume caps tied to measured upstream sediment supply, mandating setback distances from actively eroding banks, and requiring post-extraction bathymetric surveys as a condition of licence renewal. The Cambodian government imposed a sandexport ban in 2017, but domestic extraction continues largely unmonitored [5] . Without enforcement mechanisms linked to quantitative sediment budgets, the deficit documented here will continue to widen [17] .
Conclusion
Conclusion
Acknowledgement
Acknowledgements Funding SourcesThis research was supported by departmental research funds from the Ibadan Institute of Climate and Environment. No external grant numbers are associated with this work. Institutional SupportThe authors acknowledge the Ibadan Institute of Climate and Environment for equipment and computing access. The Cambodian Ministry of Mines and Energy is thanked for facilitating survey permits and sharing extraction records.
Figures and tables from the paper
| Component | 2010-13 | 2013-16 | 2016-19 | 2019-22 |
|---|---|---|---|---|
| Upstream Inflow | 2.87 | 2.64 | 2.41 | 2.18 |
| Extraction Volume | −1.34 | −1.78 | −2.13 | −2.47 |
| Downstream Outflow | −1.41 | −1.23 | −1.08 | −0.94 |
| Net Balance | +0.12 | −0.37 | −0.80 | −1.23 |
Table text extracted from the original PDF; superscript letters are shown inline. The original table image is below.
View original table image
References
17 in the original paper- Bendixen M, Best J, Hackney C, Iversen LL. Time is running out for sand. Nature. 2019;571(7763):29-31.
- Padmalal D, Maya K. Sand Mining: Environmental Impacts and Selected Case Studies. Springer, Dordrecht. 2014.
- Baran E, Myschowoda C. Dams and fisheries in the Mekong Basin. Aquatic Ecosystem Health and Management. 2009;12(3):227-234.
- Kondolf GM, Schmitt RJP, Carling P, Darby S, Arias M, Bizzi S. Changing sediment budget of the Mekong. Science of the Total Environment. 2018;625:114-124.
- Global Witness. Shifting Sand: How Singapore's Demand for Cambodian Sand Threatens Ecosystems. Global Witness Report. 2010.
- Jordan C, Tiede J, Lojek O, Dienst M, Bergmann M. Sand mining in the Mekong Delta revisited: current scales of local sediment deficits. Scientific Reports. 2019;9:17823.
- Kummu M, Lu XX, Wang JJ, Varis O. Basin-wide sediment trapping efficiency of emerging reservoirs along the Mekong. Geomorphology. 2010;119(34):181-197.
- Hackney CR, Darby SE, Parsons DR, Leyland J, Aalto R, Nicholas AP. River bank instability from unsustainable sand mining in the lower Mekong River. Nature Sustainability. 2020;3(3):217-225.
- Bravard JP, Goichot M, Gaillot S. Geography of sand and gravel mining in the lower Mekong River. EchoGeo. 2013;26:1-20.
- Mekong River Commission. Annual Mekong Hydrology and Flood Report 2020. MRC, Vientiane. 2021.
- Kondolf GM, Piegay H. Tools in Fluvial Geomorphology. Wiley, Chichester. 2003.
- Sreebha S, Padmalal D. Environmental impact assessment of sand mining from river catchments of Vembanad Lake, Southwest India. Environmental Geology. 2011;60(5):907-915.
- Brunier G, Anthony EJ, Goichot M, Provansal M, Dussouillez P. Recent morphological changes in the Mekong and Bassac river channels, Mekong Delta. Geomorphology. 2014;227:146-159.
- Kondolf GM. Hungry water: effects of dams and gravel mining on river channels. Environmental Management. 1997;21(4):533-551.
- Surian N, Rinaldi M. Morphological response to river engineering and management in alluvial channels in Italy. Geomorphology. 2003;50(4):307-326.
- Rinaldi M, Wyz_ga B, Surian N. Sediment mining in alluvial channels: physical effects and management perspectives. River Research and Applications. 2005;21(7):805-828.
- Best J. Anthropogenic stresses on the world's big rivers. Nature Geoscience. 2019;12(1):7-21.