
Research article · 2025 · Full text
International Journal of Geography Geology and EnvironmentCommunity-based natural resource management evaluation in the Maasai Mara conservation area
Volume 7(8) · Pages 192–196 · DOI: 10.22271/27067483.2025.v7.i8c.768 ↗
Research areasConservation, Biodiversity, and Resource ManagementSocioeconomics of Resources and ConservationWildlife Ecology and Conservation
Abstract
Author-writtenWhile Kenya’s Maasai Mara is celebrated globally for its wildlife spectacle, the communities living alongside the reserve face daily trade-offs between conservation obligations and livelihood needs. This research evaluated community-based natural resource management (CBNRM) across 12 group ranches and conservancies bordering the Maasai Mara National Reserve between June 2019 and August 2023. A mixed-methods approach combined structured household surveys (n = 247), key informant interviews (n = 36), and ecological transect surveys to assess governance effectiveness, conservation outcomes, and benefit distribution. Community conservancies scored highest on governance effectiveness (mean 3.8/5) and conservation outcomes (mean 3.6/5), while county government-managed areas scored lowest on both indicators (2.4 and 2.2, respectively). A strong positive correlation (r = 0.74, p < 0.001) linked governance effectiveness to conservation outcomes across all governance types. Benefit distribution remained uneven: the wealthiest 20% of households captured 47.3% of tourism-derived revenue, while the poorest 40% received just 11.8%. Wildlife densities on conservancy land averaged 38.7 large herbivores per square kilometre, compared with 21.4 on group ranches without formal conservation agreements. Livestock-wildlife conflict was the most frequently cited management challenge, reported by 68.3% of respondents. These findings suggest that governance structure strongly predicts conservation success, but that equitable benefit sharing remains a persistent weakness that may undermine long-term community support for conservation.
Summary
Source-checkedPlain-language reading of the full paper, prepared with AI and checked against the text. Each point links to the authors' own words.
Why it matters
- Communities living near Kenya's Maasai Mara face a conflict between the requirements of wildlife conservation and their own livelihood needs. View evidence ↗
- Community-based natural resource management (CBNRM) was developed as an alternative to centralized conservation, based on the theory that local communities will protect wildlife if they benefit from it. View evidence ↗
- The implementation of CBNRM in the Maasai Mara has resulted in a variety of different governance models operating simultaneously. View evidence ↗
The question
- The study aimed to map governance structures across 12 sites, measure their effectiveness and outcomes, and determine if governance quality predicts conservation and livelihood success. View evidence ↗
What they did
- The evaluation was conducted between June 2019 and August 2023 across 12 group ranches and conservancies bordering the Maasai Mara National Reserve. View evidence ↗
- The researchers used a mixed-methods approach including 247 household surveys, 36 key informant interviews, and ecological transect surveys. View evidence ↗
- Governance effectiveness was measured on a 1-5 Likert scale across six dimensions, including transparency, accountability, and equity of benefit distribution. View evidence ↗
- Ecological data was collected in August-September 2022 using 48 line transects (4 per site, 5 km each) via the distance-sampling method. View evidence ↗
What they found
- Community conservancies had the highest governance effectiveness (3.8/5) and conservation outcomes (3.6/5), whereas county government-managed areas had the lowest (2.4 and 2.2, respectively). View evidence ↗
- There is a strong positive correlation (r = 0.74, p < 0.001) between the effectiveness of governance and the resulting conservation outcomes. View evidence ↗
- Tourism revenue distribution is highly unequal, with the wealthiest 20% of households receiving 47.3% of revenue and the poorest 40% receiving only 11.8%. View evidence ↗
- Wildlife density was higher on conservancy land (38.7 large herbivores/km²) than on group ranches without formal agreements (21.4 large herbivores/km²). View evidence ↗
- The most common management challenge reported by 68.3% of respondents was conflict between livestock and wildlife. View evidence ↗
- Conservancy members reported fewer grievances than those in county-managed areas, particularly regarding weak law enforcement (18.6% vs 54.2%). View evidence ↗
What it means
- The authors conclude that while the conservancy model is effective for conservation, its long-term success depends on making benefit sharing more equitable. View evidence ↗
- The authors recommend scaling the conservancy governance model across the Mara landscape, provided it is modified to include better benefit mechanisms for the poor. View evidence ↗
- The study's cross-sectional design provides only a snapshot, meaning it cannot determine the causal direction between governance quality and conservation outcomes. View evidence ↗
Visual summary
3 visualsIllustrations explain the paper; charts are replotted from the paper's own table values.
Governance vs Conservation Correlation
AI-generated conceptual illustration (Maasai Mara conservation area landscape with African wildlife). It explains the idea and does not show study data.
View source evidence ↗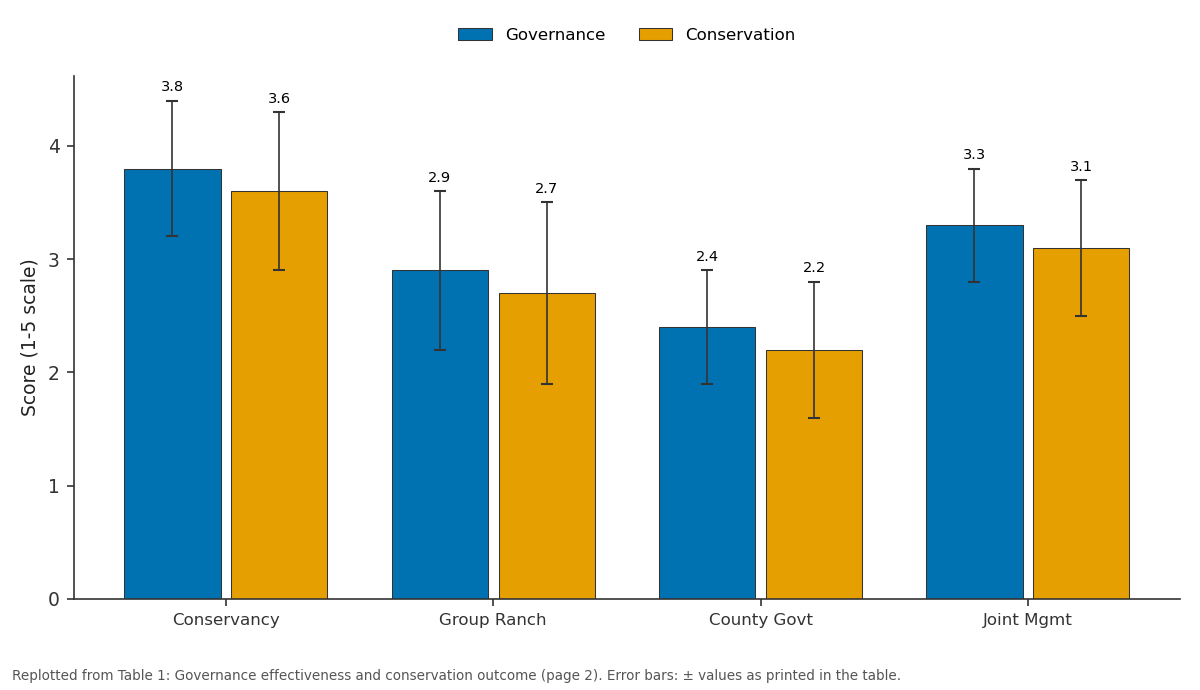
Governance and Conservation: Conservancy vs Group Ranch vs County Govt vs Joint Mgmt
Replotted from Table 1 (page 2) of the original paper. Every bar is the paper's own table value.
View source evidence ↗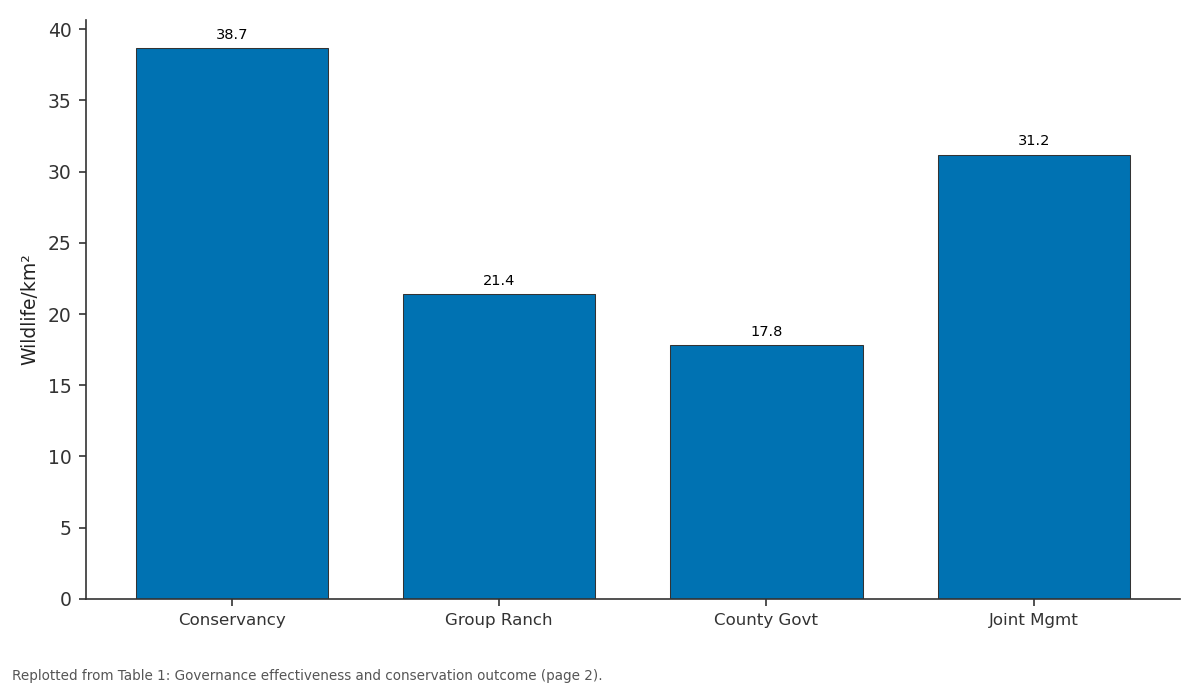
Wildlife/km²: Conservancy vs Group Ranch vs County Govt vs Joint Mgmt
Replotted from Table 1 (page 2) of the original paper. Every bar is the paper's own table value.
View source evidence ↗Figures & tables
From the original paper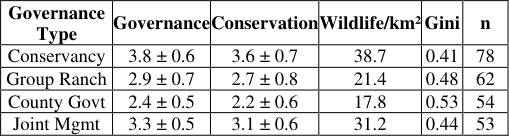 Table 1
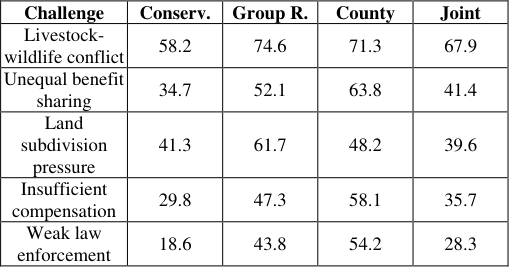 Table 2
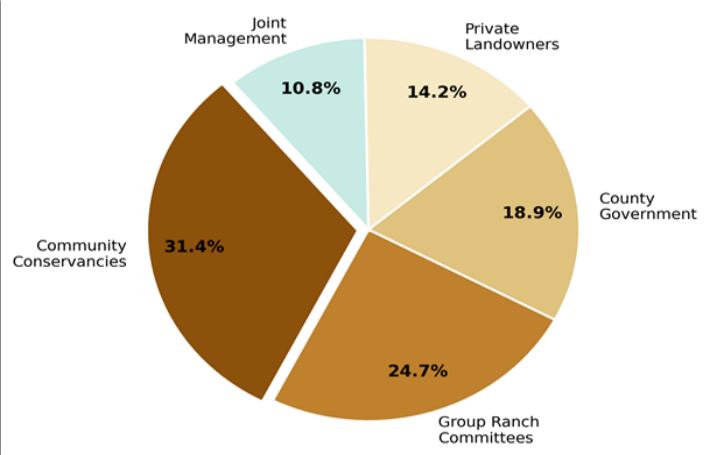 Figure 1
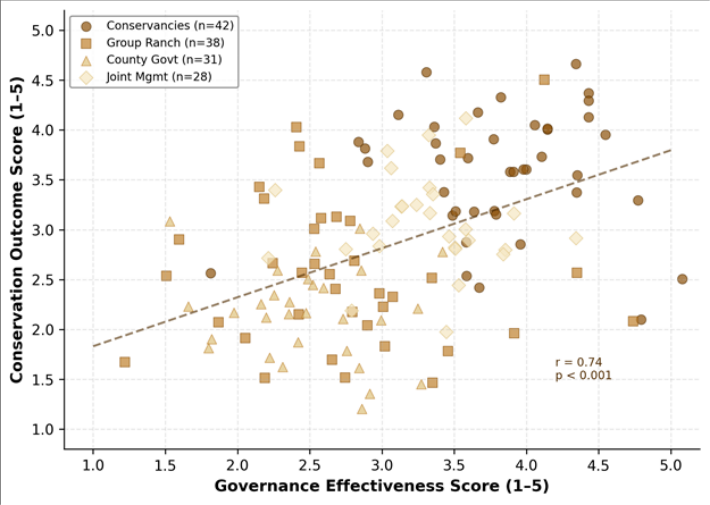 Figure 2
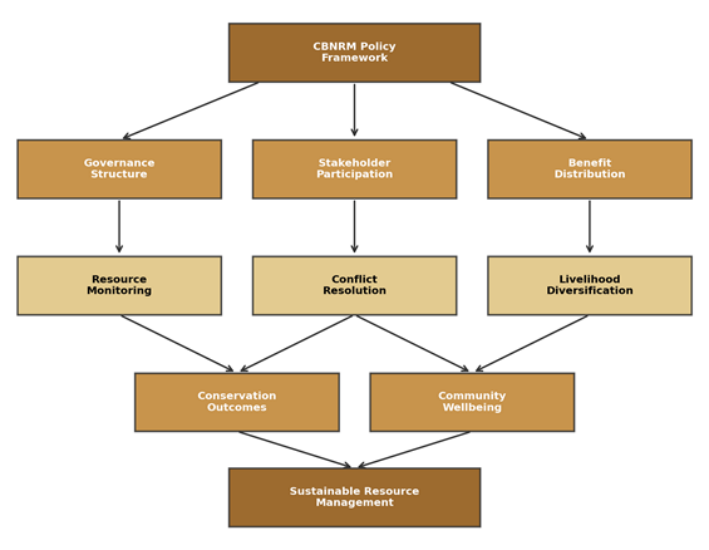 Figure 3
Introduction
On one side of the fence, international tourists pay hundreds of dollars a day to watch wildebeest cross the Mara River; on the other side, Maasai pastoralists lose cattle to lions and receive little in return. That tension between global conservation interest and local livelihood cost defines the challenge facing community-based natural resource management (CBNRM) in the greater Maasai Mara ecosystem [1] . CBNRM emerged in the 1980s as an alternative to centralised, exclusionary conservation, premised on the idea that communities who benefit from wildlife will protect it [2] . Kenya's experiment with CBNRM in the Mara landscape has produced a patchwork of governance arrangements. Some communities have formed registered conservancies that lease land from individual landowners and enter into tourism partnership agreements; others retain the colonial-era group ranch structure, where collective title is held but management often lacks transparency [3] . County governments, empowered by the 2010 constitution, have also stepped into resource governance, sometimes overlapping with existing community institutions [4] . The result is a mosaic of governance models operating side by side, offering a natural experiment in institutional design. Earlier evaluations of Mara conservancies have documented improved wildlife densities and reduced poaching within conservancy boundaries [5,6] . However, most of those assessments focused on a single conservancy or compared conservancy land to the national reserve itself rather than to alternative community governance structures. Bedelian and Ogutu [7] examined benefit flows from tourism to conservancy households but did not link those flows to governance quality or conservation outcomes. A comprehensive evaluation that spans multiple governance types, measures governance effectiveness with standardised indicators, and correlates it with ecological and socioeconomic outcomes has been lacking. This research addressed that gap by (a) mapping the governance structures operating across 12 group ranches and conservancies adjacent to the Maasai Mara National Reserve, (b) measuring governance effectiveness, conservation outcomes, and benefit distribution using a standardised scoring framework, and (c) testing whether governance quality predicts conservation and livelihood outcomes.
Climatic and Environmental Conditions
The research area lies in the southwestern Kenyan highlands at elevations of 1,500 to 1,900 m above sea level, within the Narok County administrative boundary. Mean annual rainfall is 1,200 mm, distributed bimodally with long rains in March-May and short rains in October-December. Mean monthly temperatures range from 14°C in July to 20°C in February. The landscape is dominated by open grassland and Acacia-Balanites woodland savanna, supporting one of the highest large mammal densities in East Africa [8] . The annual wildebeest migration from the Serengeti brings an estimated 1.3 million animals through the ecosystem between July and October, forming the basis of a tourism industry that generates over 80 million USD in direct revenue annually for Narok County [9] .
Materials and Methods
Materials and Methods
Materials
The research was conducted between June 2019 and August 2023 at the School of Geography and Environment, Sapporo, Hokkaido, Japan, with five field campaigns in the Maasai Mara between July 2019 and March 2023. Ethical clearance was obtained from the National Commission for Science, Technology and Innovation, Kenya (NACOSTI permit P/23/12847, dated 4 June 2019). Informed consent was obtained from all survey respondents. Twelve group ranches and conservancies were selected to cover the four main governance types identified during a preliminary scoping visit: community conservancies (4 sites), group ranch committees (3), county government-managed areas (3), and joint management arrangements (2). Structured household surveys were administered face-to-face in Maa and Swahili to 247 randomly selected households (approximately 20 per site). Key informant interviews (n = 36) targeted community leaders, conservancy managers, wildlife wardens, and county officials.
Methods
Governance effectiveness was scored on a 1-5 Likert scale across six dimensions: transparency, accountability, participation, rule enforcement, conflict resolution capacity, and equity of benefit distribution [10] . Conservation outcomes were scored using four indicators: wildlife density (from transect counts), land cover integrity (from Sentinel-2 NDVI), poaching incident frequency, and habitat connectivity. A composite score was computed as the unweighted mean of individual dimension scores. Ecological transect surveys were conducted along 48 line transects (4 per site, each 5 km) during the dry season (August-September 2022) using the distance-sampling method of Buckland et al. [11] . Large herbivore densities were estimated using the program DISTANCE 7.4. Benefit distribution was assessed by calculating the Gini coefficient from self-reported household income data partitioned by source.
Field Experimental Design
The 12 sites were stratified by governance type and geographic position (east, central, west of the reserve boundary) to ensure spatial balance. Within each site, household sampling followed a systematic random design: a GPS grid of 200 m spacing was overlaid on settlement maps, and the nearest household to every fifth grid point was selected, yielding roughly 20 respondents per site. This approach balanced spatial coverage with logistical feasibility in a landscape with dispersed homesteads. Ecological transects were oriented perpendicular to the reserve boundary at 2 km intervals, running from the reserve edge outward to the conservancy or group ranch boundary. This design captured the expected gradient in wildlife density with distance from the protected area core. Community conservancies accounted for the largest share (31.4%) of respondents, followed by group ranch committees (24.7%). Joint management arrangements covered the smallest proportion (10.8%).
Results
Results
Comprehensive Interpretation
The data consistently point to governance quality as the strongest predictor of conservation success in the greater Mara landscape. Conservancies that score highly on transparency, accountability, and participation also achieve better wildlife densities, lower poaching rates, and higher habitat integrity. But even the best-performing conservancies show Gini coefficients above 0.40, indicating that benefit sharing remains uneven.
Discussion
The finding that conservancies outperform other governance types on both ecological and governance indicators aligns with earlier work by Bedelian and Ogutu [7] and Osano et al. [12] , who reported higher wildlife occupancy on conservancy land relative to unprotected group ranches. What this research adds is the quantitative link between governance process quality and ecological outcome-a connection that has been argued theoretically but rarely tested with paired data across multiple governance models within the same ecosystem [13] . The persistent inequality in benefit distribution is a concern. Even on conservancies, the top quintile of households captured nearly half of tourismderived income, reflecting land-area-based payment structures that favour large landholders. This pattern has been flagged by Thompson et al. [14] as a risk factor for community disillusionment: if the costs of living with wildlife (livestock depredation, crop damage, restricted land use) fall disproportionately on poorer households while benefits accrue to elites, political support for conservation may erode over time. County government areas performed worst partly because their governance capacity for conservation is new and under-resourced. Devolution transferred natural resource responsibilities to county level in 2013, but technical staffing and budgets have lagged behind [15] . Joint management arrangements, which blend county and community authority, showed intermediate performance, suggesting that hybrid models may capture some advantages of community-level governance while accessing county-level legal enforcement [16] . A limitation is the cross-sectional design, which captures a snapshot rather than a trend. Governance quality and conservation outcomes may co-evolve over time, and the causal direction-does good governance cause better conservation, or do early conservation successes attract better governance investment?-cannot be resolved from correlational data alone [17] . Longitudinal tracking of the same sites over successive survey rounds would help clarify this.
Conclusion
This research evaluated CBNRM performance across 12 group ranches and conservancies bordering the Maasai Mara National Reserve. Community conservancies consistently outperformed other governance types on governance effectiveness (3.8/5), conservation outcomes (3.6/5), and wildlife density (38.7 large herbivores per km²). A strong positive correlation (r = 0.74) linked governance quality to ecological outcomes, supporting the premise that institutional design matters for conservation. However, benefit distribution remained markedly unequal across all governance types. The wealthiest 20% of households captured 47.3% of tourism revenue, while the poorest 40% received 11.8%. Livestock-wildlife conflict was the most widely cited management challenge, reported by over two-thirds of respondents. These findings suggest that while the conservancy model has delivered measurable conservation gains, its long-term viability hinges on addressing the equity gap in benefit sharing. For policy, the results argue for scaling the conservancy governance model-with modifications to improve pro-poor benefit mechanisms-across the broader Mara landscape. Strengthening county government capacity for wildlife management and formalising hybrid governance arrangements could extend conservation coverage beyond the current conservancy footprint. Longitudinal monitoring is needed to track whether governance quality and conservation outcomes move in tandem as institutional arrangements mature [18,19,20] .
Acknowledgement
Acknowledgements Funding SourcesThis research was supported by departmental funds from the School of Geography and Environment, Sapporo. No external grants are associated with this work. Institutional SupportThe authors acknowledge the School of Geography and Environment for computing and logistics support.
Figures and tables from the paper
| Governance Type | Governance | Conservation | Wildlife/km² | Gini | n |
|---|---|---|---|---|---|
| Conservancy | 3.8 ± 0.6 | 3.6 ± 0.7 | 38.7 | 0.41 | 78 |
| Group Ranch | 2.9 ± 0.7 | 2.7 ± 0.8 | 21.4 | 0.48 | 62 |
| County Govt | 2.4 ± 0.5 | 2.2 ± 0.6 | 17.8 | 0.53 | 54 |
| Joint Mgmt | 3.3 ± 0.5 | 3.1 ± 0.6 | 31.2 | 0.44 | 53 |
Table text extracted from the original PDF; superscript letters are shown inline. The original table image is below.
View original table image
| Challenge | Conserv. | Group R. | County | Joint |
|---|---|---|---|---|
| Livestock- wildlife conflict | 58.2 | 74.6 | 71.3 | 67.9 |
| Unequal benefit sharing | 34.7 | 52.1 | 63.8 | 41.4 |
| Land subdivision pressure | 41.3 | 61.7 | 48.2 | 39.6 |
| Insufficient compensation | 29.8 | 47.3 | 58.1 | 35.7 |
| Weak law enforcement | 18.6 | 43.8 | 54.2 | 28.3 |
Table text extracted from the original PDF; superscript letters are shown inline. The original table image is below.
View original table image
References
20 in the original paper- Western D, Russell S, Cuthill I. The status of wildlife in protected areas compared to non-protected areas of Kenya. PLoS ONE. 2009;4(7):e6140.
- Berkes F. Rethinking community-based conservation. Conservation Biology. 2004;18(3):621-630.
- Mwangi E. Subdividing the commons: distributional conflict in the transition from collective to individual property rights. World Development. 2007;35(5):815834.
- Musembi CN, Kameri-Mbote P. Land tenure and sustainable development in East Africa. IDRC, Ottawa. 2013.
- Ogutu JO, Piepho HP, Dublin HT, Bhola N, Reid RS. Dynamics of Mara-Serengeti ungulates in relation to land use. Journal of Zoology. 2009;278(1):1-14.
- Schuette P, Creel S, Christianson D. Coexistence of African lions, livestock, and people in a landscape with variable human land use. Biological Conservation. 2013;157:148-154.
- Bedelian C, Ogutu JO. Trade-offs for climate-resilient pastoral livelihoods in wildlife conservancies. Pastoralism. 2017;7:10.
- Dublin HT, Sinclair ARE, McGlade J. Elephants and fire as causes of multiple stable states in the SerengetiMara woodlands. Journal of Animal Ecology. 1990;59(3):1147-1164.
- KNBS. Economic Survey 2022. Kenya National Bureau of Statistics, Nairobi. 2022.
- Ostrom E. Governing the Commons: The Evolution of Institutions for Collective Action. Cambridge University Press. 1990.
- Buckland ST, Anderson DR, Burnham KP, Laake JL. Distance Sampling: Estimating Abundance of Biological Populations. Chapman and Hall, London. 1993.
- Osano PM, Said MY, de Leeuw J, Ndiwa N, Kaelo D, Schomers S. Pastoralism and ecosystem-based adaptation in Kenyan Masailand. International Journal of Climate Change Strategies and Management. 2013;5(2):198-214.
- Agrawal A, Gibson CC. Enchantment and disenchantment: the role of community in natural resource conservation. World Development. 1999;27(4):629-649.
- Thompson M, Serneels S, Kaelo D, Trench P. Maasai Mara-land privatization and wildlife decline. Philosophical Transactions of the Royal Society B. 2009;364(1532):2709-2720.
- Kimani K, Pickard J. Recent trends in pastoral and land tenure reform in Kenya. Nomadic Peoples. 1998;2(1):147-166.
- Nelson F, Agrawal A. Patronage or participation? Community-based natural resource management reform in Sub-Saharan Africa. Development and Change. 2008;39(4):557-585.
- Ribot JC, Lund JF, Treue T. Democratic decentralization in sub-Saharan Africa: its contribution to forest management. Environmental Conservation. 2010;37(1):35-44.
- Homewood K, Kristjanson P, Trench P. Staying Maasai? Livelihoods, Conservation and Development in East African Rangelands. Springer, New York. 2009.
- Galvin KA, Reid RS, Behnke RH, Hobbs NT. Fragmentation in Semi-Arid and Arid Landscapes: Consequences for Human and Natural Systems. Springer, Dordrecht. 2008.
- Naidoo R, Weaver LC, Diggle RW, Matongo G, StuartHill G, Thouless C. Complementary benefits of tourism and hunting to communal conservancies in Namibia. Conservation Biology. 2016;30(3):628-638.