
Research article · 2026 · Full text
International Journal of Geography Geology and EnvironmentEcological imbalance and climate change: An analysis of causes and their accelerating impact
Volume 8(4) · Pages 194–200 · DOI: 10.22271/27067483.2026.v8.i4b.762 ↗
Research areasClimate Change and Environmental ImpactConservation, Biodiversity, and Resource ManagementEnergy, Environment, Economic Growth
Abstract
Author-writtenThis study investigates ecological imbalance and its accelerating impact on climate change, with particular focus on three key drivers: deforestation, pollution, and loss of biodiversity. Over the past three decades, climate change has emerged as one of the most urgent global challenges, significantly contributed to by human activities that disturb the natural balance of ecosystems. The research employs secondary data from credible sources including the World Bank, FAO, and WWF, using trend analysis and index-based methods to ensure comparability across variables measured in different units. Analysis of 1995-2020 data on forest area (as percentage of land), CO2 emissions (metric tons per capita), and biodiversity (Living Planet Index) reveals a steady downward trend in forest cover, an upward trajectory in emissions, and an unprecedented decline in the Living Planet Index. Combined analysis confirms interdependence among these factors and their synergistic, cumulative effect on climate change. The study concludes that only a holistic, integrated approach-encompassing forest conservation, pollution control, and biodiversity protection-can effectively mitigate climate change.
Summary
Source-checkedPlain-language reading of the full paper, prepared with AI and checked against the text. Each point links to the authors' own words.
Why it matters
- Ecological balance is a dynamic interaction between biotic and abiotic components that supports essential natural processes like nutrient cycling and climate stabilization, which are fundamental to life and economic activity. View evidence ↗
- Ecological imbalance occurs when the normal functioning of ecosystems is disrupted by environmental destruction and the over-exploitation of natural resources. View evidence ↗
- There is a self-reinforcing feedback loop between ecological imbalance and climate change, where degradation accelerates warming, which then further damages ecosystems. View evidence ↗
The question
- The study aims to fill a research gap by using a unified analytical framework to examine the combined impact of deforestation, pollution, and biodiversity loss on climate change from 1992 to 2022. View evidence ↗
- A primary objective is to determine if the joint effect of ecological stressors on climate change is synergistic rather than simply additive. View evidence ↗
What they did
- The research uses an observational, non-experimental design because the scale of environmental phenomena makes controlled experiments impossible. View evidence ↗
- The study relies on secondary data from the FAO, World Bank, WWF, and the Zoological Society of London to track forest cover, CO2 emissions, and biodiversity. View evidence ↗
- Climate change is measured as the dependent variable using a composite Climate Change Index (CCI) derived from extreme weather frequency and global mean temperature anomalies. View evidence ↗
- To assess joint impacts, the study normalizes the three independent variables to a base value of 1.0 in 1995. View evidence ↗
What they found
- Between 1992 and 2022, global forest cover decreased by 1.87 percentage points (from 33.01% to 31.14%), resulting in a net loss of 1.13 million sq. km. View evidence ↗
- Global CO2 emissions per capita increased from 4.12 metric tons in 1990 to 4.48 metric tons in 2020. View evidence ↗
- The Living Planet Index (LPI), which monitors vertebrate population abundance, fell by 56% between 1990 and 2020, dropping from approximately 0.73 to 0.32. View evidence ↗
- The study's findings support the hypothesis that ecological imbalance significantly accelerates climate change through synergistic feedback mechanisms. View evidence ↗
What it means
- The authors conclude that reducing emissions alone is insufficient; successful climate mitigation requires simultaneous action on biodiversity conservation and deforestation. View evidence ↗
- The study is limited by its reliance on secondary aggregate data and a non-experimental design, which prevents rigorous causal inference and may hide sub-national variations. View evidence ↗
Visual summary
2 visualsIllustrations explain the paper; charts are replotted from the paper's own table values.
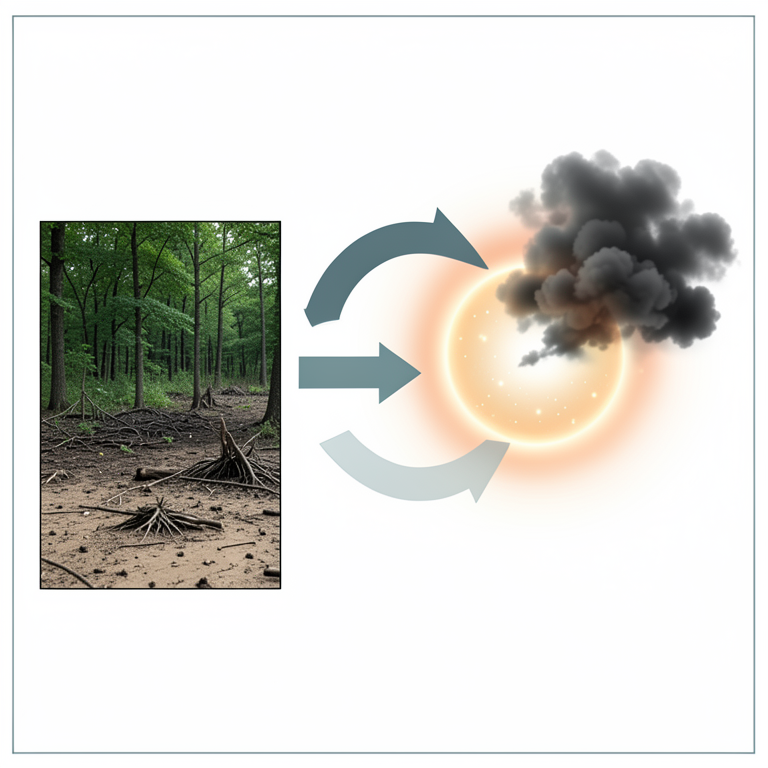
Synergistic Feedback Loop of Ecological Imbalance
AI-generated conceptual illustration (Earth's biosphere and atmosphere). It explains the idea and does not show study data.
View source evidence ↗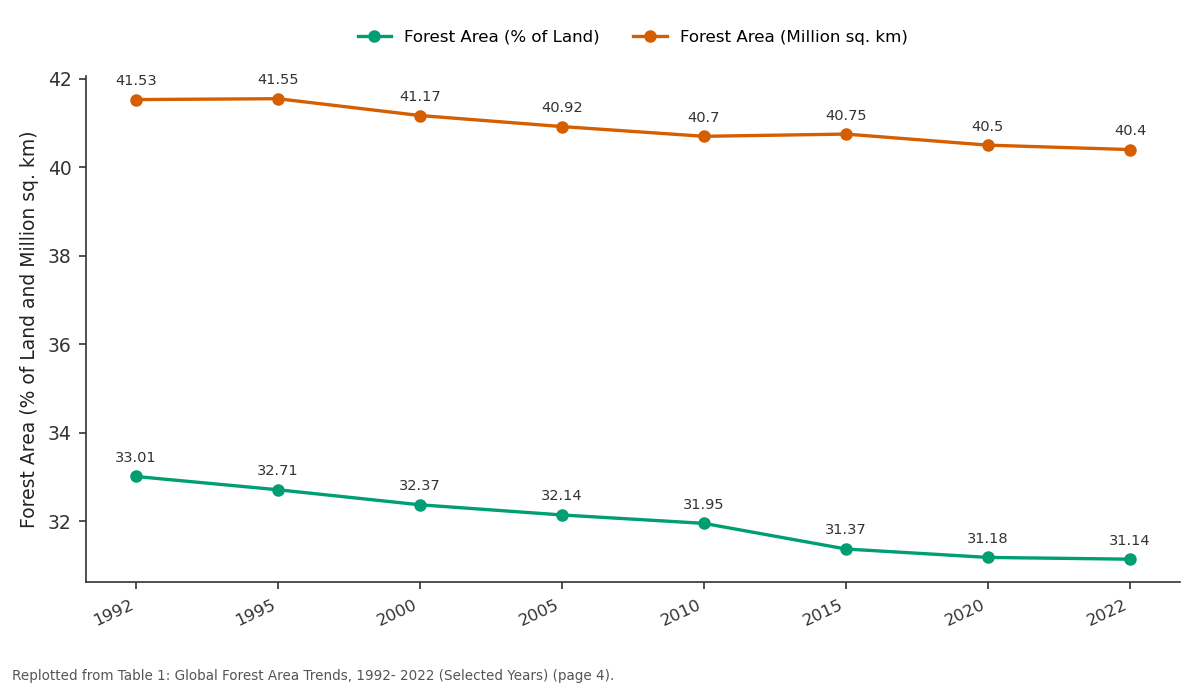
Forest Area (% of Land) and Forest Area (Million sq. km): 1992 vs 1995 vs 2000 vs 2005 vs 2010
Replotted from Table 1 (page 4) of the original paper. Every bar is the paper's own table value.
View source evidence ↗Figures & tables
From the original paper Table 1
 Table 2
 Table 3
 Table 4
Introduction
The Earth's environment is a complex, dynamic system in which biotic and abiotic components interact continuously to sustain ecological balance. This balance maintains natural processes-nutrient cycling, energy flow, water regulation, and climate stabilizationthat underpin all life and economic activity. However, accelerating industrialization, population growth, and urbanization over the past century have progressively disrupted this equilibrium, producing what ecologists term ecological imbalance. Ecological imbalance arises when the normal functioning of ecosystems is disturbed through over-exploitation of natural resources and environmental destruction. Practices such as largescale deforestation, industrial and vehicular pollution, and overexploitation of biodiversity have fundamentally altered ecosystem structure and function, undermining essential services including carbon storage, water purification, and climate regulation. The consequences extend from local ecosystem degradation to global climatic disruption. Among the most consequential effects of ecological imbalance is its role in accelerating climate change. Climate change-characterized by long-term shifts in global mean temperature, precipitation patterns, and the frequency of extreme weather events-is primarily driven by rising atmospheric concentrations of greenhouse gases. Deforestation reduces the biosphere's capacity to absorb CO2 through photosynthesis; industrial and vehicular pollution adds greenhouse gases directly; and biodiversity loss compromises the ecosystem resilience that would otherwise buffer climatic perturbations. The relationship between ecological imbalance and climate change is not unidirectional but self-reinforcing: ecological degradation accelerates warming, which in turn further degrades ecosystems, creating feedback loops of increasing severity. Rising temperatures alter precipitation regimes, exacerbate drought and flood events, and shift species distributions, intensifying the biodiversity crisis. Warming oceans amplify extreme weather events and accelerate glacier retreat, reducing freshwater availability for ecosystems dependent on meltwater.
Despite a substantial literature on individual environmental stressors, few studies have examined their combined, interactive contribution to climate acceleration. Most analyses treat deforestation, pollution, and biodiversity loss as separate problems requiring separate policy responses. This disciplinary fragmentation understates the synergistic dangers of simultaneous, mutually reinforcing ecological stressors and misinforms policy design.The present study addresses this gap by integrating all three ecological stressors within a unified analytical framework, drawing on secondary data for the period 1992-2022. The analysis tracks trends in global forest cover, index to assess their joint impact. The study also situates findings within the Indian policy context, where natural resource dependency, regulatory implementation gaps, and climatic vulnerability are particularly pronounced.
Objectives of the Study
The study pursues two principal objectives. First, to analyze the individual trends and impacts of deforestation, pollution, and biodiversity loss as the primary drivers of ecological imbalance. Second, to examine the overall combined impact of these ecological factors on climate change, and to assess whether their joint effect is synergistic rather than merely additive.
Hypothesis of the
Hypothesis of the
Structure of the Study
The remainder of the article is organized as follows. Section II reviews relevant literature. Section III presents the data and methodology. Section IV reports empirical findings on deforestation, pollution, biodiversity loss, and their combined climate impact. Section V concludes with policy recommendations and directions for future research.
Review of Literature
The connection between human ecological disruption and climate change has attracted sustained scholarly attention across disciplines. We review key contributions organized by thematic focus: deforestation and carbon cycles; pollution and greenhouse gases; biodiversity and ecosystem resilience; economic perspectives; and the Indian context.
Deforestation and Carbon Cycles
Myers (1990) [19] established that tropical forestscontaining more than half of all terrestrial species-are the most carbondense biomes on Earth, storing roughly 45% of all terrestrial carbon. Large-scale deforestation for agricultural expansion, logging, and infrastructure releases this stored carbon as photosynthetic machinery that would otherwise absorb future emissions. His biodiversity hotspots framework identified priority areas where conservation yields disproportionately high ecological returns. FAO (2020) [6] Mann (1999) [17] used tree-ring chronologies, ice cores, and other proxy records to reconstruct Northern Hemisphere temperature back600years, documenting the unprecedented warming of the twentieth century in the famous "hockey stick" graph. Land-use change-primarily deforestation-was identified as the second-largest anthropogenic contribution to atmospheric CO₂ after fossil fuel combustion.
Pollution and Greenhouse Effects Crutzen (2000) [32] established biodiversity as the foundational substrate of ecosystem functioning, demonstrating that species diversity supports nutrient cycling, pollination, energy flow, and climate regulation. Tilman (1997) [30] complemented this with experimental evidence from long-term plots showing that ecosystems with higher species richness maintain greater productivity stability in the face of environmental perturbation, including climatic variability. Reduced biodiversity directly impairs carbon sequestration efficiency and ecosystem recovery rates. Lovejoy (1980) [15] demonstrated through field experiments in Amazonia that habitat fragmentation causes biodiversity loss that is non-linear and threshold-dependent: once fragments fall below a critical size, cascading local extinctions accelerate. WWF's Living Planet Report (2022) [34] quantified this at the global scale, finding that monitored vertebrate populations have declined by an average of 69% since 1970-a rate unprecedented in the evolutionary history of complex life. Dasgupta (2021) [5] synthesized this evidence into an economic framework, demonstrating that the global economy depends on natural capital-including biodiversityas a factor of production. Current rates of exploitation exceed the regenerative capacity of natural systems, implying unsustainability. Biodiversity loss also reduces the biosphere's capacity to provide ecosystem services at a time when climate change is increasing the demand for those same services.
Economic Perspectives
Stern (2006) [28] evaluated the economic costs of climate change using integrated assessment models incorporating ecological feedback, demonstrating that unmitigated climate change could reduce global GDP by 5-20% annually on a permanent basis. The costs of early mitigation action were estimated at only 1% of GDP-a stark illustration of the economic irrationality of ecological degradation. Nordhaus (2018) [22] built on this with a dynamic integrated climateeconomy model and a Nobel Prize-winning demonstration that carbon pricing could efficiently internalize ecological externalities. Daly (1996) [4] challenged the growth paradigm itself, arguing that continuous economic expansion in a finite biosphere inevitably generates ecological overshoot. His steady-state economics framework anticipated the planetary boundaries concept by two decades. Rockstrom et al. (2009) [25] formalized this by identifying nine Earth-4 system boundaries within which human civilization can safely operate, finding that climate change and biodiversity loss boundaries had already been transgressed by 2009.
The Indian Context
India presents a particularly important case study for ecological-climate interactions. With 2.4% of the world's land area hosting approximately 7-8% of its recorded biodiversity, and with a population of 1.4 billion heavily dependent on monsoon-driven agriculture and ecosystem services, the stakesof ecological imbalance are exceptionally high (MoEFCC, 2022) [18] . Gadgil and Guha (1995) [7] documented how postindependence industrial and agricultural development strategies systematically undermined India's ecological capital, while traditional resource management institutions were displaced without adequate replacements. Narain (2020) [21] updated this analysis, noting that India's air quality crisis-with major cities regularly recording PM2.5 levels 10-20 times WHO guidelines-reflects both industrial and agricultural pollution and represents a critical climateecology interface. Shiva (1988) [27] placed Indian ecological destruction in a political economy framework, arguing that commercialised agriculture and forest exploitation dispossess subsistence communities who have historically acted as de facto ecosystem stewards. Pachauri (2007) [24] documented India's particular vulnerability to climate change impacts including irregular monsoons, glacial retreat threatening Himalayan river systems, and sea-level rise threatening its 7,500 km coastline.
Research Gap
While the literature is extensive, most studies examine deforestation, pollution, or biodiversity loss in isolation.
Data Sources
All data are secondary, sourced from internationally recognized institutions to ensure comparability and scientific credibility. Forest cover data are drawn from FAO's Global Forest Resources Assessment (2020) [6] and
Model Specification
The conceptual relationship is specified as a multivariate functional form
Expressed as a linear equation for analytical purposes
where β 0 is the intercept; β 1 captures the climate effect of a unit change in forest cover
Methods of Analysis
Three complementary analytical methods are employed. Descriptive analysis summarizes each variable's mean, range, and trend using tables and graphs. Trend analysis examines long-run directional changes across 1992-2022
for deforestation and 1990-2020 for emissions and biodiversity, identifying structural breaks and acceleration phases. Combined index analysis normalizes all three independent variables to 1995 = 1.0 and constructs a Climate Change Index to assess joint ecological impact, following the methodology of combined trend analysis used in environmental economics (UNEP, 2021) [31] . The decline is systematic and continuous across the study period, reflecting structural shifts in global land use rather than episodic events. The 1990s and early 2000s saw the most rapid rate of loss, driven by agricultural frontier expansion in tropical regions of the Amazon, Southeast Asia, and Central Africa, fueled by global commodity demand for soy, palm oil, timber, and beef. A slight acceleration around 2011-2012 corresponds to the commodity boom period. Post-2015, the rate of decline moderates somewhatreflecting national deforestation reduction commitments under the Paris Agreement and voluntary corporatezerodeforestation pledges but net forest loss continues. This pattern illustrates a persistent gap between policy commitment and implementation that has been documented across multiple jurisdictions (MoEFCC, 2022).
Results and Discussion
The climate implications are twofold and self-reinforcing. Deforestation directly releases stored carbon as CO2 and methane, accounting for an estimated 10-15% of current annual global greenhouse gas emissions. Simultaneously, reduced forest cover diminishes ongoing carbon absorption, creating a compounding effect on atmospheric The climate implications are twofold and self-reinforcing. Deforestation directly CO2 concentration. Disruption of the hydrological cycle alters regional precipitation Patterns, while loss of forest biomass reduces surface evapotranspiration, raising local and regional temperatures.
Pollution Analysis
CO₂ emissions per capita rose from 4.12 metric tons in 1990 to 4.48 metric tons in 2020. The trajectory reveals important sub-period dynamics. Emissions grew rapidly from 1990 to 2007, reflecting accelerating industrialization in emerging economies and continued fossil-fuel dependence in developed economies. A brief contraction in 2009 reflects the global financial crisis. From 2010 to 2019, the trend resumed upward, before a COVID-19-related dip in 2020 that proved temporary. The aggregate global figure conceals substantial heterogeneity. Per capita emissions in high-income OECD countries declined modestly over this period due to structural shifts toward services and deployment of renewable energy. This was more than offset by rapid emission growth in upper-middleincome countries, particularly China (from 2.1 to 7.1 metric tons per capita, 1990-2020) and India (from 0.8 to 1.9 metric tons per capita), reflecting their industrial development trajectories. Air pollution more broadly-including particulate matter, nitrogen oxides, and Sulphur dioxide-disrupts ecosystem functions beyond the direct greenhouse effect. Acid deposition degrades forest soils and aquatic ecosystems; nitrogen deposition causes eutrophication of water bodies; and ground-level ozone reduces plant productivity and impairs carbon absorption. These indirect pathways amplify the direct climate forcing of CO2 emissions, creating crossstressor interactions that are incompletely captured in single-variable analyses.
Biodiversity Loss Analysis
The Living Planet Index (LPI) measures the average change in population size of vertebrate species relative to 1970 (LPI = 1.0). Table 3 shows that the global LPI declined from approximately 0.73 in 1990 to 0.32 in 2020-a 56% reduction in monitored population abundance over three decades. The LPI for freshwater species declined even more sharply, by approximately 84%, reflecting concentrated pressures on aquatic ecosystems from water extraction, pollution, and dam construction. Biodiversity loss and climate change interact through multiple mechanisms. Loss of plant diversity reduces the range of photosynthetic strategies available to ecosystems, lowering their aggregate carbon sequestration efficiency. Loss of animal diversity impairs ecosystem processes including seed dispersal, pollination, and prey-predator regulation, reducing the structural complexity that confers climate resilience. Coral reef bleaching driven by ocean warming exemplifies the feedback loop: climate change causes biodiversity loss, which in turn reduces the ecosystem's capacity to buffer future climate impacts. India's biodiversity trends mirror global patterns with additional pressure from high population density and forestdependent livelihoods. The Western Ghats and Eastern Himalayan biodiversity hotspots face ongoing deforestation and habitat fragmentation, while India's freshwater ecosystems are severely degraded by pollution and overextraction. The combination of biodiversity loss and climate change vulnerability creates compounding risks for agricultural productivity and rural livelihoods.
| Year | Living PlanetIndex | Year | Living PlanetIndex |
|---|---|---|---|
| 1995 | 0.65 | 2015 | 0.38 |
| 2000 | 0.57 | 2018 | 0.34 |
| 2005 | 0.51 | 2020 | 0.32 |
Table text extracted from the original PDF; superscript letters are shown inline. The original table image is below.
View original table image
Combined Impact of Ecological Imbalance on Climate Change
To assess the joint effect of all three ecological stressors, Table 4 presents an index-normalised combined trend analysis for 1995-2020. Each variable is set to 1.0 in 1995, enabling direct comparison of rates of change across differently scaled indicators. The Climate Change Index (CCI) is constructed from NOAA global surface temperature anomaly records (relative to the 1951-1980 baseline) and EM-DAT data on the frequency of climaterelated events. The combined analysis reveals a coherent and reinforcing pattern. As the forest area index declines from 1.000 to 0.946 and the LPI index collapses from 1.000 to 0.492, the CO2 index rises from 1.000 to 1.117 (peaking at 1.221 in 2010), and the CCI increases monotonically from 1.000 to 1.561-a 56.1% increase over 25 years. The convergence of adverse trends across all three ecological variables, coinciding with accelerating climate change, provides strong descriptive evidence for the hypothesized synergistic relationship. The mechanisms through which this synergy operates are identifiable at each level. Deforestation removes carbon sinks (X1 effect) and simultaneously destroys biodiversity habitat (X1-X3 interaction). Pollution raises atmospheric CO2 (X2 direct effect) and acidifies water bodies, reducing aquatic biodiversity (X2-X3 interaction). Biodiversity loss reduces ecosystem resilience and carbon cycling efficiency, amplifying the climate impacts of X1 and X2 (X3 amplification effect). The combined impact therefore exceeds what would be predicted from any single-stressor analysis. It is notable that the CO2 index peaks in 2010 and declines slightly to 2020, reflecting the partial decoupling of emissions from economic growth in high-income countries and the rapid expansion of renewable energy globally. Yet the CCI continues to rise throughout, demonstrating that once ecological thresholds have been transgressed, climate change dynamics carry their own momentum even as the rate of new forcing begins to moderate. This has important policy implications: emission reductions alone are insufficient without simultaneous action on biodiversity and forest cover.
| Year | — | CO2Index | LPI Index | Climate Change Index (CCI) |
|---|---|---|---|---|
| Forest Area Index | ||||
| 1995 | 1.000 | 1.000 | 1.000 | 1.000 |
| 2000 | 0.984 | 1.020 | 0.877 | 1.082 |
| 2005 | 0.976 | 1.068 | 0.784 | 1.179 |
| 2010 | 0.969 | 1.221 | 0.677 | 1.314 |
| 2015 | 0.951 | 1.182 | 0.585 | 1.421 |
| 2020 | 0.946 | 1.117 | 0.492 | 1.561 |
Table text extracted from the original PDF; superscript letters are shown inline. The original table image is below.
View original table image
Hypothesis Testing
The combined trend analysis provides empirical support for rejection of H0 and acceptance of H1. All three component hypotheses are also supported. Deforestation (H11): declining forest area is consistently associated with rising CCI, consistent with thecarbon sink and hydrological regulation mechanisms identified in the literature. Pollution (H12): rising per capita CO 2 emissions track the CCI trajectory closely from 1995 to 2015. Biodiversity loss (H13): the LPI's dramatic decline parallels the CCI increase, consistent with the ecosystem resilience feedback mechanism. The joint pattern confirms the alternative hypothesis: ecological imbalance positively and significantly accelerates climate change through synergistic feedback pathways.
Legislative and Policy Dimensions 4.5 Legislative and Policy Dimensions
The ecological trends documented above unfold against a backdrop of substantial environmental legislation at both international and national levels. The Paris Agreement (2015) requires Nationally Determined Contributions (NDCs) to emission reductions, while the Kunming-Montreal Global Biodiversity Framework (2022) establishes a target of protecting 30% of terrestrial and Domestically, the Environment (Protection) Act 1986 provides the central legal framework for pollution control; the Forest (Conservation) Act 1980 restricts conversion of forest land to non-forest uses; the Wildlife (Protection) Act 1972 establishes a protected areas network covering approximately 5% of India's land area; and the Biological Diversity Act 2002 creates institutional mechanisms for biodiversity governance. However, enforcement gapsincluding inadequate monitoring capacity, interagency coordination failures, and competing development imperatives have limited the effectiveness of this legislative architecture (Narain, 2020) [21] .
Conclusion
This study has examined the causes of ecological imbalance and their accelerating impact on climate change, integrating evidence on deforestation, pollution, and biodiversity loss within a unified analytical framework. The principal findings are presented in four parts: empirical trends, combined impact, policy implications, and limitations.
Major Findings
The empirical evidence is unambiguous across all three ecological dimensions. Global forest cover declined by approximately 1.87 percentage points between 1992 and 2022, representing a net loss of 1.13 million sq. km 1990 and 2020, with substantially higher absolute increases in rapidly industrializing economies. The Living Planet Index declined by 56% between 1990 and 2020, indicating a catastrophic reduction in vertebrate population abundance.
Jointly, these trends correspond to a 56% increase in the composite Climate Change Index between 1995 and 2020. The combined index analysis confirms that the three ecological stressors interact synergistically rather than independently. The self-reinforcing nature of ecologicalclimatic feedbacks-deforestation intensifying warming, warming accelerating biodiversity loss, biodiversity loss reducing ecosystem resilience to further warming-creates a dynamic that cannot be adequately modelled through singlestressor approaches.
Policy Implications
The findings have direct implications for environmental policy design. First, climate change mitigation cannot succeed without simultaneous action on deforestation and biodiversity conservation: emission reductions alone are insufficient to arrest the synergistic climate-ecological feedback loop. Second, biodiversity protection must be recognised not merely as a conservation goal but as a climate change mitigation strategy, given the ecosystem resilience pathways documented here. Third, the Indian context suggests particular urgency for strengthening enforcement of the existing legislative framework, closing implementation gaps through improved monitoring and inter-agency coordination, and aligning development planning with ecological carrying capacity. Fourth, international climate finance should explicitly incorporate Education and public awareness are critical enabling conditions. As Swaminathan (2010) [29] argued, sustainable development requires not only policy reform but also behavioral change grounded in ecological literacy. Communitybased conservation, drawing on traditional ecological knowledge, can complement formal regulatory approaches, particularly in biodiversity-rich regions where state enforcement capacity is limited.
Limitations and Future Research
Directions several limitations should be acknowledged. The analysis relies on secondary aggregate data, which may mask important sub-national and temporal heterogeneity. The non-experimental design and absence of formal econometric estimation preclude rigorous causal inference: while the trend co-movements documented are consistent with the hypothesised causal mechanisms, confounding factors cannot be fully controlled. The composite indices constructed for the combined analysis involve methodological choices (variable weighting, normalisation base year) that affect results at the margin. Future research employing panel econometric methods including cointegration analysis, vector autoregression, and spatial econometrics would provide stronger causal identification. Region-specific case studies incorporating primary data on ecosystem services, household livelihoods, and institutional quality would enrich
Figures and tables from the paper
| Year | Forest Area (% of Land) | Forest Area (Million sq. km) |
|---|---|---|
| 1992 | 33.01 | 41.53 |
| 1995 | 32.71 | 41.55 |
| 2000 | 32.37 | 41.17 |
| 2005 | 32.14 | 40.92 |
| 2010 | 31.95 | 40.70 |
| 2015 | 31.37 | 40.75 |
| 2020 | 31.18 | 40.50 |
| 2022 | 31.14 | 40.40 |
Table text extracted from the original PDF; superscript letters are shown inline. The original table image is below.
View original table image
| Year | CO2Emissions(Metric Tons/Capita) | Year | CO2Emissions(Metric Tons/Capita) |
|---|---|---|---|
| 1990 | 4.12 | 2005 | 4.28 |
| 1995 | 4.02 | 2010 | 4.90 |
| 2000 | 4.10 | 2015 | 4.74 |
| 2002 | 4.15 | 2020 | 4.48 |
Table text extracted from the original PDF; superscript letters are shown inline. The original table image is below.
View original table image
References
29 in the original paper- Carson R. Silent Spring. Boston: Houghton Mifflin; 1962.
- Convention on Biological Diversity. Global Biodiversity Outlook 5. Montreal: CBD Secretariat; 2020.
- Crutzen PJ. The Anthropocene. IGBP Glob Change Newsl. 2000;41:12-13.
- Daly HE. Beyond Growth: The Economics of Sustainable Development. Boston: Beacon Press; 1996.
- Dasgupta P. The Economics of Biodiversity: The Dasgupta Review. London: HM Treasury; 2021.
- Food and Agriculture Organization. Global Forest Resources Assessment 2020. Rome: FAO; 2020.
- Gadgil M, Guha R. Ecology and Equity. London: Penguin Books; 1995.
- Giddens A. The Politics of Climate Change. Cambridge: Polity Press; 2009.
- Government of India. India State of Forest Report 2021. Dehradun: Forest Survey of India; 2022.
- Guha R. Environmentalism: A Global History. Harlow: Longman; 2000.
- Hansen J, Fung I, Lacis A, Rind D, Lebedeff S, Ruedy R, Russell G, Stone P. Global climate changes as forecast by Goddard Institute for Space Studies threedimensional model. J Geophys Res. 1988;93(D8):93419364.
- IPCC. Climate Change 2021: The Physical Science Basis. Contribution of Working Group I to the Sixth Assessment Report. Cambridge: Cambridge University Press; 2021.
- Lovejoy TE. Changes in biological diversity. In: Barney GO, editor. The Global 2000 Report to the President. Oxford: Pergamon Press; 1980. p. 327-332.
- Mann ME, Bradley RS, Hughes MK. Northern Hemisphere temperatures during the past millennium: inferences, uncertainties, and limitations. Geophys Res Lett. 1999;26(6):759-762.
- Ministry of Environment, Forest and Climate Change. Annual Report 2021-22. New Delhi: Government of India; 2022.
- Myers N. The biodiversity challenge: expanded hotspots analysis. Environist. 1990;10(4):243-256.
- Narain S, editor. State of India's Environment 2020. New Delhi: Centre for Science and Environment; 2020.
- Nordhaus WD. Projections and uncertainties about climate change in an era of minimal climate policies. Am Econ J Econ Policy. 2018;10(3):333-360.
- Ostrom E. Governing the Commons: The Evolution of Institutions for Collective Action. Cambridge: Cambridge University Press; 2009.
- Pachauri RK, Reisinger A, editors. IPCC Fourth Assessment Report: Climate Change 2007 Synthesis Report. Geneva: IPCC; 2007.
- Rockstrom J, Steffen W, Noone K, Persson A, Chapin FS, Lambin EF, et al. A safe operating space for humanity. Nature. 2009;461:472-475.
- Sen A. Development as Freedom. Oxford: Oxford University Press; 1999.
- Shiva V. Staying Alive: Women, Ecology and Development. London: Zed Books; 1988.
- Stern N. The Economics of Climate Change: The Stern Review. Cambridge: Cambridge University Press; 2006.
- Swaminathan MS. From Green Revolution to Evergreen Revolution. New Delhi: Academic Foundation; 2010.
- Tilman D, Knops J, Wedin D, Reich P, Ritchie M, Siemann E. The influence of functional diversity and composition on ecosystem processes. Science. 1997;277(5330):1300-1302.
- UNEP. Making Peace with Nature: A Scientific Blueprint to Tackle the Climate, Biodiversity and Pollution Emergencies. Nairobi: UNEP; 2021.
- World Bank. World Development Indicators 2023. Washington: World Bank Group; 2023.
- WWF. Living Planet Report 2022: Building a NaturePositive Society. Gland: WWF International; 2022.