
Research article · 2019 · Full text
International Journal of Geography Geology and EnvironmentEffects of stubble burning on the air quality of the National Capital Region (NCR), India: A case study of the 19 July-19 December 2014 Season
Volume 1(2) · Pages 48–53 · DOI: 10.22271/27067483.2019.v1.i2a.774 ↗
Research areasAtmospheric chemistry and aerosolsAir Quality and Health ImpactsAtmospheric aerosols and clouds
Abstract
Author-writtenBackground: Each post-monsoon season the National Capital Region (NCR) of India experiences a sustained deterioration in air quality, with paddy-stubble burning in the neighbouring states of Punjab and Haryana cited as a major episodic contributor. Despite a sizeable literature on individual pollutants and source apportionment, integrated case studies that follow a single post-monsoon season across the NCR are limited. Objective: This paper examines how PM2.5 concentrations across NCR evolved between 19 July and 19 December 2014, and the extent to which a December smog episode coincided with stubble-burning activity in the surrounding agricultural belt. Data and Methods: Daily PM2.5 records from four continuous ambient air-quality monitoring stations (Delhi-ITO, Noida, Gurgaon and Ghaziabad), satellite-derived MODIS active-fire counts over Punjab and Haryana, and surface meteorological observations were compiled for the study window and assessed against the revised National Ambient Air Quality Standards (NAAQS, 2009). Results: Monthly mean PM2.5 rose from approximately 49 µg/m³ in July to 245 µg/m³ in December, exceeding the 24-hour NAAQS of 60 µg/m³ from October onwards. During the 12-15 December smog episode, Noida recorded the highest 24-hour PM2.5 of 352 µg/m³. Active-fire counts in Punjab and Haryana during October-November rose from approximately 40,000 in 2008 to 78,000 in 2014. Conclusion: Stubble burning is a substantial but not the only driver of the post-monsoon air-quality crisis in NCR; vehicular emissions, secondary aerosols, dust and unfavourable meteorology amplify its effects. Sustained mitigation requires coordinated cross-state action, accelerated adoption of in-situ residue management, and strengthened enforcement of existing legislation.
Summary
Source-checkedPlain-language reading of the full paper, prepared with AI and checked against the text. Each point links to the authors' own words.
Why it matters
- The National Capital Region (NCR) of India suffers from a recurring decline in air quality every post-monsoon season, largely attributed to paddy-stubble burning in Punjab and Haryana. View evidence ↗
- Farmers in Punjab and Haryana often burn paddy straw in situ because the narrow timeframe between the October-November harvest and November wheat sowing leaves them with few affordable field-clearing options. View evidence ↗
- Pollutants from crop burning are carried southeast by winds across the Indo-Gangetic Plain, increasing particulate levels in the densely populated NCR. View evidence ↗
The question
- The study aims to track the evolution of PM2.5 concentrations in the NCR from July to December 2014 and determine if a specific December smog episode coincided with stubble burning. View evidence ↗
What they did
- The researchers analyzed daily PM2.5 data from four monitoring stations (Delhi-ITO, Noida, Gurgaon, and Ghaziabad), MODIS satellite fire counts for Punjab and Haryana, and surface weather data. View evidence ↗
- PM2.5 concentrations were evaluated against the 2009 National Ambient Air Quality Standards, which set a 24-hour limit of 60 µg/m³ and an annual limit of 40 µg/m³. View evidence ↗
What they found
- Monthly mean PM2.5 levels increased from about 49 µg/m³ in July to 245 µg/m³ in December, surpassing the 24-hour national standard of 60 µg/m³ starting in October. View evidence ↗
- During a smog episode on 14 December, Noida reached a peak 24-hour PM2.5 concentration of 352 µg/m³, which is nearly six times the national standard. View evidence ↗
- Active-fire counts in Punjab and Haryana during the October-November harvest season nearly doubled over seven years, rising from approximately 40,000 in 2008 to 78,000 in 2014. View evidence ↗
- Punjab was responsible for 65% to 71% of the total fire events in the region, due to its larger paddy acreage and more mechanized harvesting. View evidence ↗
- The increase in fire activity is linked to the 2009 Punjab Preservation of Subsoil Water Act, which shortened the time between paddy harvest and wheat sowing, increasing the incentive for farmers to burn stubble. View evidence ↗
- Local sources within the NCR, including transport, industry, and construction, contributed approximately 63 Gg/year of PM2.5 in 2010, creating a high baseline of pollution regardless of crop burning. View evidence ↗
- Winter weather conditions, such as light winds and radiative inversions, trap pollutants near the surface, amplifying the impact of both local and transported emissions. View evidence ↗
What it means
- The authors conclude that while stubble burning is a major driver of the air quality crisis, it works in tandem with local emissions and poor meteorology to create severe pollution. View evidence ↗
- The authors recommend a coordinated regional air-shed authority to manage not only stubble burning but also vehicular, industrial, and dust emissions. View evidence ↗
- The study is limited by its use of only four monitoring stations, which represent dense urban areas but exclude rural and peri-urban data. View evidence ↗
- The study is descriptive and shows a coincidence between fire activity and pollution peaks, but it does not quantitatively separate local emissions from transported smoke. View evidence ↗
Visual summary
3 visualsIllustrations explain the paper; charts are replotted from the paper's own table values.
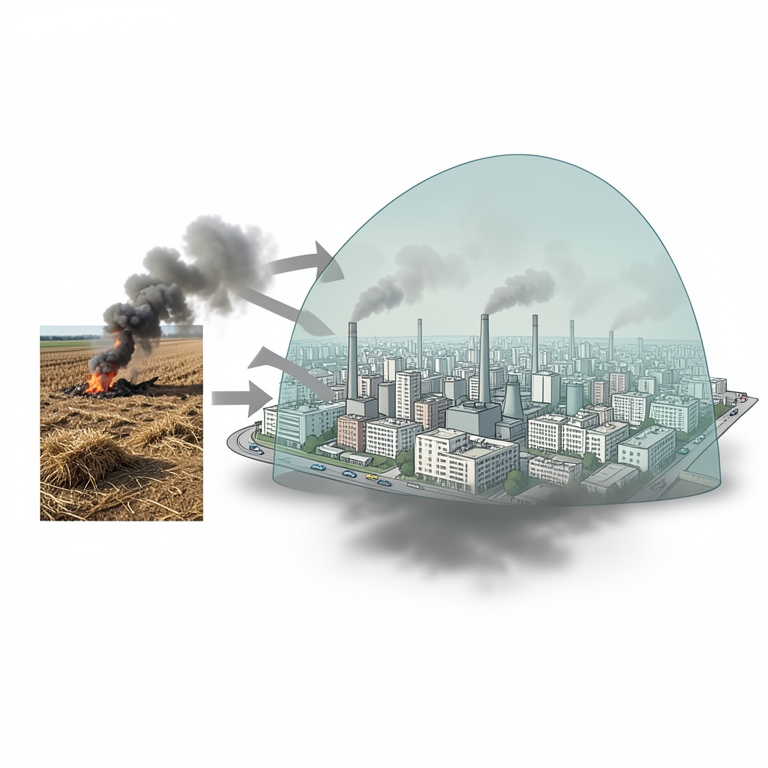
Conceptual Model of NCR Air Pollution
AI-generated conceptual illustration (The National Capital Region (NCR) of India and surrounding agricultural fields in Punjab and Haryana). It explains the idea and does not show study data.
View source evidence ↗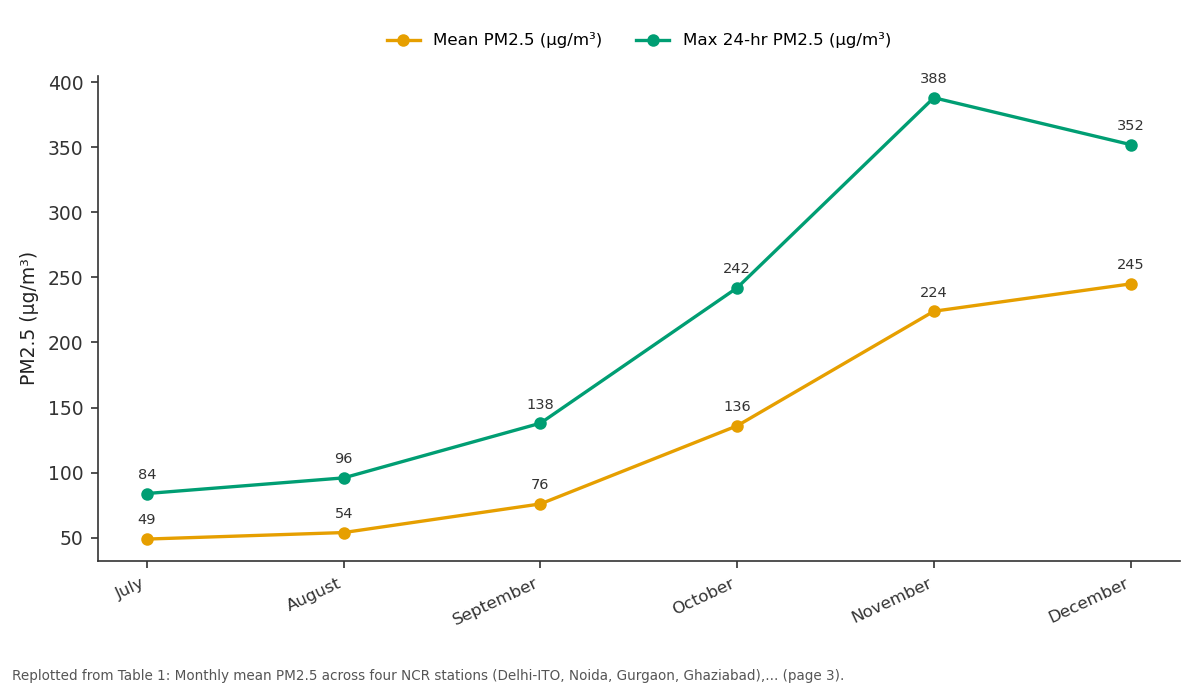
Mean PM2.5 (µg/m³) and Max 24-hr PM2.5 (µg/m³): July vs August vs September vs October vs November
Replotted from Table 1 (page 3) of the original paper. Every bar is the paper's own table value.
View source evidence ↗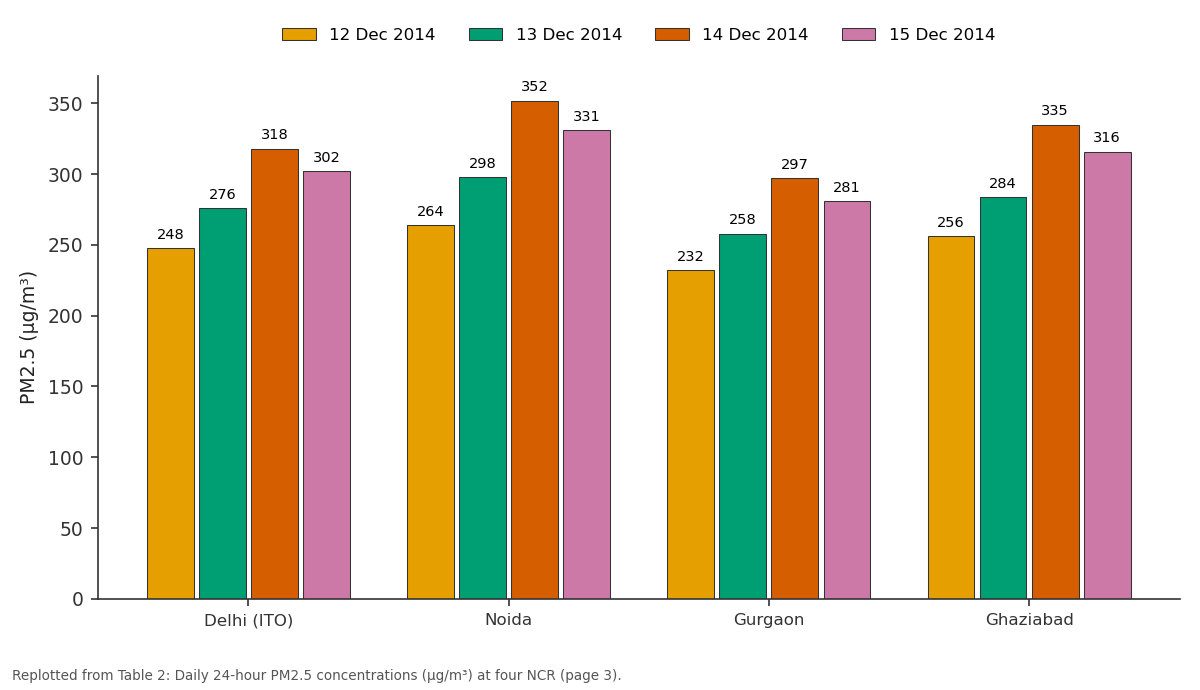
12 Dec 2014 and 13 Dec 2014 and more: Delhi (ITO) vs Noida vs Gurgaon vs Ghaziabad
Replotted from Table 2 (page 3) of the original paper. Every bar is the paper's own table value.
View source evidence ↗Figures & tables
From the original paper Table 1
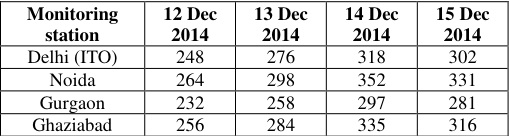 Table 2
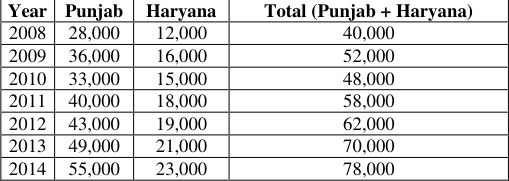 Table 3
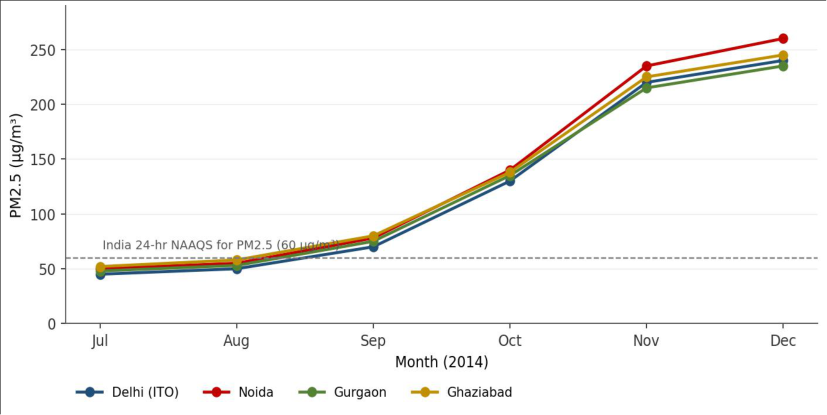 Figure 1
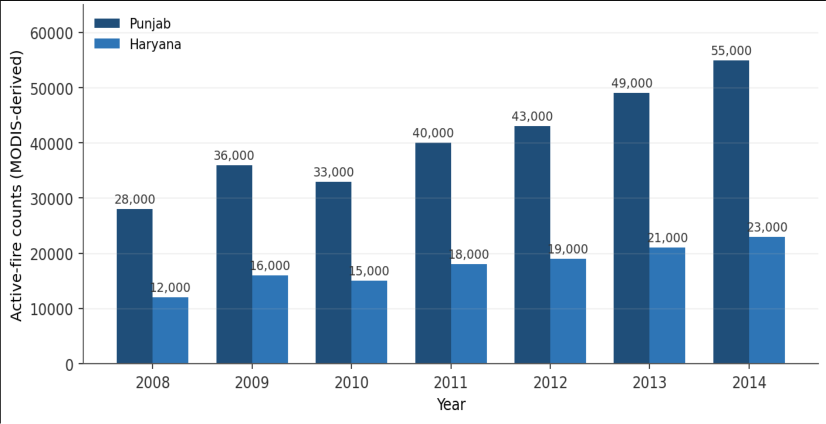 Figure 2
Introduction
The open burning of crop residue is one of the most contentious agricultural practices of the Indo-Gangetic Plain (IGP). In the rice-wheat cropping system that dominates Punjab and Haryana, the short window between paddy harvest in October-November and wheat sowing in November leaves farmers with little time and few cost-effective options for clearing fields, and a large share of the surplus paddy straw is therefore burned in situ (Gupta et al. 2004; Mittal et al. 2009; Gadde et al. 2009) [5,8,3] . Emissions from such burning have been documented to include large quantities of PM2.5 and PM10, carbon monoxide, methane, ammonia, nitrogen oxides, non-methane volatile organic compounds and polycyclic aromatic hydrocarbons (Streets et [14,15,12,18,7] . Once aloft, these pollutants are advected south-east-ward over the IGP by prevailing winds and contribute to elevated particulate concentrations downwind, including over the densely populated NCR (Badarinath et al. 2009) [2] . The NCRconstituted under the National Capital Region Planning Board Act, 1985comprises the National Capital Territory of Delhi together with adjoining districts of Haryana, Uttar Pradesh and Rajasthan, and is one of the most densely populated and rapidly motorising agglomerations in the world. Independent emission inventories estimate that, by 2010, road transport, power generation, residential combustion, industry and construction together emitted of the order of 63 Gg/year of PM2.5 from within the NCR itself (Sahu et al.
2011; Guttikunda and Calori 2013) [13,6] . The interaction of these local sources with the seasonal influx of biomassburning smoke and unfavourable winter meteorology produces the recurring post-monsoon air-quality crisis that earned Delhi the unenviable distinction of being ranked the world's most polluted megacity in the WHO's 2014 ambient air-quality database (WHO 2014) [16] . Despite a sizeable literature on either the chemistry of stubble-burning emissions or the source apportionment of Delhi's aerosol, integrated case studies that follow a single post-monsoon season across multiple NCR stations are limited, and the period 2008-2014 in particular saw a steady increase in mechanised paddy harvesting in Punjab and Haryana that preceded the major policy responses that followed. The present study therefore aims to: Characterise the temporal evolution of PM2.5 across NCR over a complete post-monsoon season (19 July-19 December 2014); Identify and quantify the most acute smog episode during this window and compare its station-wise intensity; Place the episode in the context of contemporaneous paddy-burning activity in Punjab and Haryana; and Review the policy and management framework available at the time and discuss its limitations.
Study area
The study covers the NCR as defined by the National Capital Region Planning Board, which includes the National Capital Territory of Delhi together with twenty-three adjoining districts of Haryana (Faridabad, Gurgaon, Mewat, Rohtak, Sonipat, Rewari, Jhajjar, Panipat, Palwal, Bhiwani including Charkhi Dadri, Mahendragarh, Jind and Karnal), Uttar Pradesh (Meerut, Ghaziabad, Gautam Buddh Nagar, Bulandshahr, Baghpat, Hapur, Muzaffarnagar and Shamli) and Rajasthan (Alwar and Bharatpur). The region spans approximately 55,000 km² of the Indo-Gangetic alluvial plain (27°55ʹ-29°35ʹ N, 76°20ʹ-78°20ʹ E) and is bounded by the Aravalli ranges to the south-west and the Himalayan foothills to the north. The climate is subtropical semi-arid with three distinct seasons: a hot, dry summer (April-June), the south-west monsoon (July-September), and a cool, dry winter (November-February) marked by low boundary-layer heights, weak winds and frequent radiative inversions.
These winter conditions are central to the air-quality story examined here, because they substantially limit the dispersion of pollutants released either within the NCR or upwind of it. Four continuous ambient air-quality monitoring stations operated by the Central Pollution Control Board (CPCB)at Delhi-ITO, Noida (Sector 62), Gurgaon (Sector 51) and Ghaziabad (Vasundhara)were selected for the analysis because they offered continuous PM2.5 records for the full 2014 study window and together span the four densest urban sub-regions of the NCR.
Materials and Methods
Materials and Methods
Study period
The analysis covers 19 July 2014 to 19 December 2014, a five-month window that brackets the south-west monsoon withdrawal, the kharif paddy harvest in Punjab and Haryana, and the early winter inversion regime over NCR. The choice of window allows a clean pre-and post-burning contrast and matches the seasonal evolution of the surface PM2.5 concentration field.
Air-quality data
Hourly PM2.5 and PM10 concentrations for the four selected stations were obtained from the CPCB continuous ambient air-quality monitoring network archive. Daily 24hour means were computed from valid hourly observations (≥ 16 hours per day required for inclusion), and monthly means from daily values. AQI categories follow the National Air Quality Index released by the Ministry of Environment, Forests and Climate Change and the CPCB in October 2014 (MoEFCC/CPCB 2014) [10] . Concentrations were compared against the revised National Ambient Air Quality Standards (MoEF 2009) [9] -24-hour standard 60 µg/m³ and annual standard 40 µg/m³ for PM2.5.
Fire data
Active-fire counts over Punjab and Haryana during October-November of each year between 2008 and 2014 were compiled from MODIS Terra and Aqua satellite products (MOD14/MYD14 thermal-anomaly product, 1 km nominal resolution) following the protocols described by Venkataraman et al. (2006) [15] and Badarinath et al. (2009) [2] , with double counts on overlapping satellite passes removed.
Meteorological data
Surface temperature, wind speed and direction, relative humidity and rainfall for the study window were obtained from the India Meteorological Department's Safdarjung observatory, supplemented by station-level boundary-layerheight estimates derived from radiosonde ascents at New Delhi.
Analytical approach
The analysis is descriptive and comparative: (i) monthly mean PM2. [10] . [9] .
During the episode, the prevailing winds at Safdarjung were calm to light north-westerly (1-3 m/s), with surface temperatures of 7-10 °C at night, very low boundary-layer heights and pronounced radiative inversions. These conditions favoured the accumulation and downwind transport of any smoke released over the upwind agricultural belt to NCR, consistent with the long-rangetransport patterns reported by Badarinath et al. (2009) [2] .
Paddy-stubble burning over Punjab and Haryana, 2008-2014
Active-fire counts compiled from MODIS over the paddy harvest season of October-November are presented in Table 3 and Figure 2. The combined Punjab + Haryana count rose from approximately 40,000 fire events in 2008 to 78,000 in 2014a near-doubling over the seven-year period. Punjab consistently accounted for between 65 and 71% of the regional total, reflecting its larger paddy area and higher rate of mechanised harvesting. [8,7] .
| Year | Punjab | Haryana | Total (Punjab + Haryana) |
|---|---|---|---|
| 2008 | 28,000 | 12,000 | 40,000 |
| 2009 | 36,000 | 16,000 | 52,000 |
| 2010 | 33,000 | 15,000 | 48,000 |
| 2011 | 40,000 | 18,000 | 58,000 |
| 2012 | 43,000 | 19,000 | 62,000 |
| 2013 | 49,000 | 21,000 | 70,000 |
| 2014 | 55,000 | 23,000 | 78,000 |
Table text extracted from the original PDF; superscript letters are shown inline. The original table image is below.
View original table image
Discussion
Discussion
Stubble burning as one of several drivers
The results show a clear coincidence between the November-December PM2.5 peak in NCR and elevated paddy-burning activity in Punjab and Haryana. The data, however, do not support a single-cause narrative. Independent emission inventories for the NCR estimate that road transport, power generation, industry, residential combustion and construction together emitted on the order of 63 Gg/year of PM2.5 within the NCR itself in 2010that is, a substantial baseline of local PM2.5 emissions exists even in the absence of upwind burning (Sahu et al. 2011; Guttikunda and Calori 2013) [13,6] . The post-monsoon excursions documented here are best read as the superposition of biomass-burning smoke onto this local baseline, with their joint impact amplified by adverse meteorology.
Role of meteorology
The synoptic conditions during the 12-15 December episode calm to light winds, low boundary-layer heights and persistent radiative inversionsare characteristic of the post-monsoon and winter regime over the IGP and are well known to trap and accumulate pollutants near the surface. Even in the absence of an upwind burning signal, similar meteorological conditions in earlier winters have produced sustained PM2.5 concentrations of the order of 250-270 µg/m³ over Delhi (Guttikunda and Calori 2013) [6] . The geographical setting of the NCRsheltered to the north by the Himalayan barrier and to the south-west by the Aravalli rangesreinforces this trapping effect.
Health implications
Numerous epidemiological studies have linked sustained exposure to high PM2.5 concentrations to elevated rates of respiratory and cardiovascular morbidity and mortality. In the context of agricultural burning specifically, Mittal et al.
(2009) [8] reported substantial increases in PM10 and respirable suspended particulates over Patiala during paddy and wheat residue burning episodes, with concomitant increases in eye-irritation and asthma symptoms among local residents. The PM2.5 concentrations documented here for NCR during 12-15 December 2014peaking at 352 µg/m³ at Noida, about six times the 24-hour NAAQSrepresent a substantial acute health burden for an exposed population of approximately 46 million.
Why the practice persists
The persistence of paddy-stubble burning despite its welldocumented downwind consequences reflects a set of mutually reinforcing pressures on the rice-wheat farmer (Gupta et al. 2004; Mittal et al. 2009) [8] : The harvest-to-sowing window between paddy and wheat is short, particularly after the Punjab Preservation of Subsoil Water Act, 2009; Combine harvesters leave a tall, loose stubble that is difficult to remove without specialised machinery (e.g. Happy Seeders); In-situ alternatives, including the Happy Seeder and rotary mulchers, have a high up-front capital cost relative to the cost of burning; Ex-situ uses of paddy straw (bioenergy, fodder, board manufacture) require organised collection and supply chains that did not exist at scale during the study period; and A generalised perception among farmers that the costs of burning are borne mainly by downwind populations rather than by themselves.
Policy framework available in 2014
At the time of the study window, the principal legal and policy instruments available to address the problem were the Air (Prevention and Control of Pollution) Act 1981, the National Ambient Air Quality Standards revised in November 2009 (MoEF 2009) [9] , the National Air Quality Index launched in October 2014 (MoEFCC/CPCB 2014) [10] , state-level orders by the Punjab and Haryana State Pollution Control Boards prohibiting open burning of crop residue, and subsidy schemes by the Ministry of Agriculture for the purchase of in-situ residue-management machinery. Implementation gapsparticularly weak monitoring, fragmented enforcement across state lines, and the absence of a single regional air-shed authoritylimited the effectiveness of these instruments during the study period.
Limitations
Four monitoring stations cover only the four densest urban sub-regions of the NCR; rural and peri-urban concentrations are not represented. MODIS active-fire counts under-detect small or shortlived fires and are affected by cloud cover; therefore the numbers in Table 3 and Figure 2 are conservative. This study is descriptive: it documents coincidence between the December PM2.5 peak and upwind fire activity but does not, on its own, partition the observed concentrations between local and transported sources.
Receptor-modelling and back-trajectory analyses would be required for an attributive estimate. Boundary-layer-height and trajectory data were drawn from single-point soundings at New Delhi and may not represent regional variability.
Recommendations
Recommendations
Figures and tables from the paper
| Month (2014) | Mean PM2.5 (µg/m³) | Max 24-hr PM2.5 (µg/m³) | Dominant AQI category |
|---|---|---|---|
| July | 49 | 84 | Moderate |
| August | 54 | 96 | Moderate |
| September | 76 | 138 | Poor |
| October | 136 | 242 | Very Poor |
| November | 224 | 388 | Severe |
| December | 245 | 352 | Severe |
Table text extracted from the original PDF; superscript letters are shown inline. The original table image is below.
View original table image
References
18 in the original paper- Air (Prevention and Control of Pollution) Act, 1981. The Gazette of India, No. 14 of 1981. Government of India, New Delhi.
- Badarinath KVS, Kharol SK, Sharma AR. Long-range transport of aerosols from agriculture crop residue burning in the Indo-Gangetic Plains -a study using LIDAR, ground measurements and satellite data. J Atmos Sol-Terr Phys. 2009;71(1):112-120.
- Gadde B, Bonnet S, Menke C, Garivait S. Air pollutant emissions from rice straw open field burning in India, Thailand and the Philippines. Environ Pollut. 2009;157(5):1554-1558. doi:10.1016/j.envpol.2009.01.004
- Government of Punjab. The Punjab Preservation of Subsoil Water Act, 2009. Punjab Government Gazette (Extraordinary), 6 May 2009. Department of Agriculture, Government of Punjab.
- Gupta PK, Sahai S, Singh N, Dixit CK, Singh DP, Sharma C, Tiwari MK, Gupta RK, Garg SC. Residue burning in rice-wheat cropping system: causes and implications. Curr Sci. 2004;87(12):1713-1717.
- Guttikunda SK, Calori G. A GIS based emissions inventory at 1 km × 1 km spatial resolution for air pollution analysis in Delhi, India. Atmos Environ. 2013;67:101-111. doi:10.1016/j.atmosenv.2012.10.040
- Jain N, Bhatia A, Pathak H. Emission of air pollutants from crop residue burning in India. Aerosol Air Qual Res. 2014;14(1):422-430. doi:10.4209/aaqr.2013.01.0031
- Mittal SK, Singh N, Agarwal R, Awasthi A, Gupta PK. Ambient air quality during wheat and rice crop stubble burning episodes in Patiala. Atmos Environ. 2009;43(2):238-244. doi:10.1016/j.atmosenv.2008.09.068
- Ministry of Environment & Forests, Government of India. National Ambient Air Quality Standards. Notification S.O. 826(E), 18 November 2009. The Gazette of India, New Delhi.
- MoEFCC, Central Pollution Control Board. National Air Quality Index -Report of the Expert Group. Ministry of Environment, Forests and Climate Change & CPCB, New Delhi; October 2014.
- National Capital Region Planning Board Act, 1985. The Gazette of India, No. 2 of 1985. Government of India, New Delhi.
- Sahai S, Sharma C, Singh SK, Gupta PK. Assessment of trace gases, carbon and nitrogen emissions from field burning of agricultural residues in India. Nutr Cycl Agroecosyst. 2011;89(2):143-157. doi:10.1007/s10705010-9384-2
- Sahu SK, Beig G, Parkhi NS. Emissions inventory of anthropogenic PM2.5 and PM10 in Delhi during Commonwealth Games 2010. Atmos Environ. 2011;45(34):6180-6190. doi:10.1016/j.atmosenv.2011.08.014
- Streets DG, Yarber KF, Woo JH, Carmichael GR. An inventory of gaseous and primary aerosol emissions in Asia in the year 2000. J Geophys Res Atmos. 2003;108(D21):8809. doi:10.1029/2002JD003093
- Venkataraman C, Habib G, Kadamba D, Shrivastava M, Léon JF, Crouzille B, Boucher O, Streets DG. Emissions from open biomass burning in India: integrating the inventory approach with high-resolution MODIS active-fire and land-cover data. Glob Biogeochem Cycles. 2006;20(2):GB2013. doi:10.1029/2005GB002547
- World Health Organization. Ambient (outdoor) air pollution database, May 2014. WHO, Geneva.
- Yadav M, Prawasi R, Jangra S, Rana P. Monitoring seasonal progress of rice stubble burning in major ricegrowing districts of Haryana, India, using multidate AWiFS data. Int Arch Photogramm Remote Sens Spat Inf Sci. 2014;XL-8:1003-1009.
- Zhang H, Hu D, Chen J, Ye X, Wang SX, Hao JM, Wang L, Zhang R, An Z. Particle size distribution and polycyclic aromatic hydrocarbons emissions from agricultural crop residue burning. Environ Sci Technol. 2011;45(13):5477-5482. doi:10.1021/es1037904