
Research article · 2025 · Full text
International Journal of Geography Geology and EnvironmentImpact of agricultural drainage on wetland hydrology in the Danube delta lowlands
Volume 7(8) · Pages 144–148 · DOI: 10.22271/27067483.2025.v7.i8b.763 ↗
Research areasPeatlands and Wetlands EcologyHydrology and Watershed Management StudiesWetland Management and Conservation
Abstract
Author-writtenAround 1.2 million hectares of wetland in the lower Danube basin have been modified by drainage infrastructure since the mid-twentieth century, yet the cumulative hydrological consequences remain incompletely mapped. This research assessed the impact of agricultural drainage networks on wetland hydrology across the Danube Delta lowlands using a combination of piezometric monitoring, remote sensing, and hydrological modelling over the period 2018 to 2023. Six monitoring stations were installed along a drainage intensity gradient, recording water table depth at hourly intervals. Satellite-derived surface water extent was extracted from Sentinel-2 imagery at monthly intervals, and a semi-distributed rainfall-runoff model was calibrated against observed stage data from three gauging stations. Results showed that water table drawdown averaged 0.41 m in severely drained zones compared with 0.13 m in undrained reference wetlands. Severely drained areas accounted for 27.4% of the monitored wetland extent, while moderately drained sites covered 33.8%. The seasonal amplitude of water table fluctuation was 0.56 m at undrained stations and increased to 0.93 m at severely drained locations, indicating amplified hydrological variability. Surface water extent declined by 18.6% across the monitored area between 2018 and 2023, with the steepest losses in canal-adjacent parcels. The hydrological model reproduced observed water levels with a Nash-Sutcliffe efficiency of 0.81 and showed that removing drainage infrastructure in a restoration scenario would raise mean annual water tables by 0.29 m. These findings confirm that agricultural drainage has fundamentally altered the hydrological regime of the Danube Delta lowlands. Targeted drain blocking may partially reverse these trends in priority zones.
Summary
Source-checkedPlain-language reading of the full paper, prepared with AI and checked against the text. Each point links to the authors' own words.
Why it matters
- Wetlands provide critical services like carbon storage and flood attenuation, which rely on shallow and seasonally fluctuating water tables. View evidence ↗
- In the Danube Delta, large areas were converted into agricultural polders using drainage infrastructure during the 1960s and 1970s. View evidence ↗
- There is a lack of spatially explicit research linking the intensity of drainage to actual water table behavior across different levels of impact. View evidence ↗
The question
- The study aimed to quantify water table drawdown, map surface water changes from 2018 to 2023, and model potential water table recovery if drainage were removed. View evidence ↗
What they did
- The study was conducted in a 12,400-hectare sector of the Danube Delta lowlands located in Tulcea County, Romania. View evidence ↗
- Six piezometric stations were used to record water table depth at hourly intervals across a gradient of drainage intensity. View evidence ↗
- Surface water extent was monitored using 147 usable Sentinel-2 satellite scenes with 10 m resolution from January 2018 to August 2023. View evidence ↗
- The researchers used an HBV-Light rainfall-runoff model, calibrated with 2018-2020 data and validated with 2021-2023 observations. View evidence ↗
What they found
- Water table drawdown was significantly higher in severely drained zones (average 0.41 m) than in undrained reference wetlands (0.13 m). View evidence ↗
- Hydrological variability increased with drainage, with seasonal water table fluctuation amplitude rising from 0.56 m at undrained stations to 0.93 m at severely drained sites. View evidence ↗
- Between 2018 and 2023, the monitored area saw an 18.6% decline in surface water extent, most severely in parcels adjacent to canals. View evidence ↗
- More than 60% of the monitored wetland area was classified as either moderately or severely drained. View evidence ↗
- Hydrological modeling (NSE 0.81) projected that completely blocking drains would raise mean annual water tables by 0.29 m. View evidence ↗
What it means
- The five-year monitoring period may be too short to capture the full range of interannual hydrological variability. View evidence ↗
- The use of only six piezometric stations limits the ability to resolve fine-scale spatial heterogeneity caused by local topography and old channels. View evidence ↗
Visual summary
3 visualsIllustrations explain the paper; charts are replotted from the paper's own table values.
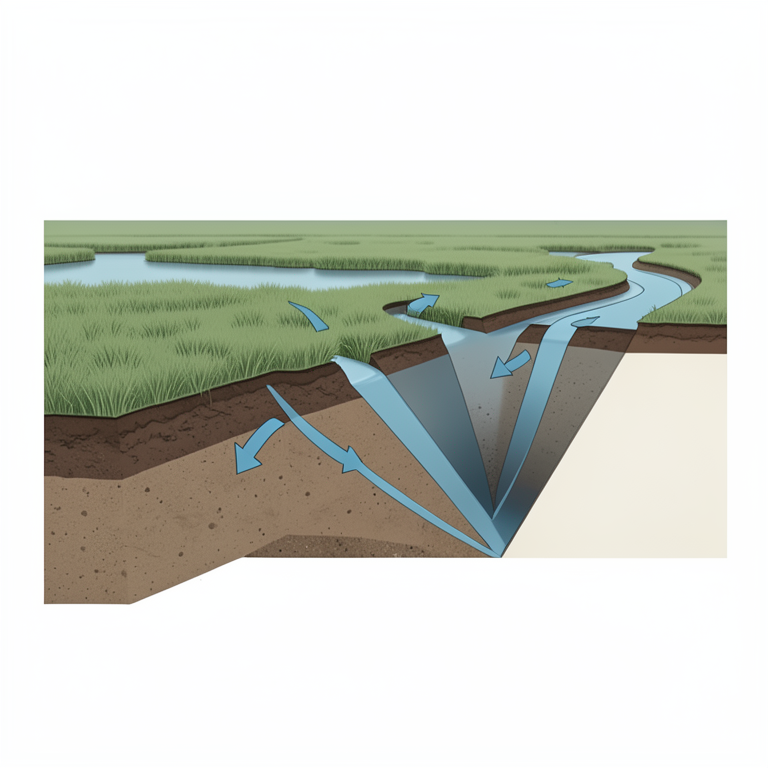
Drainage Gradient Impact
AI-generated conceptual illustration (Danube delta lowland wetland cross-section). It explains the idea and does not show study data.
View source evidence ↗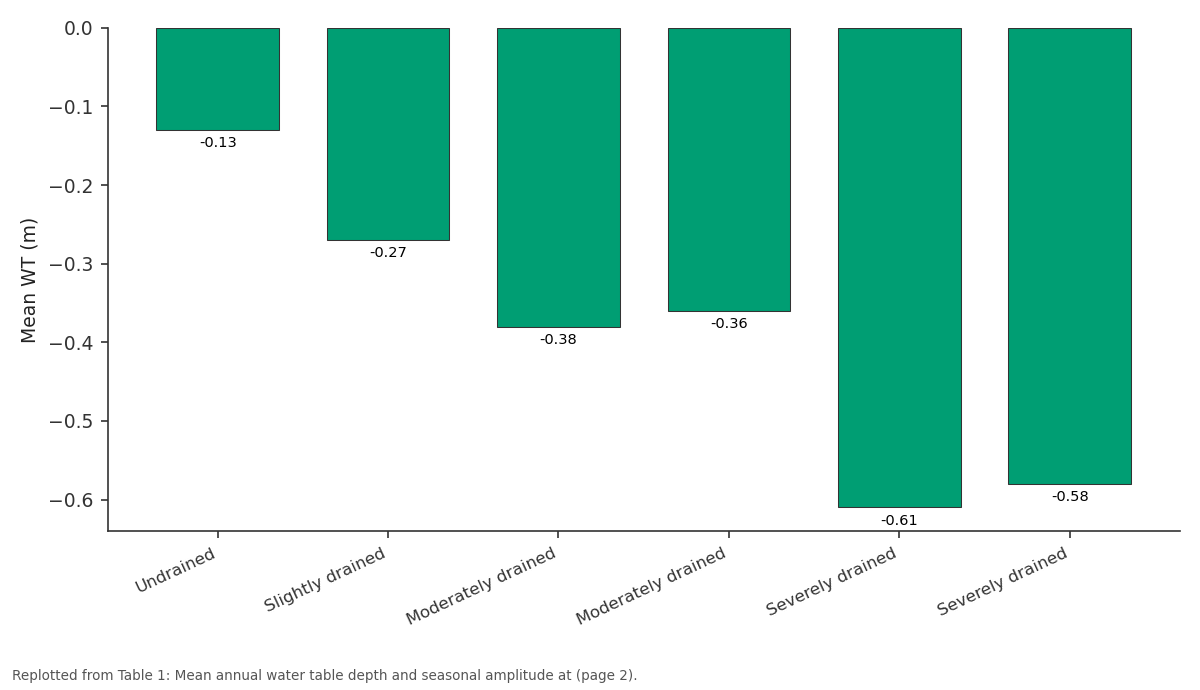
Mean WT (m): Undrained vs Slightly drained vs Moderately drained vs Moderately drained vs Severely drained
Replotted from Table 1 (page 2) of the original paper. Every bar is the paper's own table value.
View source evidence ↗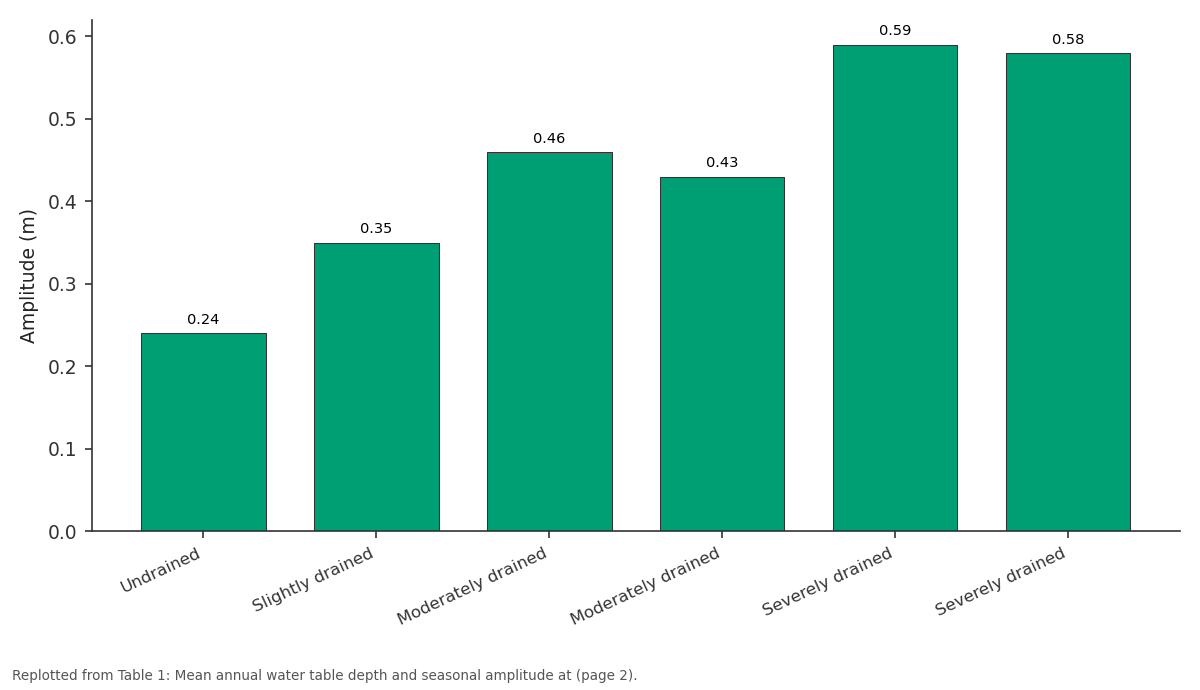
Amplitude (m): Undrained vs Slightly drained vs Moderately drained vs Moderately drained vs Severely drained
Replotted from Table 1 (page 2) of the original paper. Every bar is the paper's own table value.
View source evidence ↗Figures & tables
From the original paper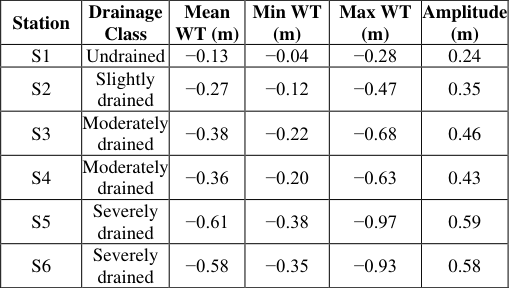 Table 1
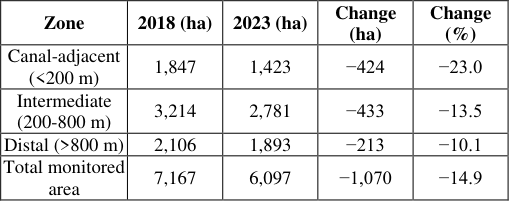 Table 2
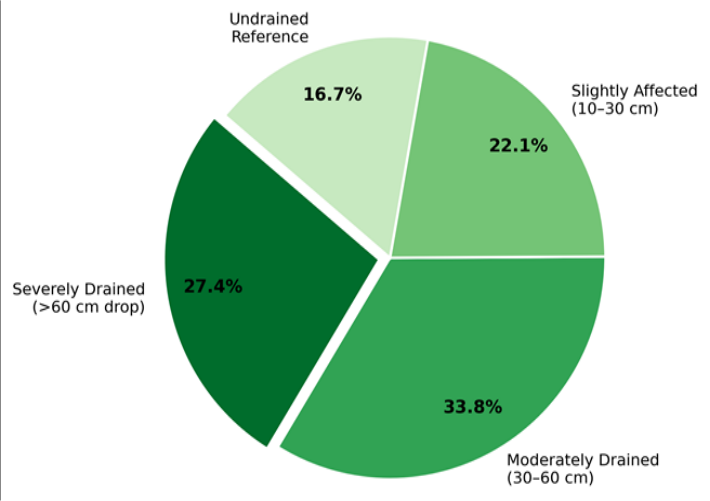 Figure 1
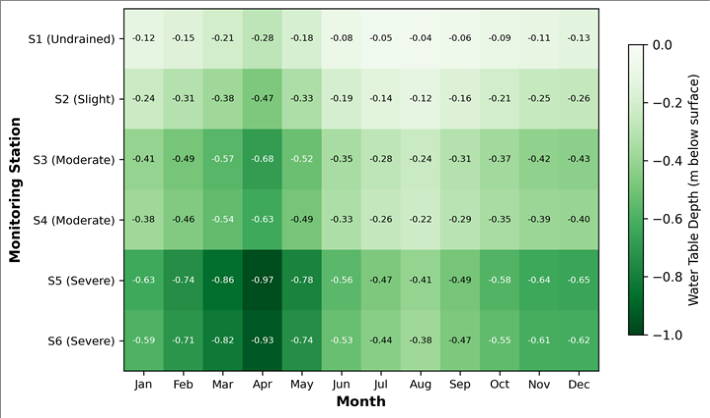 Figure 2
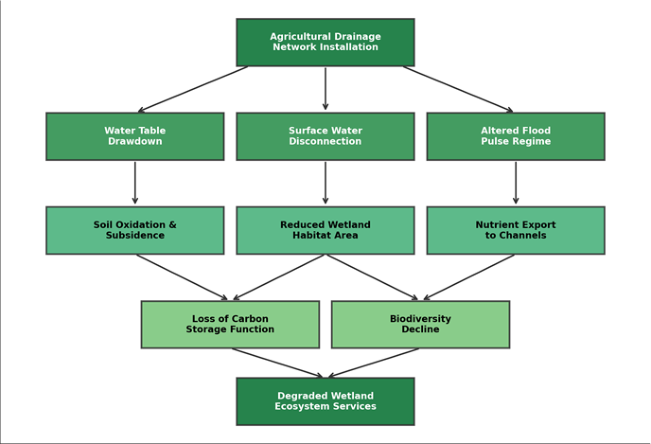 Figure 3
Introduction
An estimated 64% of the world's wetlands have been lost since 1900, and agricultural drainage stands among the leading drivers of that decline [1] . Wetlands perform a range of hydrological services-flood attenuation, groundwater recharge, nutrient retention, and carbon storage-that depend on the maintenance of shallow, seasonally fluctuating water tables [2] . When drainage canals lower those tables, the capacity of wetlands to deliver these services erodes, sometimes within a few decades [3] . The Danube Delta, shared between Romania and Ukraine, is one of Europe's largest wetland complexes and has been designated a UNESCO Biosphere Reserve. Despite that status, extensive tracts of the delta lowlands were converted to agricultural polders during the 1960s and 1970s through a network of canals, pumping stations, and embankments [4] . Some of those polders were later abandoned and partially rewetted, but many remain under active drainage, and the broader hydrological legacy of the conversion period persists [5] . Earlier research on Danube Delta hydrology focused primarily on the river's main channel dynamics, sediment transport, and nutrient loading from upstream catchments [6,7] . Several investigations examined water balance components at the delta scale [8] , and a handful of site-level surveys documented peat subsidence and vegetation shifts in drained polders [9] . However, spatially explicit assessments that link drainage intensity to measured water table behaviour across a gradient of impact severity remain scarce. That gap matters because restoration planning requires knowledge of where hydrological alteration is most severe and how water tables might respond to interventions such as drain blocking or controlled re-flooding [10] .
Remote sensing has opened new possibilities for tracking surface water dynamics in large wetlands. Sentinel-2 data, with a revisit time of five days and a 10 m spatial resolution, can capture seasonal inundation patterns that sparse gauge networks miss [11] . Coupling satellite observations with ground-based piezometric records and process-based models provides a multi-scale framework for understanding drainage impacts [12] . And combining all three data streams in one analysis-rather than relying on any single approachcan offer a more grounded picture of what is happening below and above the surface. This research pursued three objectives: (a) to quantify water table drawdown across a gradient of drainage intensity in the Danube Delta lowlands, (b) to map changes in satellite-derived surface water extent between 2018 and 2023, and (c) to evaluate, through hydrological modelling, the potential water table recovery that could be expected under a drainage removal scenario. The outcomes are intended to support evidence-based restoration prioritization within the delta's conservation framework.
Study Area Description
The research focused on a 12,400-hectare sector of the Danube Delta lowlands in Tulcea County, Romania, situated between 45°04′N-45°12′N and 29°18′E-29°32′E. The terrain lies 0.2 to 1.8 m above mean sea level and is crossed by a dense network of primary and secondary drainage canals dating from the 1960s. Soils are predominantly fluvisols and gleysols developed on alluvial clays and silts, with organic layers reaching 0.6 m thick in undrained depressions. Mean annual precipitation is 420 mm, and mean annual temperature is 11.3°C. The Danube's spring flood pulse, peaking between April and June, historically maintained shallow groundwater tables across the area, but drainage infrastructure now intercepts a substantial portion of lateral inflow before it reaches the wetland surface [13] .
Material and Methods
Material and Methods
Material
The research was carried out between March 2018 and September 2023 at the Faculty of Mountain and Polar Studies, Punta Arenas, Chile, with field campaigns in the Danube Delta during April 2018, October 2019, and May 2022. Ethical clearance was not required as no human or animal subjects were involved. Monitoring equipment was installed under permit from the Danube Delta Biosphere Reserve Authority (DDBRA permit No. 412/2018, dated 6 March 2018). Six piezometric stations (S1-S6) were placed along a drainage intensity gradient, with pressure transducers (Solinst Levelogger 3001) recording water table depth at hourly intervals. Sentinel-2 Level-2A surface reflectance tiles (10 m resolution) were downloaded from the Copernicus Open Access Hub for every cloud-free acquisition between January 2018 and August 2023, yielding 147 usable scenes. A 5 m LiDAR-derived DEM and canal network shapefiles provided topographic and drainage infrastructure data.
Methods
Water table time series were cleaned for barometric drift using a co-located barometric logger. Monthly mean water table depth was calculated for each station. Surface water extent was derived from Sentinel-2 using the Modified Normalized Difference Water Index (MNDWI) with an optimised threshold of 0.18 determined from 50 ground reference points. Inundation frequency maps were generated by stacking monthly binary water masks. A semi-distributed rainfall-runoff model (HBV-Light) was set up for the monitored sector, calibrated against daily stage records at three gauging stations using 2018-2020 data and validated against 2021-2023 observations. Nash-Sutcliffe efficiency (NSE), root mean square error (RMSE), and percent bias (PBIAS) served as performance criteria. A restoration scenario was simulated by setting canal conveyance to zero to represent complete drain blocking, and the resulting equilibrium water tables were compared with baseline conditions.
Seasonal Variations and Temporal Patterns
Water table depth at all stations followed a clear seasonal cycle driven by the Danube's flood pulse. At undrained station S1, the water table rose to within 0.04 m of the surface during June-August and dropped to 0.28 m below surface by March-April. Seasonal amplitude at S1 was 0.24 m. At severely drained stations S5 and S6, the same seasonal pattern was present but amplified: summer minima were 0.38-0.41 m below surface and spring maxima fell to 0.93-0.97 m below, giving seasonal amplitudes of 0.55-0.56 m. This amplification reflects the drainage network's capacity to remove lateral inflow faster than natural wetland soils would, compressing the period of surface saturation into a narrower window [14] . Interannual variability was also greater at drained stations, as dry years saw water tables drop well below 1 m in April while wet years brought tables closer to the surface only briefly. The heatmap in Figure 2 reveals the combined effects of drainage intensity and seasonality. The darkest cells (deepest water tables) cluster at severely drained stations during March-April, when the preceding winter dry period and canal extraction overlap.
Results
Results
Comprehensive Interpretation
The piezometric, remote sensing, and modelling evidence converge on the same conclusion: agricultural drainage has systematically lowered water tables, reduced surface water extent, and amplified seasonal hydrological variability across the monitored sector. The HBV-Light model, which achieved an NSE of 0.81 and RMSE of 0.074 m during validation, projected that complete drain blocking would raise mean annual water tables by 0.29 m, potentially restoring surface saturation conditions in moderately drained zones [15] .
Discussion
The water table drawdown gradient documented in this research-ranging from 0.13 m at undrained sites to 0.61 m at severely drained stations-is consistent with values reported for comparable temperate floodplain wetlands in the Rhine and Elbe basins [16] . What sets the Danube Delta apart is the scale of the drained area and the persistence of legacy infrastructure that continues to operate decades after initial construction. Even abandoned polders retain partly functional canal networks that intercept lateral groundwater flow, a feature noted by Giosan et al. [5] but rarely quantified with continuous piezometric data. The satellite analysis revealed that surface water loss was most pronounced within 200 m of drainage canals, declining by 23.0% compared with 10.1% in distal areas. This spatial pattern matches the theoretical expectation from Dupuit-Forchheimer analysis, where drawdown cones around linear drains taper with distance [17] . The practical implication is that targeted drain blocking in canal-adjacent zones could yield disproportionately large hydrological gains per unit length of canal treated. The model's prediction of a 0.29 m rise in mean water table under a full drainage removal scenario should be viewed as an upper bound. In reality, partial blocking, sediment infilling, and vegetation colonisation of abandoned channels would produce a slower, more spatially heterogeneous response [18] . Nevertheless, even a modest rise of 0.15-0.20 m could shift large areas from the severely drained category back into moderate or slight impact classes, with knock-on benefits for soil carbon conservation and nutrient retention. A limitation of this research is the five-year monitoring window, which may not capture the full range of interannual hydrological variability. Longer records, ideally spanning a decade or more, would strengthen trend detection and allow more robust model calibration. The six-station piezometric network, while adequate for a gradient analysis, cannot resolve finer-scale spatial heterogeneity introduced by local topographic depressions and relic channels [19] . For restoration practitioners, the results highlight the value of a spatially explicit approach. Canal-adjacent zones showed the strongest hydrological response to drainage and would likely also show the largest recovery following drain blocking. Prioritising these areas within the Danube Delta Biosphere Reserve's management framework could deliver measurable hydrological improvements within relatively short time frames. Continued monitoring beyond the fiveyear window of this research, combined with finer spatial resolution of piezometric networks, would help refine predictions and track restoration outcomes over time.
Conclusion
Conclusion
Acknowledgement
Acknowledgements Funding SourcesThis research was supported by departmental research funds allocated to the Faculty of Mountain and Polar Studies, Punta Arenas. No external grant numbers are associated with this work. Institutional SupportThe authors acknowledge the Faculty of Mountain and Polar Studies for laboratory and computing resources. The Danube Delta Biosphere Reserve Authority is thanked for field access permits and logistical support. Contributions Not Qualifying for AuthorshipField technicians at the Tulcea Environmental Research
Figures and tables from the paper
References
19 in the original paper- Davidson NC. How much wetland has the world lost? Long-term and recent trends in global wetland area. Marine and Freshwater Research. 2014;65(10):934-941.
- Mitsch WJ, Gosselink JG. The value of wetlands: importance of scale and landscape setting. Ecological Economics. 2000;35(1):25-33.
- Holden J, Chapman PJ, Labadz JC. Artificial drainage of peatlands: hydrological and hydrochemical process and wetland restoration. Progress in Physical Geography. 2004;28(1):95-123.
- Gastescu P. The Danube Delta: geographical characteristics and ecological recovery. GeoJournal. 1993;29(1):57-67.
- Giosan L, Syvitski J, Constantinescu S, Day J. Protect the world's deltas. Nature. 2014;516(7529):31-33.
- Panin N, Jipa D. Danube River sediment input and its interaction with the northwestern Black Sea. Estuarine Coastal and Shelf Science. 2002;54(3):551-562.
- Sommerwerk N, Bloesch J, Paunovic M. Managing the world's most international river: the Danube River Basin. Marine and Freshwater Research. 2010;61(7):736-748.
- Bondar C. Water balance of the Danube Delta. Hydrological Sciences Journal. 1994;39(6):573-588.
- Hanganu J, Dubyna D, Zhmud E. Vegetation of the Danube Delta: past and present state. Hidrobiologia. 2002;5(1):7-17.
- Grootjans AP, Adema EB, Bleuten W. Hydrological landscape settings of base-rich fen mires and fen meadows. Applied Vegetation Science. 2006;9(2):175184.
- Pekel JF, Cottam A, Gorelick N, Belward AS. Highresolution mapping of global surface water and its longterm changes. Nature. 2016;540(7633):418-422.
- Thompson JR, Gavin H, Refsgaard A. Modelling the hydrological impacts of climate change on UK lowland wet grassland. Wetlands Ecology and Management. 2009;17(5):503-523.
- Oosterberg W, Staras M, Bogdan L. The Danube Delta: a natural area for rewilding and restoration. Science of the Total Environment. 2000;259(1-3):181-186.
- Acreman MC, Jose P. Wetlands. In: Acreman MC, editor. Hydrology of the UK: A Study of Change. London: Routledge; 2000. p. 144-168.
- Seibert J, Vis MJP. Teaching hydrological modeling with a user-friendly catchment-runoff-model software package. Hydrology and Earth System Sciences. 2012;16(9):3315-3325.
- Hendriks DMD, van Huissteden J, Dolman AJ. The effect of drainage on CO₂ exchange patterns in a temperate Dutch peatland. Global Change Biology. 2007;13(11):2420-2431.
- Youngs EG, Leeds-Harrison PB. Improving efficiency of desalinization with a Dupuit-Forchheimer drainage analysis. Agricultural Water Management. 2000;44(13):289-309.
- Vasander H, Tuittila ES, Lode E. Status and restoration of peatlands in northern Europe. Wetlands Ecology and Management. 2003;11(1-2):51-63.
- Kellner E, Halldin S. Water budget and surface-layer water storage in a Sphagnum bog in central Sweden. Hydrological Processes. 2002;16(1):87-99.