
Research article · 2023 · Full text
International Journal of Agriculture and NutritionAssessing the nutritional security implications of climate-induced paddy yield decline in rural farming communities of East Africa
Volume 5(1) · Pages 65–70 · DOI: 10.33545/26646064.2023.v5.i1a.644 ↗
Research areasClimate change impacts on agricultureFood Security and Socioeconomic DynamicsChild Nutrition and Water Access
Abstract
Author-writtenClimate variability poses a direct threat to paddy-dependent rural communities in East Africa, yet its downstream effects on household nutritional status remain poorly quantified. This research examined the link between climate-induced rice yield decline and nutritional security indicators among 276 farming households in Kirinyaga and Mwea divisions of central Kenya, where irrigated and rain-fed paddy systems co-exist under increasingly erratic rainfall conditions. A mixed-methods cross-sectional design was used between January 2024 and July 2024. Structured interviews collected data on rice output over the previous three seasons, household dietary diversity scores (HDDS), food consumption scores (FCS), and anthropometric measurements of children under five years. Pearson correlation, paired-sample comparisons, and multiple linear regression were applied. Results showed that mean paddy yield declined from 3.1 tonnes per hectare in the 2021/22 season to 2.3 tonnes per hectare in the 2023/24 season, a drop of 25.8%. Households experiencing yield losses exceeding 30% reported significantly lower HDDS (mean 4.1 vs. 5.9, p<0.001) and lower FCS (mean 28.3 vs. 42.7, p<0.001) compared with households whose yields remained stable. A positive correlation was observed between current-season paddy yield and HDDS (r = 0.58, p<0.001). Among children under five in yield-affected households, stunting prevalence reached 38.4% compared with 21.7% in stable-yield households. Regression analysis identified yield change, maternal education, and market distance as significant predictors of HDDS, collectively explaining 41% of variance. The schematic framework developed from these findings illustrates how climate stressors cascade through agricultural production losses, market price volatility, and income reduction to produce measurable nutritional deficits. These results confirm that paddy yield decline is not merely an agricultural concern but a nutritional emergency in rice-dependent communities. Interventions should bridge the agriculture-nutrition divide by embedding dietary counselling within extension services and promoting bio-fortified rice varieties that maintain micronutrient density under water-stressed conditions.
Summary
Source-checkedPlain-language reading of the full paper, prepared with AI and checked against the text. Each point links to the authors' own words.
Why it matters
- Rice is the fastest-growing staple cereal in East Africa, with per capita consumption increasing by approximately 6% every year for the last ten years. View evidence ↗
- In Kenya, the Mwea Irrigation Scheme and Kirinyaga County lowlands produce about 80% of the national rice supply, supporting over 50,000 farming households. View evidence ↗
- Families relying on one staple crop for both food and income suffer a double loss when yields drop: they have less food to eat and less money to buy other nutrients. View evidence ↗
The question
- The study aimed to measure rice yield declines in Kirinyaga County from 2021/22 to 2023/24 and compare nutritional security between households with severe losses and those with stable yields. View evidence ↗
- The researchers sought to create a framework showing how climate-driven yield drops lead to dietary and physical growth deficits. View evidence ↗
What they did
- The study used a random sample of 276 households from four sub-locations in Kirinyaga County, Kenya, including both irrigated and rain-fed systems. View evidence ↗
What they found
- Average rice yields dropped by 25.8%, falling from 3.1 tonnes per hectare in 2021/22 to 2.3 tonnes per hectare in 2023/24. View evidence ↗
- Households with over 30% yield loss had significantly lower dietary diversity (mean 4.1 vs 5.9) and food consumption scores (mean 28.3 vs 42.7) than stable-yield households. View evidence ↗
- Stunting in children under five was nearly double in yield-affected households (38.4%) compared to stable-yield households (21.7%). View evidence ↗
- Yield change, maternal education, and distance to markets were significant predictors of dietary diversity, together explaining 41% of the variance. View evidence ↗
What it means
- The authors recommend integrating dietary counseling into agricultural extension services and promoting bio-fortified rice that stays nutrient-dense during water stress. View evidence ↗
- Early-warning systems should use consecutive yield drops as a trigger to screen children for malnutrition and refer them to feeding programs. View evidence ↗
- The study relied on farmers' memories for past yields, which may be inaccurate despite some verification. View evidence ↗
- Because the study was cross-sectional, it shows associations but cannot prove that yield decline caused the nutritional deficits. View evidence ↗
Visual summary
2 visualsIllustrations explain the paper; charts are replotted from the paper's own table values.
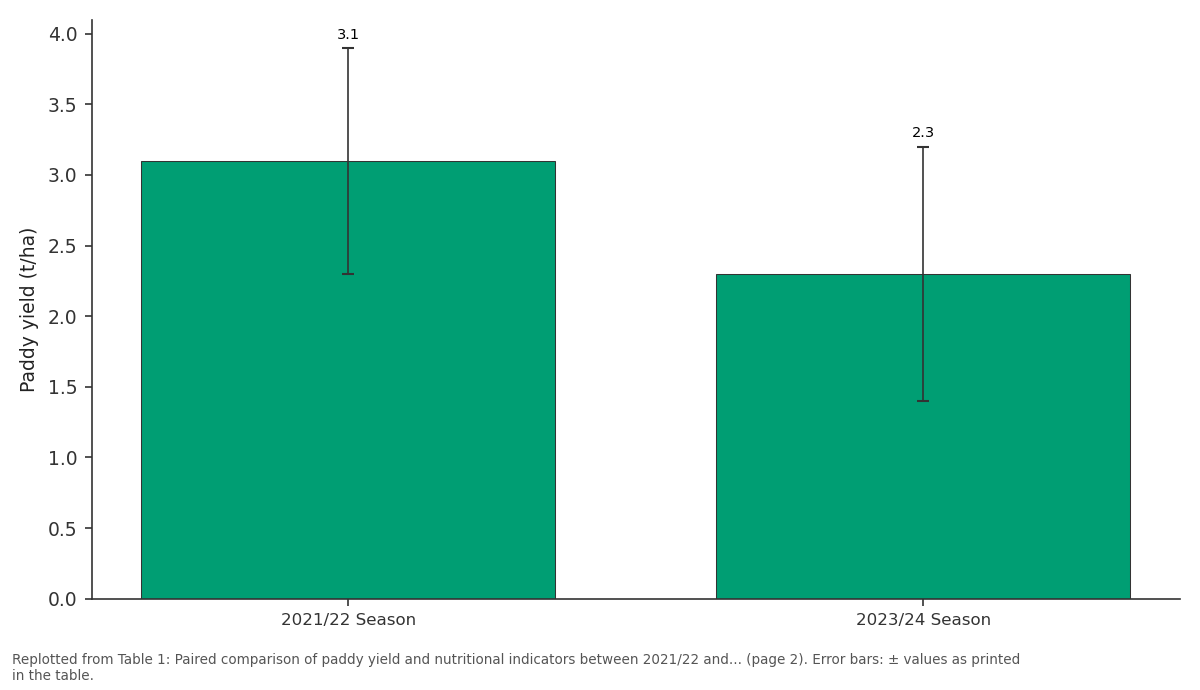
Paddy yield (t/ha): 2021/22 Season vs 2023/24 Season
Replotted from Table 1 (page 2) of the original paper. Every bar is the paper's own table value.
View source evidence ↗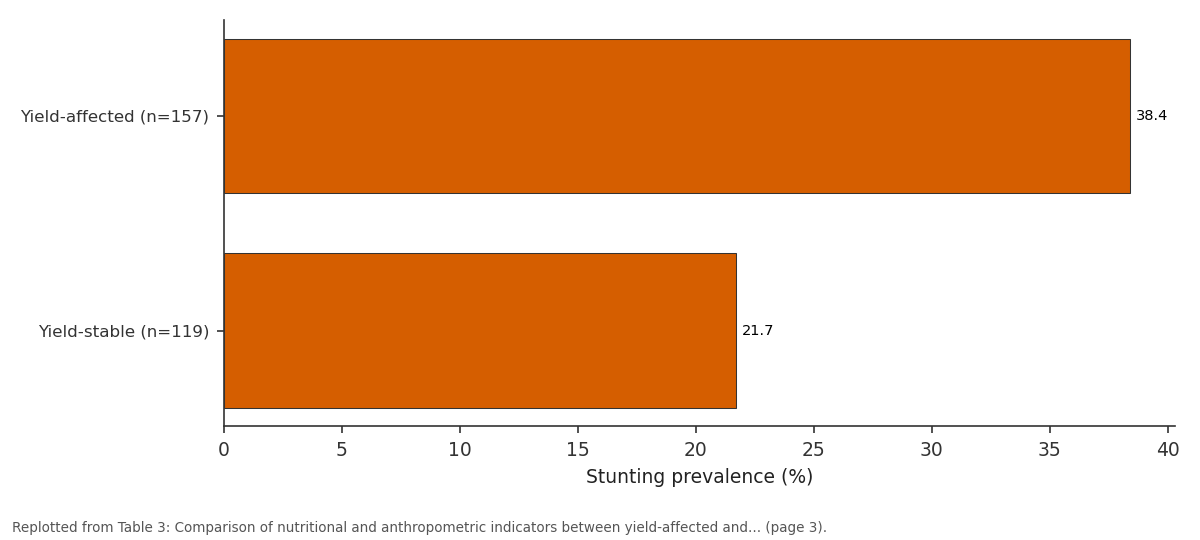
Stunting prevalence (%): Yield-affected (n=157) vs Yield-stable (n=119)
Replotted from Table 3 (page 3) of the original paper. Every bar is the paper's own table value.
View source evidence ↗Figures & tables
From the original paper Table 1
 Table 2
 Table 3
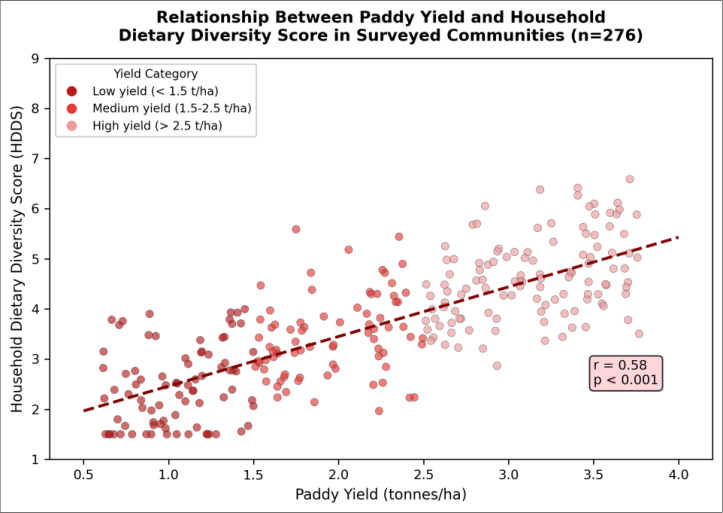 Figure 1
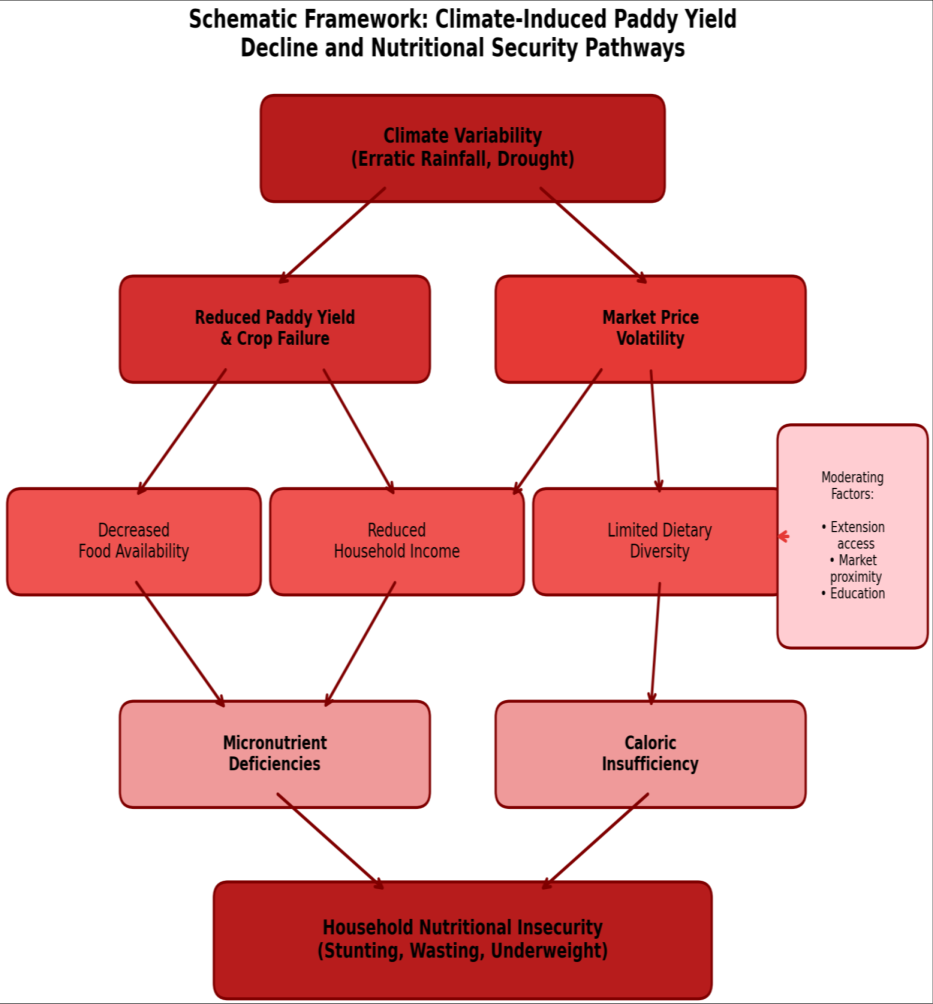 Figure 2
Introduction
Hunger does not begin with empty plates; it begins with failing harvests. Across East Africa, rice has become the fastest-growing staple cereal, with per capita consumption rising at roughly 6% annually over the past decade, yet domestic production has failed to keep pace, leaving a widening deficit that climate shocks are now accelerating [1] . In Kenya, paddy cultivation concentrates in the Mwea Irrigation Scheme and adjacent rain-fed lowlands of Kirinyaga County, supplying an estimated 80% of nationally produced rice and underpinning the caloric intake and cash income of more than 50,000 farming households [2] . When climate variability reduces paddy output, the consequences extend beyond lost revenue. Households that depend on a single staple crop for both food and market income face a double burden: the grain available for home consumption shrinks at the same time that purchasing power for alternative foods declines [3] . This nexus between crop failure and dietary deterioration has been documented for maize in southern Africa and for millet in the Sahel, but comparable evidence for rice-based systems in eastern Africa is scarce [4] . The nutritional pathway is not straightforward it passes through mediating variables such as market access, dietary knowledge, and intra-household allocation and without empirical mapping, policy responses risk treating symptoms rather than causes. Dietary diversity and food consumption scores are widely accepted proxy indicators of household nutritional adequacy because they capture both the quantity and variety of foods consumed over a recall period [5] . Stunting prevalence among children under five serves as a longer-term marker of chronic undernutrition and is sensitive to sustained shortfalls in energy and micronutrient intake [6] . Linking these indicators to season-specific yield data allows researchers to quantify the magnitude and speed of nutritional decline triggered by production shocks. Against this backdrop, the present research pursued two objectives. First, it measured the extent of paddy yield decline across three consecutive seasons (2021/22 to 2023/24) in Kirinyaga County and compared nutritional security indicators between households that experienced severe losses and those with relatively stable output. Second, it constructed a schematic framework tracing the pathways through which climate-induced yield reduction translates into measurable dietary and anthropometric deficits, identifying the mediating factors most amenable to intervention. By bridging the agriculture-nutrition evidence gap for East African rice systems, the findings aim to inform integrated programming that addresses food production and dietary quality simultaneously.
Material and Methods
Material and Methods
Material
This research was conducted in Kirinyaga County, central Kenya (0°31′S, 37°17′E), targeting paddy farming households within and surrounding the Mwea Irrigation Scheme. The area lies at approximately 1,100 m elevation, receiving bimodal rainfall of 850-1,050 mm annually, though recent seasons have shown marked departures from this average. Rice is grown under both canal-irrigated and supplementary rain-fed conditions; households typically cultivate 0.4-1.2 hectares and retain 30-45% of their harvest for home consumption [2] . A multi-stage sampling procedure was employed: four sub-locations were purposively selected for their mix of irrigated and rain-fed paddies, and within each sub-location 69 households were randomly drawn from agricultural officer registers, yielding 276 respondents. Data collection ran from January 2024 to July 2024. Pre-tested questionnaires recorded household demographics, paddy yield for the 2021/22, 2022/23, and 2023/24 seasons (verified against cooperative milling records where available), the 12-item Household Dietary Diversity Score, the Food Consumption Score using standard World Food Programme weighting, and child anthropometric measurements (height-for-age z-scores for children under five, taken by trained enumerators using SECA stadiometers).
Methods
Quantitative analysis was performed in R version 4.3.2. Descriptive statistics summarised yield trends and nutritional indicators. Paired-sample t-tests compared predecline (2021/22) and post-decline (2023/24) yield and HDDS means. Households were categorised into two groups: "yield-affected" (yield decline exceeding 30% over three seasons) and "yield-stable" (decline less than 10%), and independent-samples t-tests compared nutritional indicators between groups. Pearson correlation assessed the bivariate relationship between current-season yield and HDDS. A multiple linear regression model was fitted with HDDS as the dependent variable and yield change, maternal education, household size, market distance, and livestock ownership as predictors. Model assumptions were verified through residual plots, variance inflation factors (all below 2.3), and the Shapiro-Wilk normality test. Stunting prevalence (height-for-age z-score below -2) was compared between yield groups using the chi-square test. Qualitative data from six focus group discussions (three with women, three with men, 8-12 participants each) were thematically coded to contextualise statistical findings and inform the schematic pathway framework.
Ethical considerations
Ethical approval was obtained from the Nairobi Research Institute of Agricultural Nutrition Ethics Review Committee (Reference NRIAN/ERC/2023-041, approved 12 December 2023). Written informed consent was collected from all adult respondents. For anthropometric measurements of children under five, parental or guardian consent was obtained separately using a child-specific consent form translated into Kikuyu and Swahili. Respondents were informed of their right to withdraw at any stage. All data were anonymised using household identification codes, and electronic records were encrypted and stored on a passwordprotected institutional server. No biological samples were collected. Households identified with severely malnourished children during the survey were referred to the nearest health facility through existing community health volunteer networks. The scatter plot in Figure 1 displays the positive linear association between current-season paddy yield and HDDS across all 276 households, with colour coding distinguishing low-, medium-, and high-yield strata. Households clustered in the low-yield category tended to occupy the lower-left quadrant, indicating concurrent yield and dietary deficits.
Results
Results
Comprehensive interpretation
Multiple linear regression confirmed that yield change (β = 0.38, p<0.001), maternal education (β = 0.24, p = 0.003), and market distance (β = -0.19, p = 0.018) were significant predictors of HDDS, with the full model explaining 41% of variance (adjusted R² = 0.41, F = 18.7, p<0.001). Household size and livestock ownership did not reach significance. The regression results confirm that yield decline exerts the largest independent effect on dietary diversity, but this effect is moderated by education and access to food markets. Focus group narratives reinforced the statistical picture: women in yield-affected households described replacing rice-based meals with lower-cost cassava flour and reducing the frequency of protein-rich foods such as eggs and legumes to two or three times per week, down from neardaily consumption before the yield downturn. Men emphasised the loss of cash income from rice sales as the binding constraint, noting that medical expenses and school fees competed directly with food purchases during lean months.
Discussion
The 25.8% decline in mean paddy yield over three seasons corresponds closely with downward rainfall trends reported by the Kenya Meteorological Department for the central highlands, where the long rains in 2023 fell 18% below the twenty-year average [7] . A parallel investigation in Mwea found a 22% production shortfall during the same period, pointing to a regional rather than localised pattern [8] .
The association between yield loss and dietary diversity (r = 0.58) sits within the range reported for cereal-dependent households in comparable settings. Research among maize growers in Malawi documented a correlation of 0.52 between harvest size and HDDS [9] , and a multi-country analysis across five African nations found coefficients between 0.44 and 0.63 depending on the degree of market integration [10] . The mechanism appears to be dual: households lose the grain itself (food-access channel) and lose the revenue from selling surplus grain (income channel), together compressing both the quantity and variety of available foods.
International Journal of Agriculture and Nutrition https://www.agriculturejournal.net
Stunting prevalence of 38.4% in yield-affected households exceeds the Kenyan national average of 26% and approaches levels typically seen in emergency nutrition surveys [6] . This indicates that even moderate, repeated yield losses accumulate into chronic nutritional damage among young children whose growth windows are biologically narrow. The implication for policy is that nutritional surveillance should be embedded within agricultural earlywarning systems rather than treated as a separate healthsector activity.
Maternal education emerged as a significant predictor of HDDS independently of yield level, suggesting that informed dietary choices can partially buffer households against production shocks. Extension programmes that integrate nutrition messaging such as promoting consumption of dark leafy vegetables and small dried fish alongside rice could leverage this protective factor even when yield recovery is slow [11] .
Clinical implications and practical applications
These findings carry direct implications for agricultural extension and public health programming in rice-dependent regions of East Africa. First, extension curricula should incorporate nutrition-sensitive modules that teach farming households how to maintain dietary diversity during seasons of low rice output, for instance by promoting home gardens of vitamin A-rich vegetables and iron-dense legumes. Second, bio-fortified rice varieties with elevated zinc and iron content, already available through international breeding networks, should be fast-tracked for release in Kenyan lowland systems to ensure that even reduced harvests deliver adequate micronutrient density. Third, district health offices should coordinate with agricultural officers to flag communities experiencing consecutive yield losses for targeted nutritional screening of children under five, thereby catching stunting risk before it becomes irreversible.
Limitations
This research relied on farmer-recalled yield data for the earlier seasons, which may be subject to recall inaccuracy despite partial verification against cooperative records. The cross-sectional design establishes association rather than causation; longitudinal tracking of the same households across multiple seasons would strengthen causal inference. The sample was drawn from one county, and the high level of irrigation infrastructure in Mwea may limit generalisability to purely rain-fed rice environments elsewhere in East Africa. HDDS captures the previous 24hour recall window, which may not represent typical dietary patterns, though the FCS (seven-day recall) partially addresses this. Finally, the research did not measure actual micronutrient intake or blood biomarkers, so the link between dietary diversity and specific deficiency diseases remains indirect.
Conclusion
Rice cultivation in central Kenya operates at the intersection of climate exposure and nutritional vulnerability: households grow a single crop that simultaneously serves as their primary calorie source and main cash generator, so any yield shock reverberates through both food and income channels. The growing body of evidence on climate variability in East Africa leaves little doubt that erratic rainfall is intensifying, yet most adaptation programmes continue to treat agricultural productivity and nutritional security as parallel rather than connected objectives. The present research highlights three key findings that argue for integration. First, a 25.8% yield decline over three seasons was accompanied by a statistically significant drop in household dietary diversity and food consumption scores, confirming that production loss translates rapidly into dietary deterioration. Second, stunting prevalence among children under five in yield-affected households was nearly double that of stable-yield households, indicating that chronic nutritional damage accumulates within a relatively short window of repeated yield loss. Third, maternal education moderated the relationship between yield and diet quality, pointing to information-based interventions as a realistic buffer even in the absence of immediate yield recovery.
Based on these findings, three recommendations merit attention from agricultural and health policy planners. Extension services should embed nutrition counselling into their routine farmer engagement activities, ensuring that messages about dietary diversity reach households at the same time as agronomic advice. National crop-release committees should prioritise bio-fortified rice varieties that maintain micronutrient density under water-stressed conditions. And district-level early-warning systems should incorporate nutritional screening triggers linked to consecutive-season yield declines, enabling proactive referral of at-risk children to supplementary feeding programmes before growth faltering becomes entrenched. Looking ahead, longitudinal panel research tracking the same households across five or more seasons would clarify whether the yield-nutrition relationship identified here persists, deepens, or attenuates as communities develop adaptive capacity. Randomised trials of integrated agriculture-nutrition extension packages could measure the marginal benefit of dietary messaging over standard agronomic support alone. And expanding the geographic scope to encompass purely rain-fed lowland rice systems in western Kenya, Uganda, and Tanzania would test the transferability of the schematic pathway framework developed in this research across the wider East African rice belt.
Acknowledgement
Acknowledgements
Figures and tables from the paper
| Indicator | 2021/22 Season | 2023/24 Season | t-value | p-value |
|---|---|---|---|---|
| Paddy yield (t/ha) | 3.1 ± 0.8 | 2.3 ± 0.9 | 8.94 | < 0.001 |
| HDDS (0-12) | 5.6 ± 1.4 | 4.5 ± 1.7 | 6.21 | < 0.001 |
| FCS (0-112) | 39.1 ± 11.2 | 31.4 ± 13.8 | 7.33 | < 0.001 |
| Meals per day | 2.8 ± 0.4 | 2.3 ± 0.6 | 5.47 | < 0.001 |
| Rice consumption (days/wk) | 5.4 ± 1.1 | 4.1 ± 1.5 | 4.82 | < 0.001 |
Table text extracted from the original PDF; superscript letters are shown inline. The original table image is below.
View original table image
| Variable | Yield | HDDS | FCS | Education | Market dist. | HH size |
|---|---|---|---|---|---|---|
| Yield (t/ha) | ||||||
| HDDS | 0.58** | |||||
| FCS | 0.51** | 0.73** | ||||
| Education (yrs) | 0.22* | 0.34** | 0.29** | |||
| Market dist. (km) | -0.31** | -0.28** | -0.25* | -0.11 | ||
| HH size | 0.09 | 0.04 | -0.06 | -0.14 | 0.08 |
Table text extracted from the original PDF; superscript letters are shown inline. The original table image is below.
View original table image
| Indicator | Yield-affected (n=157) | Yield-stable (n=119) | P-value |
|---|---|---|---|
| Mean HDDS | 4.1 ± 1.5 | 5.9 ± 1.2 | < 0.001 |
| Mean FCS | 28.3 ± 12.4 | 42.7 ± 9.8 | < 0.001 |
| Stunting prevalence (%) | 38.4 | 21.7 | 0.002 |
| Wasting prevalence (%) | 11.2 | 5.8 | 0.034 |
| Meals per day | 2.1 ± 0.5 | 2.7 ± 0.4 | < 0.001 |
Table text extracted from the original PDF; superscript letters are shown inline. The original table image is below.
View original table image
References
14 in the original paper- Seck PA, Diagne A, Mohanty S, Wopereis MCS. Crops that feed the world 7: Rice. Food Security. 2012;4(1):724.
- Njeru TN, Mano Y, Otsuka K. Role of access to credit in rice production in sub-Saharan Africa: The case of Mwea Irrigation Scheme in Kenya. Journal of African Economies. 2016;25(2):300-321.
- Headey DD, Martin WJ. The impact of food prices on poverty and food security. Annual Review of Resource Economics. 2016;8:329-351.
- Ruel MT, Alderman H. Nutrition-sensitive interventions and programmes: How can they help to accelerate progress in improving maternal and child nutrition? The Lancet. 2013;382(9891):536-551.
- Zella AY, Kitali LJ, Lunyelele SS, Asenga SS, Ntaturo EM. Effects of climate change among paddy farmers in Kahama district, Tanzania. International Journal of Geography, Geology and Environment. 2023;5(2):122132.
- UNICEF; World Health Organization; World Bank. Levels and trends in child malnutrition: Joint child malnutrition estimates. UNICEF/WHO/World Bank Group. 2023;1-32.
- Kenya Meteorological Department. Seasonal rainfall performance review 2023. KMD Technical Bulletin. 2023;2023-08:1-14.
- Onyango MO, Kiboi MN. Rice production trends and climate risk in Mwea Irrigation Scheme, Kenya. African Crop Science Journal. 2022;30(4):471-486.
- Katungi E, Wozemba D, Rubyogo JC. A cost-benefit analysis of farmer-based seed production for common bean in Kenya. African Crop Science Conference Proceedings. 2011;10:409-415.
- Sibhatu KT, Krishna VV, Qaim M. Production diversity and dietary diversity in smallholder farm households. Proceedings of the National Academy of Sciences. 2015;112(34):10657-10662.
- Olney DK, Pedehombga A, Ruel MT, Dillon A. A 2year integrated agriculture and nutrition and health behavior change communication program targeted to women in Burkina Faso. Journal of Nutrition. 2015;145(6):1317-1324.
- Lobell DB, Burke MB, Tebaldi C, Mastrandrea MD, Falcon WP, Naylor RL. Prioritizing climate change adaptation needs for food security in 2030. Science. 2008;319(5863):607-610.
- Kennedy G, Ballard T, Dop MC. Guidelines for measuring household and individual dietary diversity. FAO Technical Report. 2011;1-60.
- Waha K, van Wijk MT, Fritz S, See L, Thornton PK, Wichern J, et al. Agricultural diversification as an important strategy for achieving food security in Africa. Global Change Biology. 2018;24(8):3390-3400.