
Research article · 2026 · Full text
International Journal of Geography Geology and EnvironmentImpact of farm mechanization on rice productivity at river delta in Andhra Pradesh state
Volume 8(5) · Pages 103–109 · DOI: 10.22271/27067483.2026.v8.i5b.758 ↗
Research areasAgricultural Economics and PracticesRice Cultivation and Yield ImprovementAgricultural Engineering and Mechanization
Abstract
Author-writtenRice remains a cornerstone of food security in India, particularly in irrigated ecosystems such as the Krishna-Godavari delta of Andhra Pradesh. This review synthesizes recent literature (2016-2025) on the role of farm mechanization in enhancing rice productivity, reducing labor dependency, and improving energy efficiency. The study critically evaluates constraints in traditional systems and highlights the transition toward mechanized agriculture. Evidence suggests that mechanization significantly improves timeliness, input-use efficiency, and yield levels, though challenges related to cost, accessibility, and sustainability persist. The review integrates economic, technological, and energy perspectives to provide a holistic understanding of mechanization-driven productivity gains Production of rice in India is expected to drop this year (2022-23) from 104.3 million tonnes to 103.0 million tonnes due to lower kharif output pegged at almost 90.69 million MT.
Summary
Source-checkedPlain-language reading of the full paper, prepared with AI and checked against the text. Each point links to the authors' own words.
Why it matters
- Rice is a critical crop for food security in India, especially within the irrigated ecosystems of the Krishna-Godavari delta in Andhra Pradesh. View evidence ↗
- Rice is central to India's livelihood and food security, contributing approximately 30% of the total caloric intake in the national diet. View evidence ↗
- A transition toward mechanized farming has become necessary due to rising wages, labor shortages, and variability in climate. View evidence ↗
The question
- The study aims to synthesize literature from 2016 to 2025 to evaluate how farm mechanization enhances rice productivity, reduces reliance on labor, and improves energy efficiency. View evidence ↗
What they did
- The research utilizes primary field survey data to examine the efficiency of mechanized farms specifically regarding rice productivity. View evidence ↗
- The study uses a reformulated mechanization index (MI) calculated as the ratio of machine and fuel energy to the total energy input (including human and animal labor). View evidence ↗
What they found
- National rice productivity grew by approximately 2.77% between 2001-02 and 2021-22, increasing from 2.21 to 3.01 tonnes per hectare. View evidence ↗
- India's average rice productivity of 3.01 Metric tonnes per hectare is lower than the global average of 3.89 Metric tonnes per hectare. View evidence ↗
- Farm power availability in India increased from approximately 0.31 kW per hectare in 1961 to around 1.35 kW per hectare in 2021. View evidence ↗
- Fertilizer is the dominant energy source, contributing an average of 10,651.8 MJ per ha for small farms (fully or partially mechanized) and 13,550.6 MJ for large farms. View evidence ↗
- As mechanization levels increased, human energy use declined from 2,209.4 to 1,775.7 MJ ha⁻¹, while machine energy use rose from 2,089.6 to 2,256.2 MJ ha⁻¹. View evidence ↗
- With increased mechanization, the percentage contribution of human energy fell from 10.8% to 6%, while machine energy increased from 11.4% to 13.4%. View evidence ↗
- Key constraints to mechanization include high input costs, the high cost of labor, lack of technical information, and the unavailability of machinery in a timely manner. View evidence ↗
What it means
- To meet projected demand, rice productivity must be increased from the current 2.2 tons per ha to 2.7 tons per ha. View evidence ↗
- The authors conclude that farm mechanization is a key pathway for achieving agricultural development. View evidence ↗
Visual summary
2 visualsIllustrations explain the paper; charts are replotted from the paper's own table values.
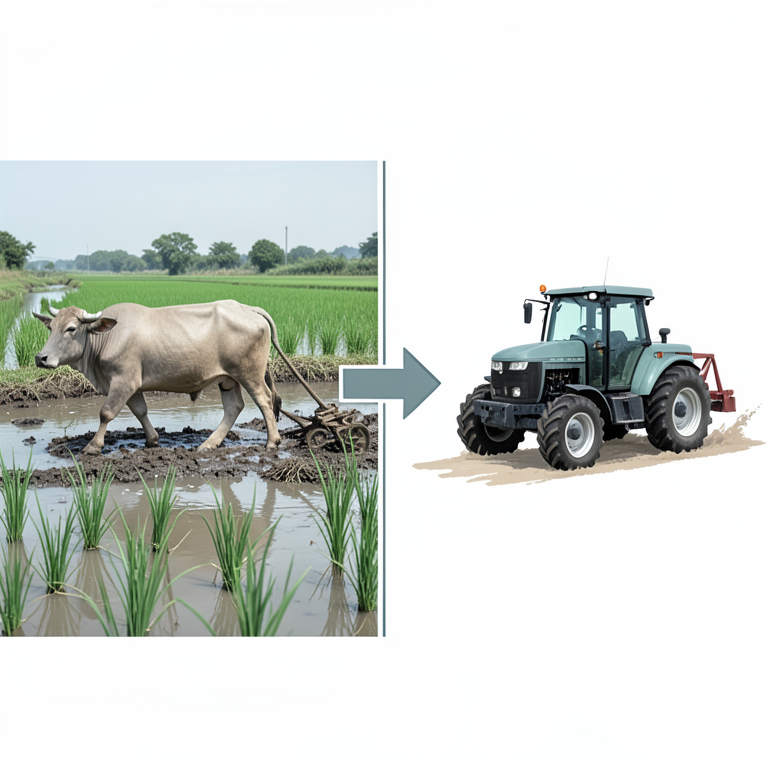
Shift in Farm Power Sources
AI-generated conceptual illustration (rice plants in a river delta field). It explains the idea and does not show study data.
View source evidence ↗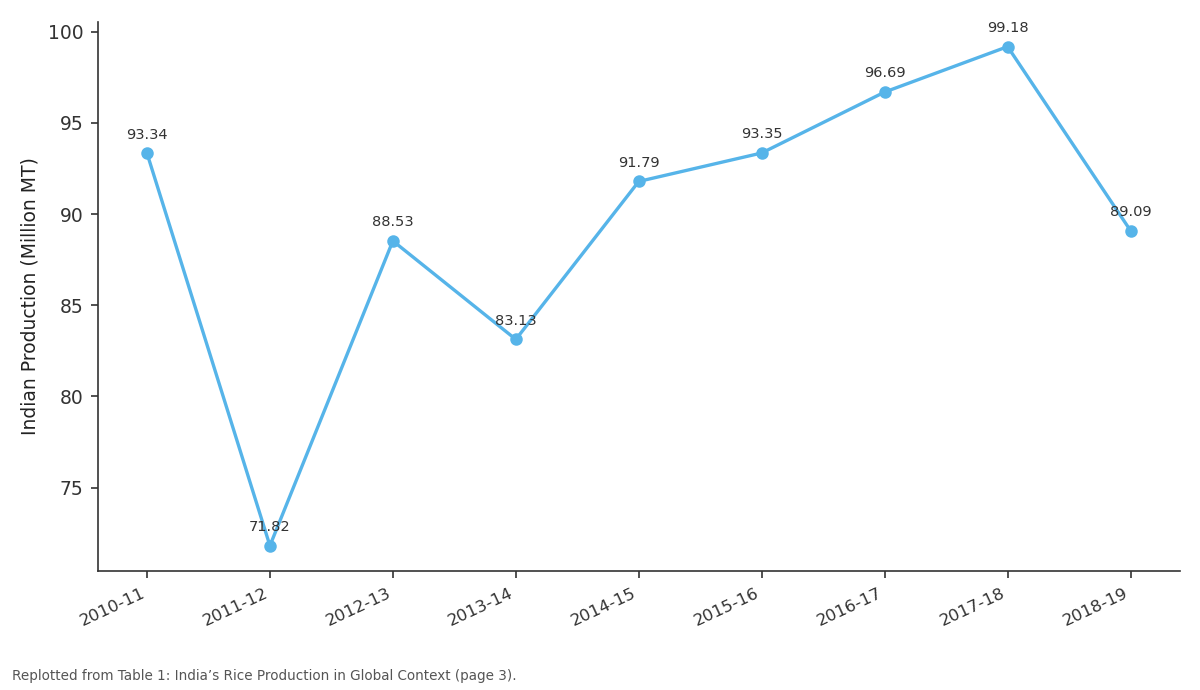
Indian Production (Million MT): 2010-11 vs 2011-12 vs 2012-13 vs 2013-14 vs 2014-15
Replotted from Table 1 (page 3) of the original paper. Every bar is the paper's own table value.
View source evidence ↗Figures & tables
From the original paper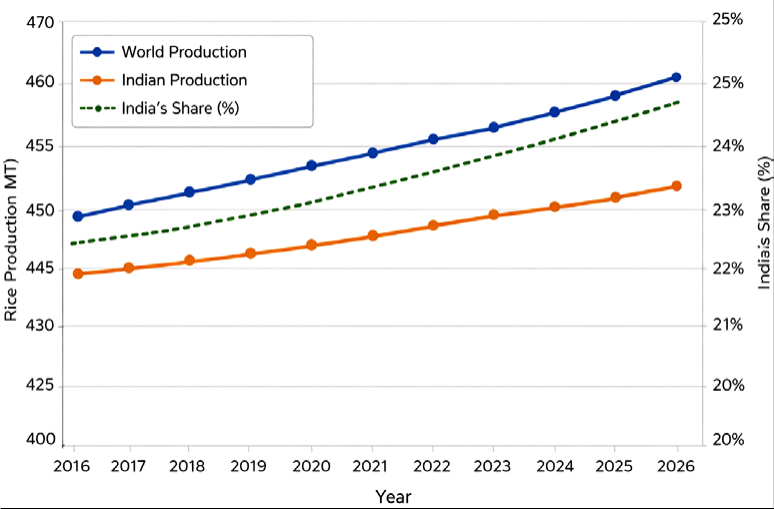 Figure 1
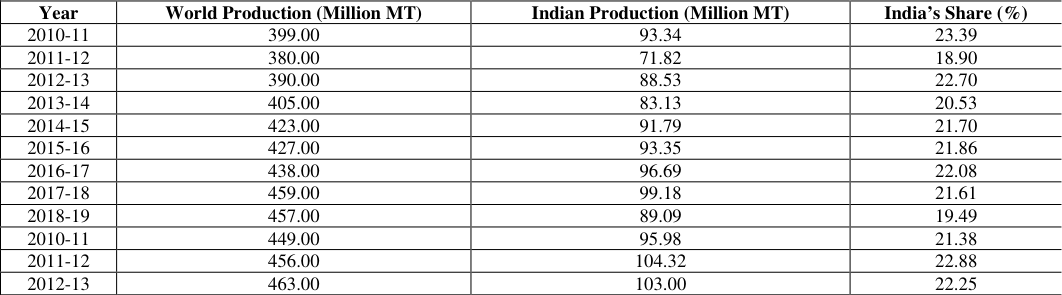 Table 1
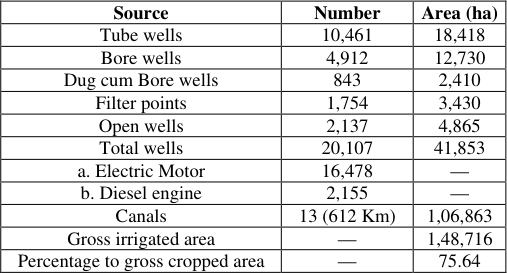 Table 2
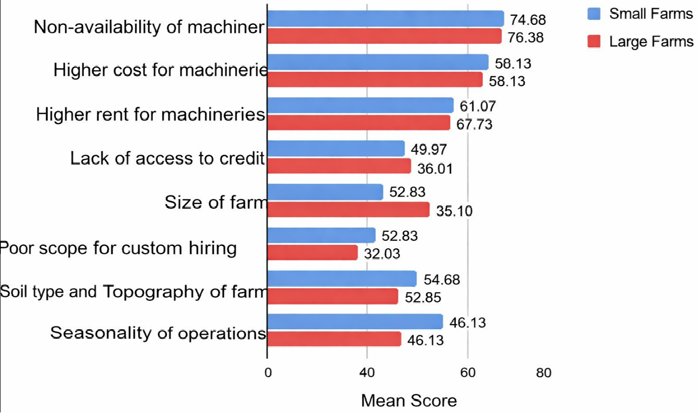 Figure 2
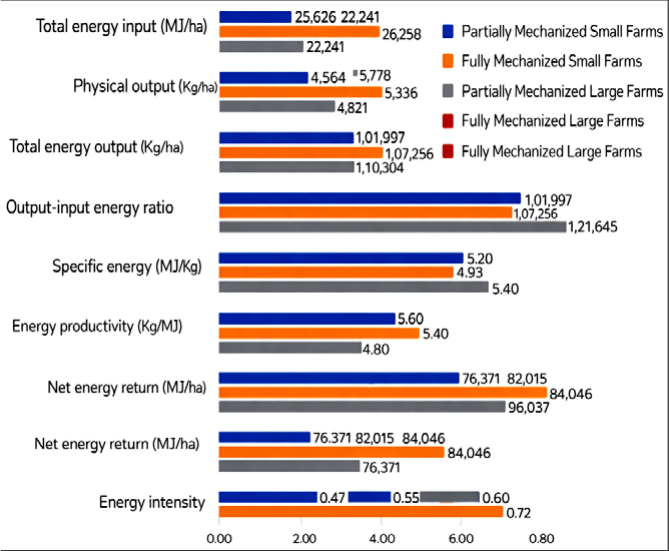 Figure 3
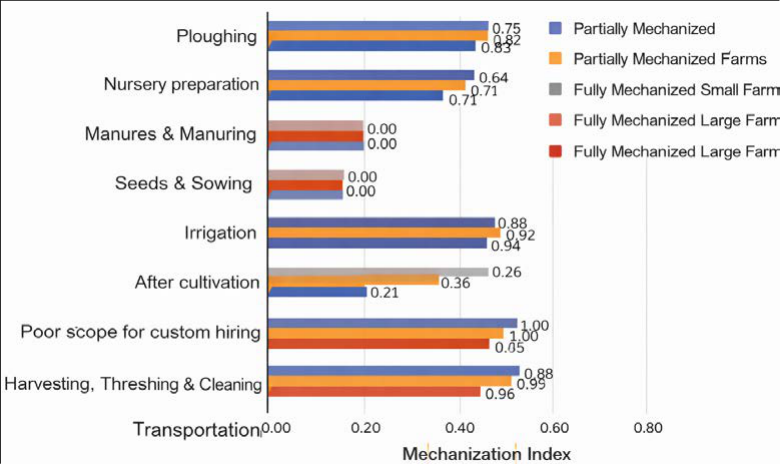 Figure 4
Introduction
Rice (Oryza sativa) is a staple crop feeding more than half of the global population, with Asia contributing over 90% of total production (FAO, 2021; IRRI, 2020) [8,10] . In India, rice accounts for a substantial share of caloric intake and agricultural GDP, making it central to food and livelihood security (Bhatt et al., 2019) [2] . Despite steady production growth, yield stagnation has emerged as a major concern in recent decades, particularly in intensively cultivated regions (Ray et al., 2019; Kumar et al., 2021) [26] . The Krishna-Godavari delta represents one of India's most productive rice-growing zones, supported by extensive irrigation infrastructure. However, labor shortages, rising wages, and climate variability have necessitated a shift toward mechanized farming systems (Reddy & Bantilan, 2020; Birthal et al., 2022) [27,3] . Because of its importance in providing national food security and generating employment and incomes for the low-income sectors of society, most Asian governments regard rice as a strategic commodity. Asia has done remarkably well in terms of meeting the food needs of its growing population over the last three decades. Since the mid-1960s, rice production has increased at a rate of 2.6 per cent per year, keeping pace with population growth and the income-growth-induced changes in per capita food consumption. Over four-fifths of the growth in production was due to the increase in yields, made possible through gradual replacement of traditional varieties with modern implements developed in rice research stations, supported by public investment for expansion of irrigation infrastructure, extension system and supply of credit facilities. In India, production of food grains is the pro-active, which addresses rural income generation and food shortage to a large section of the population. Among the food grain crops, rice is most important in terms of area coverage and supply of calories in the diet. Rice contributes roughly 30% of the total caloric intake in the Indian diet. Considering that nearly 37% of the population still lives below the poverty line (Government of India, 2009), improving rice productivity remains essential for supporting the livelihoods and food security of millions of both consumers and farmers. Further the Indian rice production accounts for 21 per cent of global rice production thus contributing largely to global food security. Currently India is ranked last in terms of productivity of rice when compared with several countries of the world and the average productivity of rice in India is 3.01 Metric tonnes per hectare against the world average of 3.89 Metric tonnes per hectare. Further to sustain the present level keeping pace with the present level of population growth, yield improvement of not less than 2.5 to 3.5 per cent annual growth rate is required to add at least 2.0 -2.50 million Tonnes of additional rice per annum. The global trend in area and production of rice given in Table 1 revealed that the trend in India's rice production has not been encouraging. While the area increased from 43.91 million hectares in 2007-08 to 44.60 million hectares in 2021-22, the production has marginally increased from 96.69 million tonnes to 104.32 million tonnes for the same period.
| Year | World Production (Million MT) | Indian Production (Million MT) | India’s Share (%) |
|---|---|---|---|
| 2010-11 | 399.00 | 93.34 | 23.39 |
| 2011-12 | 380.00 | 71.82 | 18.90 |
| 2012-13 | 390.00 | 88.53 | 22.70 |
| 2013-14 | 405.00 | 83.13 | 20.53 |
| 2014-15 | 423.00 | 91.79 | 21.70 |
| 2015-16 | 427.00 | 93.35 | 21.86 |
| 2016-17 | 438.00 | 96.69 | 22.08 |
| 2017-18 | 459.00 | 99.18 | 21.61 |
| 2018-19 | 457.00 | 89.09 | 19.49 |
| 2010-11 | 449.00 | 95.98 | 21.38 |
| 2011-12 | 456.00 | 104.32 | 22.88 |
| 2012-13 | 463.00 | 103.00 | 22.25 |
Table text extracted from the original PDF; superscript letters are shown inline. The original table image is below.
View original table image
Rice Production in India
Rice productivity in the country rose from 2.21 tonnes per hectare in 2001-02 to 3.01 tonnes per hectare in 2021-22, reflecting an overall growth rate of about 2.77% during this period. This improvement has largely been attributed to a steady increase in contributions from different regions across the country, especially from eastern India. However, the compound growth rate in the northern belt (including Punjab, Haryana, and western Uttar Pradesh), which had been relatively high at 6.46% and 4.24% in the two decades prior to 2001, declined to 2.57% between 2001-02 and 2021-22. In contrast, productivity growth in the southern region has remained almost unchanged over the same period. Eastern India, which accounts for more than 60 per cent of the country's rice area, registered an impressive rate of 2.82 per cent in the period 2001-02 to 2021-22, compared with 0.83 per cent during the preceding decade. Detailed assessments of rice productivity across states, districts, and growing seasons in high-yield regions reveal patterns of decline, stagnation, and slowdown in yields. Among the seven major intensive and high-performing riceproducing states, Andhra Pradesh, Tamil Nadu, and Karnataka are characterized by irrigated rice-rice cropping systems. In contrast, Punjab and Haryana primarily follow a rice-wheat rotation, while Odisha and West Bengal cultivate rainfed rice during the kharif season, followed by a second crop in the dry season. During the past decade, rice productivity showed improvement in Andhra Pradesh, Karnataka, Tamil Nadu, Punjab, and Haryana, with growth rates of 2.51%, 3.65%, 4.01%, 0.94%, and 1.17%, respectively. However, when compared to the previous decade, the pace of growth slowed slightly in Andhra Pradesh and declined sharply in Punjab and Haryana. In contrast, the adoption of improved technologies in Odisha and West Bengal has led to a consistent rise in yields since 2001.
The observed slowdown and reduction in productivity within irrigated rice ecosystems is a significant concern. Although these areas account for about 45% of the total rice-growing area, they contribute nearly 61% of the country's overall rice production. Ensuring sustainability at current levels and achieving the targeted production of 113 million tonnes of paddy requires focused efforts to identify suitable technologies and optimize ecosystem-specific strategies.
Food Production in Indian Deltas
Indian agriculture is required to achieve food production of 293.60 million tonnes by 2020 with the available land mass remaining at about 142 million hectares; it has to come through essentially a vertical expansion, gains through productivity in commodities. There is going to be demand for farm machineries that are ergonomically sound, economically affordable, economy in input use and quantum jumps in productivity. Unlike industry, where men, machines and materials are brought under one roof, agriculture requires these three being moved and various operations performed timely that gives the desired productivity. In this context, availability of appropriate farm power source is imperative. However, for the current level of intensity of farming and the required level of productivity, electro mechanical sources of farm power have to replace the human and animate sources of power. Farm mechanization is widely regarded as a key driver of agricultural advancement. In contemporary farming systems, the adoption of machinery has become essential for enhancing profitability. Farmers in both developed and developing countries tend to shift toward mechanized operations when traditional energy sources-such as human and animal labor-become more expensive than mechanical alternatives. Over time, there has been a consistent trend in which biological energy sources grow costlier relative to machines. This shift is partly due to the increasing ease of substituting capital for labor in agriculture, as well as the rising costs associated with human and animal work compared to fuel and machinery. During the last 50 years, the average farm power availability in India hper cent farm power was coming from animate sources, the contribution of animate sources of power reduced to about 10.40 per cent in 2021 and that of mechanical and electrical sources of power increased from 5.10 per cent to 89.30 per cent during the same period. The power productivity relationship shows that those states having higher farm power availability per hectare have higher productivity. The state of Punjab which is highly mechanized had about 98 per cent diesel engine power. The availability of farm power in India and the contribution of different power sources are presented in [8] . Mechanization also supports climateresilient agriculture by enabling timely operations (Aryal et al., 2020) [1] . Andhra Pradesh State Planning Commission (1984) described farm mechanization as the process of increasing farm productivity by investing on efficient tools and equipments. Defined mechanization as an art of equipping agriculture with mechanical aids for increasing efficiency in the farm enterprises. Defined mechanization as the process of injecting power and machinery between men and materials in a production system. Agricultural mechanization implies the use of various power sources and improved farm tools and equipment, with a view to reduce the drudgery of the human beings and draught animals, enhance cropping intensity, precision and timeliness of efficiency of utilization of various inputs and reduces the losses at different stages of crop production. For the present study, mechanization is defined as the use of machines like, Tractors, Power tillers, Transplanters, Pumpsets, Sprayers and combined harvesters by replacing the human power as well as animal power to reduce the drudgery and improve timeliness of agricultural operations which lead to increased production. There were two categories of farms, namely (i) those owning and using machineries and (ii) those not owning but using machineries on hire. Only the former category was called as mechanized farms, while the latter might qualify to be called as user of machine power but not mechanized farms. For improving farming efficiency, it was enough to use machineries and not necessarily by mechanized. For the present study all the farms that have used machineries whether owned or hired were as mechanized farms.
In this study, the mechanization index is reformulated as the ratio of machine and fuel energy to the total energy input, which includes machine and fuel energy along with animal and human labor energy.
Where, MI: Machinery energy,
• Ed: sum of machinery and fuel energy,
• Eh: Human Energy and • Ea: Animal energy.
It shows what contribution machine energy has allocated to itself in rice cultivation vis-a-vis the total energy consumed. A value of this index closer to one indicates that the majority of farm operations are carried out using machinery, reflecting a higher degree of mechanization. This measure helps assess the efficiency of mechanization in terms of energy use and also highlights whether the reliance on machinery is justified or excessive.
Productivity and Production Functions
Defined productivity as the quantity of output per unit of resource or input. Perceived productivity as a concept measuring the ratio of total output to a weighted average of inputs. Considered productivity as the efficiency with which the input is transferred into output. Production function could be viewed as an embodiment of the technology which would yield increased output from the given set of inputs or specify the way in which input would cooperate together to produce a given level of output. Described a production function as a technical and mathematical representation that explains how the output of a product is influenced by the quantity of inputs or input services applied on a given piece of land, under a specific set of technologies and within a defined time period. They categorized production functions into four types: continuous, discontinuous, short-run, and long-run functions. Stated that the cost of production comprises expenses incurred on various inputs such as seeds, manures, fertilizers, irrigation, plant protection chemicals, human labor, and bullock labor. It also includes the rental value of land based on prevailing market rates, along with overhead costs like interest on working and fixed capital, repairs, and depreciation. Variable costs refer to those expenditures that change with the use of variable factors of production, the levels of which can be adjusted in the short run. In his study viewed that the cost of cultivation covered both the paid out cost and imputed cost. The price received by farmers and net returns calculated by deducting the total costs from gross returns. Calculated net income earned from elephant foot yam production by estimating gross income from yam production, minus cost C3 by considering value o of management input of the farmers as 10 per cent value of the total cost C2.
Production Constraints
A constraint is anything that prevents the system from achieving more of its goal. Constraints can be internal or external to the system. An internal constraint arises from the farm itself whereas external constraints arise from out of the farm. Reported that the main constraints of the farmers are focused in three problems viz. agro-ecological constraints, technological constraints and socio-economic constraints for understanding the real situation in rice production and export of India and Vietnam, which are useful to find out the suitable solutions for overcoming the constraints and promoting rice production and exports. In the present study, the parameter namely higher input cost, timely unavailability of machineries, high cost of labours, and lack of technical information were identified as constraints as shown in Fig. 2.
Energy Use Efficiency and Mechanization Index
The intensification of farming practices leads to a higher reliance on various forms of energy in crop production. Agriculture functions both as a consumer of energy and as a generator of energy through its outputs. Energy inputs are applied in different forms, including human labor, animal power, and mechanical sources. The adequate supply of suitable energy, along with its efficient and effective utilization, is crucial for improving agricultural productivity.
Ensuring food security for India's vast population demands greater energy inputs supported by improved management strategies. In this context, the present study seeks to analyze the pattern of energy use, the different energy sources, and their economic viability in rice farms within the study area.
The pattern of energy use in rice cultivation under different levels of mechanization and under different size of farms indicated that fertilizer was found to be dominant source of energy contributing an average of 10,651.8 MJ per ha for the fully mechanized and partially mechanized small farms and 13,550.6 MJ for the large farms. Percentage wise, 45.6 per cent of the total energy in small farms and 52.5 per cent of the total energy in large farms was contributed by fertilizer as illustrated in Fig. 3. In percentage terms, the human energy contribution declined to 6 per cent from 10.8 per cent and that of machine energy had increased from 13.4 per cent from 11.4 per cent as the level of mechanization increases. From Fig. 4, the average energy used for rice cultivation was 20,318.8 MJha-1 for partially mechanized small farms and 22,250.2 MJha-1 for fully mechanized small farms and 21,284.5 MJha-1 for mechanized small farms.
Conclusion
Rice is one of the most widely consumed staple foods in the world, with over 90% of its production and consumption concentrated in Asia. As a major crop in India, considerable attention is directed toward increasing its production and productivity. Rice is cultivated on about 43.4 million hectares during the kharif and rabi/summer seasons, out of a total cultivated area of 142 million hectares. However, the extent of land under rice cultivation is expected to decline in the future due to government-led diversification policies. At present, rice production in the country faces several challenges, including stagnating yields, limited water availability, shortages of labor, and insufficient institutional support systems. Enhancing rice productivity and output remains a critical issue, as it affects all stakeholders, including researchers, policymakers, farmers, and consumers. Growth in population and economic prosperity are the two driving forces for increasing rice demand in India. According to the National Commission on Population, India's population will be 1340 million in 2021. It is estimated that demand for rice will be 113.3 million tons by the year 2021-22. In order to achieve this target, the productivity of rice has to be brought to the level of 2.7 tons per ha, which is 2.2 tons presently. The present rate of production growth (1.27 per cent) is below the population growth of 1.63 per cent. Therefore, the present deceleration trend in production and yield is a cause of concern and has to be reversed. Currently India is ranked last in terms of productivity of rice when compared with several countries of the world and the average productivity of rice in India is 3.01 Metric tonnes per hectare against the world average of 3.89 Metric tonnes per hectare. Farm mechanization is considered to be one of the several pathways of agricultural development.
Figures and tables from the paper
| Source | Number | Area (ha) |
|---|---|---|
| Tube wells | 10,461 | 18,418 |
| Bore wells | 4,912 | 12,730 |
| Dug cum Bore wells | 843 | 2,410 |
| Filter points | 1,754 | 3,430 |
| Open wells | 2,137 | 4,865 |
| Total wells | 20,107 | 41,853 |
| a. Electric Motor | 16,478 | — |
| b. Diesel engine | 2,155 | — |
| Canals | 13 (612 Km) | 1,06,863 |
| Gross irrigated area | — | 1,48,716 |
| Percentage to gross cropped area | — | 75.64 |
Table text extracted from the original PDF; superscript letters are shown inline. The original table image is below.
View original table image
References
35 in the original paper- Aryal JP, Rahut DB, Maharjan S, Erenstein O. Factors affecting the adoption of multiple climate-smart agricultural practices in the Indo-Gangetic Plains of India. Natural Resources Forum. 2020;44(2):141-158.
- Bhatt BP, Singh KM, Singh A, Kumar A. Rice productivity and food security in India: challenges and opportunities. Agricultural Economics Research Review. 2019;32(1):1-12.
- Birthal PS, Khan MT, Negi DS, Agarwal S. Impact of farm mechanization on agricultural productivity: evidence from India. Food Policy. 2022;106:102190.
- Chauhan BS, Jabran K, Mahajan G. Rice production worldwide: trends and challenges. Crop Protection. 2021;143:105558.
- Clarke LJ. Strategies for agricultural mechanization development: the roles of the private sector and government. Rome: Food and Agriculture Organization. 2019;15-30.
- Daum T, Birner R. Agricultural mechanization in Africa: myths, realities, and an emerging research agenda. Global Food Security. 2020;26:100393.
- FAOSTAT. Crops and livestock products database. Rome: Food and Agriculture Organization. 2023.
- Food and Agriculture Organization. The state of food and agriculture 2021: making agrifood systems more resilient. Rome: FAO. 2021;35-50.
- Hiremath GM, Suresh A, Reddy AA. Custom hiring centers for farm mechanization in India: impact and policy implications. Indian Journal of Agricultural Economics. 2021;76(3):347-362.
- Jat ML, Dagar JC, Sapkota T. B, Govaerts B, Ridaura SL, Saharawat YS, et al. Climate change and agriculture: adaptation strategies and mitigation opportunities. Advances in Agronomy. 2019;157:1-52.
- Jat ML, Singh Y, Sidhu HS. Mechanization for sustainable intensification of agriculture. Agricultural Systems. 2022;192:103203.
- Krishna VS, Jain SK, Panwar NL, Sunil J, Wadhawan N, Kumar A. Emergence of Internet of Things technology in food and agricultural sector: a review. Journal of Food Process Engineering. 2024;47(8):e14698.
- Krishna VS, Mathew G. Development of a solar copra dryer incorporated with evacuated tubes. International Journal of Current Microbiology and Applied Sciences. 2018;7(6):2457-2465.
- Krishna VS, Sagili JL, Dikkala PK, Sridhar K. Functional, thermal, pasting, and rheological properties of gluten-free maize composite flour: effect of moth bean flour and hydrocolloid addition. Journal of Food Process Preservation. 2021;45(10):e16104.
- Tripathi AK. Multi-objective optimization of a hybrid electricity generation system based on waste energy of internal combustion engine and solar system for sustainable environment. Chemosphere. 2023;336:139222.
- Vedantam SK, Jarugula P. Development of a direct type solar dryer for preparation of mango leather. International Journal of Agricultural and Food Science. 2025;7(5):173-178.
- Kumar P, Kumar A, Parappurathu S. Dynamics of farm mechanization in India: trends, patterns, and policy. Indian Journal of Agricultural Economics. 2019;74(1):1-20.
- Kumar V, Ladha JK, Gupta RK. Direct-seeded rice: recent developments and future research needs. Advances in Agronomy. 2020;111:297-413.
- Lobell DB, Cassman KG, Field CB. Crop yield gaps: their importance, magnitudes, and causes. Annual Review of Environment and Resources. 2020;45:179204.
- Mehta CR, Chandel NS, Senthilkumar T. Status, challenges and strategies for farm mechanization in India. Agricultural Engineering Today. 2018;42(5):113.
- Ministry of Agriculture & Farmers Welfare. Agricultural statistics at a glance 2022. New Delhi: Government of India. 2022;85-100.
- Mohanty S, Wailes E, Chavez E. Global rice supply and demand outlook. Rice Outlook Report. Rome: FAO. 2022;12-25.
- Naidu VGT, Reddy KS, Prasad PR. Agricultural development and productivity trends in Andhra Pradesh. Journal of Agricultural Development. 2021;16(2):45-60.
- Organisation for Economic Co-operation and Development. OECD-FAO agricultural outlook 20222031. Paris: OECD Publishing. 2022;45-65.
- Ray DK, Mueller ND, West PC, Foley JA. Yield trends are insufficient to double global crop production by 2050. PLoS ONE. 2019;14(6):e0218390.
- Reddy AA, Bantilan MCS. Farm mechanization and agricultural productivity in South India. Economic and Political Weekly. 2020;55(12):64-70.
- Reddy KV, Reddy BS, Kumar P. Impact of mechanization on cost and returns of rice cultivation in Andhra Pradesh. Indian Journal of Agricultural Sciences. 2022;92(4):512-517.
- Reddy YV, Naidu VGT, Rao P. Mechanization and productivity linkages in rice farming systems. Agricultural Systems. 2023;205:103576.
- Sharma P, Singh R, Kaur A. Trends in rice productivity and sustainability in India. Sustainability. 2023;15(3):2456.
- Singh G. Agricultural mechanization development in India: status and challenges. Agricultural Mechanization in Asia, Africa and Latin America. 2020;51(2):3-10.
- Singh S, Mittal JP. Energy use pattern and mechanization index in agriculture. Energy Reports. 2019;5:145-152.
- Singh S, Singh RS, Sharma H. Impact of mechanization on agricultural productivity in India. Journal of Rural Development. 2018;37(3):405-420.
- Takeshima H, Nin-Pratt A, Diao X. Mechanization and agricultural technology evolution, agricultural intensification in Sub-Saharan Africa. Agricultural Economics. 2018;49(1):1-13.
- World Bank. Harvesting prosperity: technology and productivity growth in agriculture. Washington DC: World Bank Publications. 2020;60-80.
- Yadav RN, Singh R, Kumar A. Energy budgeting and economic analysis of rice production systems. Energy. 2020;197:117214.