
Research article · 2025 · Full text
International Journal of Geography Geology and EnvironmentCultural landscape transformation analysis in the Angkor heritage zone of Cambodia
Volume 7(8) · Pages 139–143 · DOI: 10.22271/27067483.2025.v7.i8b.760 ↗
Research areasUrbanism, Landscape, and Tourism StudiesLand Use and Ecosystem ServicesLandscape and Cultural Studies
Abstract
Author-writtenHow do tourism expansion and urbanization reshape centuries-old cultural landscapes in heritage areas? This research examined spatial and temporal patterns of landscape transformation within the Angkor Heritage Zone of Cambodia from 2003 to 2022. Multi-temporal Landsat satellite imagery was processed through supervised classification to derive land use maps at four intervals. Landscape metrics, including Shannon Diversity Index, Landscape Shape Index, and fragmentation ratios, were computed using FRAGSTATS software. Ground truth verification relied on 187 field reference points collected during visits in 2019 and 2021. Results showed that dense forest cover dropped from 34.7% in 2005 to 23.8% by 2020, while built-up areas expanded from 8.6% to 17.9% over the same period. Mean NDVI fell from 0.71 to 0.43, indicating a persistent decline in vegetation health. The fragmentation index rose from 0.18 to 0.58. Cropland expanded at the expense of forested tracts, occupying 34.2% of the zone by 2020. Seasonal monsoon patterns provided temporary vegetation recovery yet failed to offset long-term clearing trends. These findings may inform management plans that balance conservation goals with local development within comparable World Heritage buffer zones.
Summary
Source-checkedPlain-language reading of the full paper, prepared with AI and checked against the text. Each point links to the authors' own words.
Why it matters
- The Angkor Archaeological Park in Cambodia is a UNESCO World Heritage Site covering approximately 400 square kilometres. View evidence ↗
- Since the late 1990s, the area's landscape has been rapidly altered by population growth, infrastructure expansion, and a surge in international tourism. View evidence ↗
- Analyzing landscape metrics is important because fragmentation and heterogeneity affect both the cultural authenticity and ecological integrity of heritage sites. View evidence ↗
The question
- The study aimed to map land cover changes from 2003 to 2022, quantify landscape fragmentation, and evaluate the impact of monsoon seasonality on vegetation recovery. View evidence ↗
What they did
- The researchers used multi-temporal Landsat imagery from six specific dates between 2003 and 2022. View evidence ↗
- Land use was categorized into five classes, dense forest, open woodland, cropland, built-up area, and water bodies, using maximum likelihood supervised classification. View evidence ↗
- The classification was validated using 187 ground control points, with a 70:30 split for training and validation. View evidence ↗
- FRAGSTATS v4.2 was used to calculate landscape metrics, including patch density, Shannon diversity, and a fragmentation index based on edge density. View evidence ↗
What they found
- Dense forest cover saw the most significant decline, dropping by 10.9 percentage points from 2005 to 2020. View evidence ↗
- Cropland expanded by 5.9 percentage points as wooded areas were converted into rice paddies. View evidence ↗
- Landscape fragmentation increased, with patch density rising from 4.31 to 8.12 patches per 100 hectares. View evidence ↗
- The dominant forest patch lost its spatial dominance, as the largest patch index decreased from 31.6% to 18.4%. View evidence ↗
- Vegetation health declined as mean NDVI fell from 0.71 to 0.43, which correlated with a steady rise in fragmentation and shape indices. View evidence ↗
What it means
- The authors recommend strengthening buffer-zone zoning, particularly in the western corridor, and providing livelihood alternatives to slow encroachment. View evidence ↗
- The authors conclude that conservation must move beyond protecting individual temples to address broader landscape-scale changes. View evidence ↗
- The authors note that using dry-season snapshots for NDVI may overstate the severity of vegetation decline compared to annual averages. View evidence ↗
- Future research should use higher-resolution imagery and community surveys to better understand the drivers of landscape transformation. View evidence ↗
Visual summary
2 visualsIllustrations explain the paper; they do not show study data.
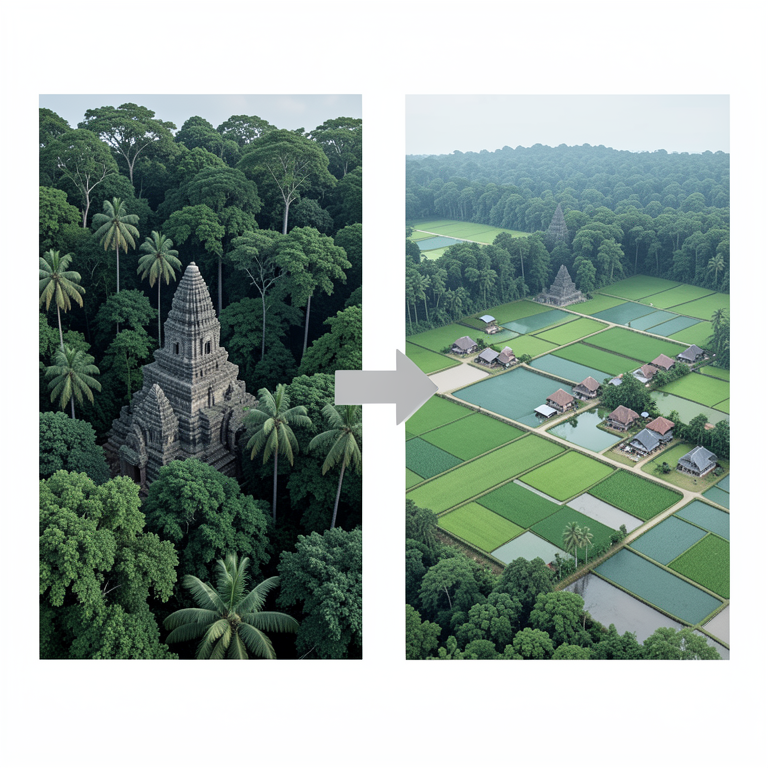
Land Use Shift
AI-generated conceptual illustration (The Angkor heritage zone landscape in Cambodia). It explains the idea and does not show study data.
View source evidence ↗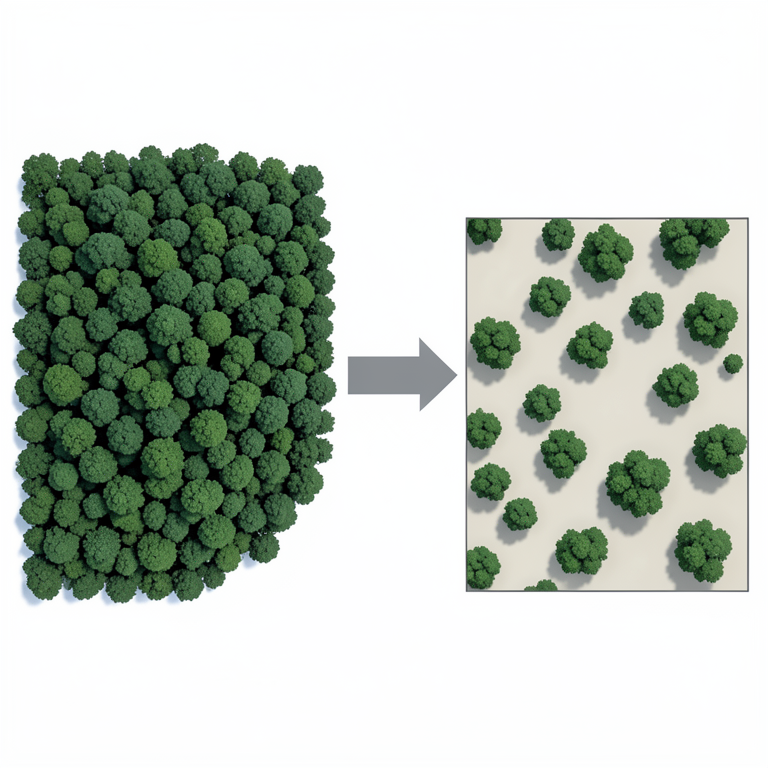
Landscape Fragmentation
AI-generated conceptual illustration (Tropical forest landscape in the Angkor heritage zone of Cambodia). It explains the idea and does not show study data.
View source evidence ↗Figures & tables
From the original paper Table 1
 Table 2
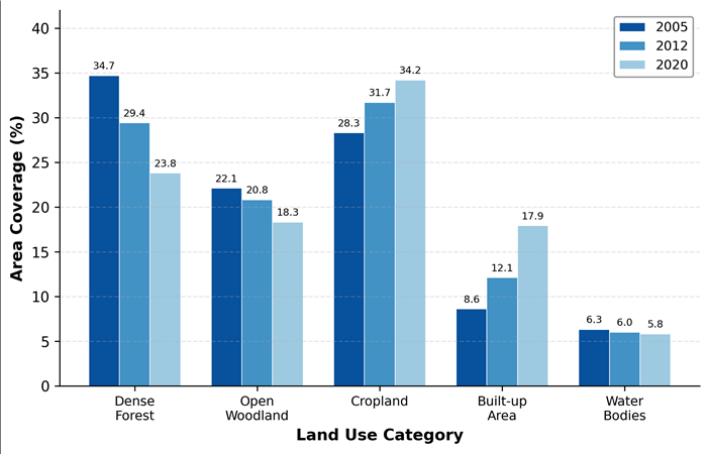 Figure 1
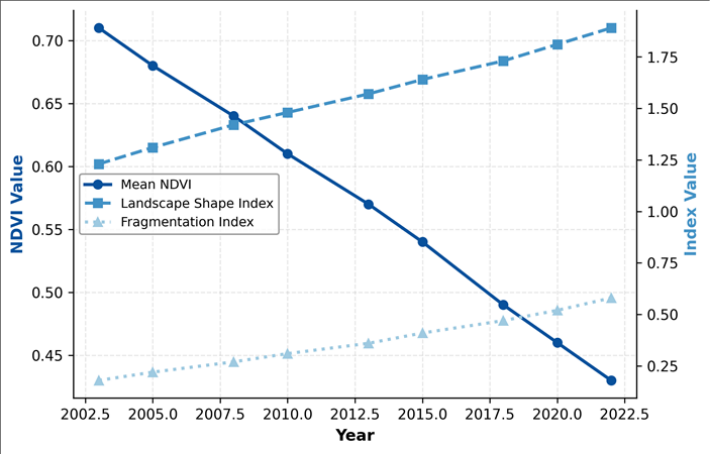 Figure 2
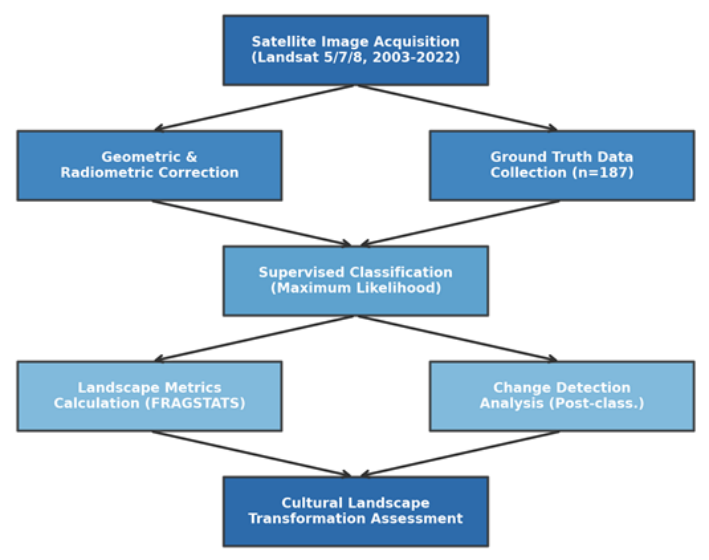 Figure 3
Introduction
What happens to a landscape when its cultural value gains international recognition, yet local populations continue to depend on it for survival? The Angkor Archaeological Park, inscribed as a UNESCO World Heritage Site in 1992, covers roughly 400 square kilometres in Siem Reap Province, Cambodia [1] . It holds iconic Khmer Empire temple complexes and is also home to more than 100,000 residents whose livelihoods rest on farming, fishing, and tourism-related services [2] . Cultural landscapes represent places where human activity has shaped the natural environment over extended periods, and their analysis helps reveal how societies interact with their surroundings [3] . In Angkor, centuries of hydraulic engineering, rice cultivation, and temple construction created a distinctive landscape mosaic [4] . But beginning in the late 1990s, a sharp rise in international tourism, coupled with infrastructure expansion and population growth, started to alter this mosaic at an accelerating pace [5] . Remote sensing offers a practical way to track these changes at a landscape scale. Multitemporal satellite imagery combined with geographic information systems has been applied to heritage sites in places like Petra, Machu Picchu, and the Valley of the Kings [6,7] . Landscape metrics derived from classified imagery can quantify spatial patterns of fragmentation, connectivity, and heterogeneity, all of which matter for both ecological integrity and cultural authenticity [8] . Earlier work on Angkor focused mainly on hydrological reconstructions of ancient canal systems or on archaeological mapping of temple footprints [9] . Evans et al. [10] used LiDAR to uncover medieval urban sprawl beneath forest cover, but their interest lay in historical rather than contemporary change. Chau et al. [11] documented deforestation along the park boundary up to 2015, yet their analysis stopped short of computing landscape-level metrics or linking change patterns to seasonal dynamics. This research aimed to fill that gap by (a) mapping land use and land cover changes from 2003 to 2022, (b) quantifying landscape fragmentation and shape complexity over time, and (c) assessing how monsoon seasonality influences short-term vegetation recovery within the zone.
Study Area Description
The Angkor Heritage Zone lies between latitudes 13°20′N and 13°30′N and longitudes 103°45′E and 104°00′E in northwestern Cambodia. The terrain is predominantly flat, with elevation ranging from 15 m to 65 m above sea level. Soils are largely alluvial, derived from sediments deposited by the Siem Reap River and its tributaries. The region falls within a tropical monsoon climate zone, receiving 1,300 to 1,600 mm of annual rainfall, the majority concentrated between May and October [12] . Mean annual temperature hovers around 28°C. Dense deciduous and semi-evergreen forests once surrounded the temple complexes, but over recent decades these forests have been progressively cleared for lowland rice paddies, settlement expansion, and road construction [13] . Post-classification change detection cross-tabulated classified maps for successive date pairs. Landscape metrics were computed in FRAGSTATS v4.2 at the class and landscape levels, including patch density, largest patch index, landscape shape index, Shannon diversity index, and a fragmentation index defined as the ratio of edge density to total class area. NDVI was calculated for each date from red and near-infrared bands, and trends were tested using the non-parametric Mann-Kendall test at p<0.05.
Material and Methods
Material and Methods
Material
Material
Seasonal Variations and Temporal Patterns
Because the Angkor region experiences a pronounced wetdry monsoon cycle, vegetation indices can swing markedly within a single calendar year. Dry-season NDVI values typically run 0.10 to 0.15 units lower than wet-season peaks owing to leaf senescence in deciduous forests and the fallow state of rice paddies. To account for this, all Landsat acquisitions were restricted to the dry season window (December-February), ensuring inter-annual comparisons were not confounded by seasonal green-up effects. A supplementary analysis of MODIS 16-day composites confirmed that the long-term NDVI decline persisted after seasonal smoothing, indicating the observed trend was structural rather than an artefact of acquisition timing [14] . The dual-axis line chart in Figure 2 highlights the inverse relationship between vegetation condition (NDVI) and landscape fragmentation. As NDVI declined from 0.71 to 0.43, both the Landscape Shape Index and the Fragmentation Index rose steadily, confirming a progressive deterioration of landscape coherence.
Results
Results
Comprehensive Interpretation
Taken together, the land use data and landscape metrics paint a consistent picture: the Angkor Heritage Zone has shifted from a forest-dominated landscape toward a more heterogeneous and fragmented mosaic driven by agricultural and urban encroachment. The rate of built-up expansion accelerated noticeably after 2012, coinciding with a period of rapid tourism growth in Siem Reap Province.
Discussion
The findings reveal a landscape under mounting pressure from forces that often pull in opposite directions. On one hand, Angkor's World Heritage status has attracted conservation funding, management interventions, and international oversight. On the other hand, the same status has driven a tourism boom that requires roads, hotels, and service infrastructure-all of which consume land [15] . The 10.9 percentage-point loss in dense forest recorded here sits within the range reported for other Southeast Asian heritage landscapes, though it is higher than rates observed at sites with stricter buffer-zone enforcement such as Luang Prabang in Laos [5] . Strengthening buffer-zone zoning in that corridor, paired with livelihood alternatives for affected communities, could slow further encroachment [16] .
Conclusion
Conclusion
Acknowledgement
Acknowledgements Funding SourcesThis research was supported by internal academic funding allocated to the Department of Geophysics at the Rangpur National University of Earth Sciences. No external grant numbers are associated with this work. Institutional SupportThe authors acknowledge the Rangpur National University of Earth Sciences for providing computational facilities and GIS laboratory access. The APSARA National Authority, Siem Reap, is thanked for granting field research permits.
Figures and tables from the paper
| Land Use Class | 2005 | 2012 | 2020 | Net Change | Annual Rate |
|---|---|---|---|---|---|
| Dense Forest | 34.7 | 29.4 | 23.8 | −10.9 | −0.73%/yr |
| Open Woodland | 22.1 | 20.8 | 18.3 | −3.8 | −0.25%/yr |
| Cropland | 28.3 | 31.7 | 34.2 | +5.9 | +0.39%/yr |
| Built-up Area | 8.6 | 12.1 | 17.9 | +9.3 | +0.62%/yr |
| Water Bodies | 6.3 | 6.0 | 5.8 | −0.5 | −0.03%/yr |
Table text extracted from the original PDF; superscript letters are shown inline. The original table image is below.
View original table image
| Metric | 2005 | 2012 | 2020 | Trend (p) |
|---|---|---|---|---|
| Patch Density (no./100 ha) | 4.31 | 5.87 | 8.12 | ↑ (<0.01) |
| Largest Patch Index (%) | 31.6 | 24.9 | 18.4 | ↓ (<0.01) |
| Landscape Shape Index | 1.23 | 1.48 | 1.81 | ↑ (<0.01) |
| Shannon Diversity Index | 1.36 | 1.42 | 1.49 | ↑ (0.03) |
| Fragmentation Index | 0.22 | 0.36 | 0.52 | ↑ (<0.01) |
Table text extracted from the original PDF; superscript letters are shown inline. The original table image is below.
View original table image
References
16 in the original paper- Fletcher R, Pottier C, Evans D, Kummu M. The water management network of Angkor, Cambodia. Antiquity. 2008;82(317):658-670.
- Hauser-Schaublin B. Preah Vihear: heritage and conflict in the Thai-Cambodian borderland. World Archaeology. 2011;43(2):319-335.
- Antrop M. Why landscapes of the past are important for the future. Landscape and Urban Planning. 2005;70(12):21-34.
- Engelhardt RA, Rogers P. Angkor and competing interests in management. International Journal of Heritage Studies. 2009;15(1):7-25.
- Imon SS. Tourism and conservation of cultural heritage in Southeast Asia. Journal of Heritage Tourism. 2008;3(2):91-108.
- Parcak S. Satellite remote sensing for archaeology. Journal of Archaeological Research. 2009;17(2):101160.
- Nagaoka M. Heritage landscape of Borobudur and land use dynamics. Conservation and Management of Archaeological Sites. 2015;17(3):237-253.
- McGarigal K, Cushman SA, Ene E. FRAGSTATS v4: spatial pattern analysis program. University of Massachusetts, Amherst. 2012.
- Kummu M. Water management in Angkor: human impacts on hydrology. Journal of Environmental Management. 2009;90(3):1413-1421.
- Evans DH, Fletcher RJ, Pottier C, Chevance JB. Uncovering archaeological landscapes at Angkor using lidar. Proceedings of the National Academy of Sciences. 2013;110(31):12595-12600.
- Chau S, Ung P, Kong R. Forest cover monitoring in the Greater Angkor region. Cambodian Journal of Natural History. 2017;2017(1):44-53.
- Tsuyuki S, Pheap S. Monitoring deforestation in Cambodia using Landsat data. Journal of Forest Research. 2014;19(1):94-102.
- Davis M, Hang P, Seak S. Land use change around Angkor: effects of urban expansion. Asia Pacific Viewpoint. 2015;56(1):73-87.
- Huete A, Didan K, Miura T. Radiometric and biophysical performance of MODIS vegetation indices. Remote Sensing of Environment. 2002;83(1-2):195213.
- Winter T. Post-conflict heritage and tourism in Cambodia: the burden of Angkor. International Journal of Heritage Studies. 2007;13(6):515-528.
- Miura K. Conservation of a living heritage site. Conservation and Management of Archaeological Sites. 2005;7(1):3-18.