
Research article · 2026 · Full text
International Journal of Horticulture and Food ScienceInfluence of planting geometry and nutrition on plant growth and seed yield attributes of okra cv. Arka Anamika
Volume 8(5) · Pages 14–20 · DOI: 10.33545/26631067.2026.v8.i5a.748 ↗
Research areasAgricultural Practices and Plant GeneticsAgricultural Science and FertilizationPlant Growth and Agriculture Techniques
Abstract
Author-writtenThe field experiment was conducted to study the effect of planting geometry and nutrition on plant growth and seed yield of okra at NSP, UAS, Bangalore. The experiment was laid out in FRCBD design with 12 treatment combinations replicated thrice which includes three different planting geometry S0 (60 × 45 cm), S1 (60 × 30 cm) and S2 (60 × 60 cm), four levels of nutrients N0 (100% RDF), N1 (125% RDF), N2 (150% RDF) and N3 (200% RDF) (RDF: 156.25: 93.75: 78.75 kg NPK ha-1). Results revealed that S2 and N1 are superior in plant growth and seed yield attributes viz., plant height at 30, 60, 90 and at harvest (19.66, 53.47, 164.97, 171.79 cm), number of branches at 60, 90 and at harvest (3.17, 3.90, 3.90), internodal length (10.80 cm) and chlorophyll content (60.83 SPAD unit), Days to 50% flowering (46.0), Days to maturity (110.67), maximum seed yield plant-1 (69.06 g), seed yield plot-1 (1115.45 g) and seed yield ha-1 (19.36 q).
Summary
Source-checkedPlain-language reading of the full paper, prepared with AI and checked against the text. Each point links to the authors' own words.
Why it matters
- Okra is a flowering plant in the Malvaceae family, valued globally for its edible green pods. View evidence ↗
- The crop is nutritionally significant as it provides essential carbohydrates, proteins, fats, minerals, and vitamins. View evidence ↗
- Optimizing plant population is critical for maximizing light interception and the efficient use of moisture and nutrients to increase yield. View evidence ↗
The question
- The study aimed to evaluate how different planting geometries and nutrition levels affect the growth and seed yield of okra cv. Arka Anamika. View evidence ↗
What they did
- The researchers used a Factorial Randomized Complete Block Design (FRCBD) with 12 treatment combinations replicated three times, testing three spacing geometries (60x45, 60x30, and 60x60 cm) and four nutrient levels (100%, 125%, 150%, and 200% of the Recommended Dose of Fertilizer). View evidence ↗
- Field and laboratory experiments were conducted at NSP, UAS, Bangalore, focusing on nutrition and fruit position. View evidence ↗
What they found
- Neither planting geometry nor nutrient levels had a significant effect on the number of days to 50% flowering. View evidence ↗
- There were no significant differences in the days to maturity across the various treatments. View evidence ↗
- The S2N1 treatment achieved the highest seed yield per plant at 69.06 g, whereas S1N0 had the lowest at 20.86 g. View evidence ↗
- Seed yield per plot was maximized in the S2N1 treatment (1115.45 g) and minimized in S1N0 (681.62 g). View evidence ↗
- The highest seed yield per hectare was recorded for S2N1 at 19.36 q, while S1N0 recorded the lowest at 11.83 q. View evidence ↗
Visual summary
3 visualsIllustrations explain the paper; charts are replotted from the paper's own table values.
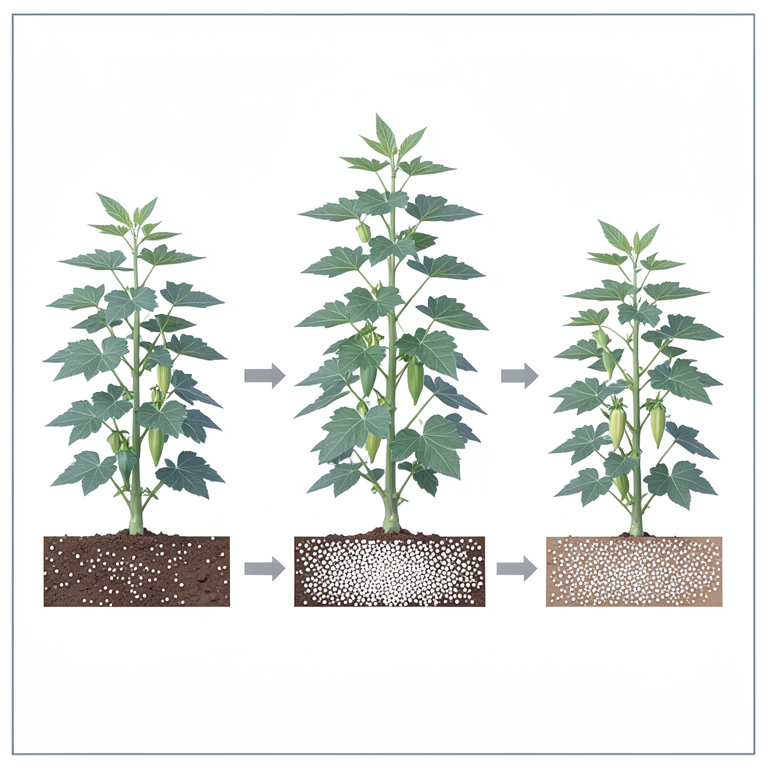
Experimental Setup
AI-generated conceptual illustration (okra plants (cv. Arka Anamika)). It explains the idea and does not show study data.
View source evidence ↗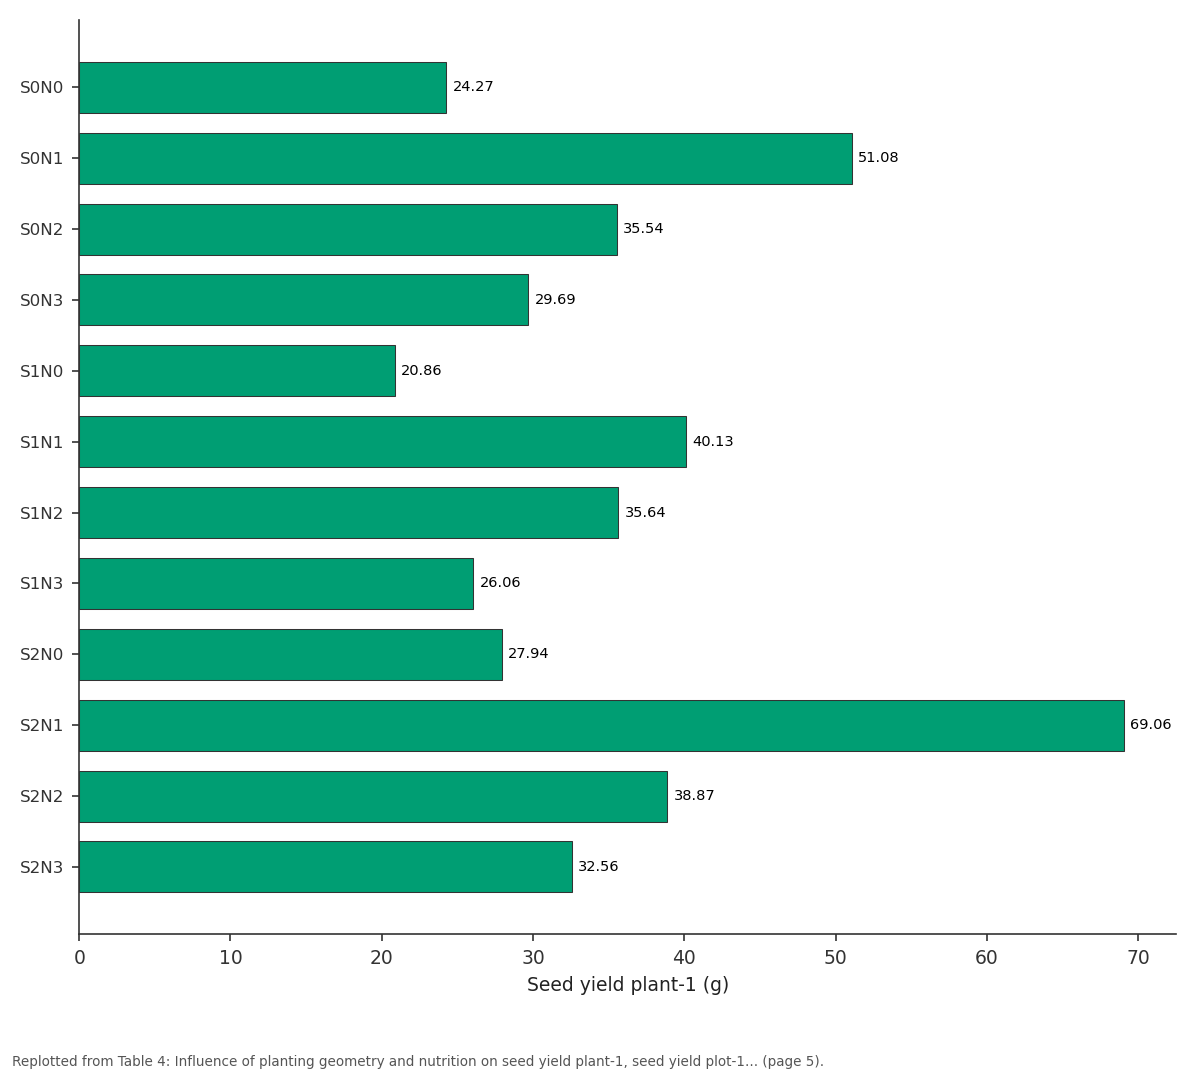
Seed yield plant-1 (g): S0N0 vs S0N1 vs S0N2 vs S0N3 vs S1N0
Replotted from Table 4 (page 5) of the original paper. Every bar is the paper's own table value.
View source evidence ↗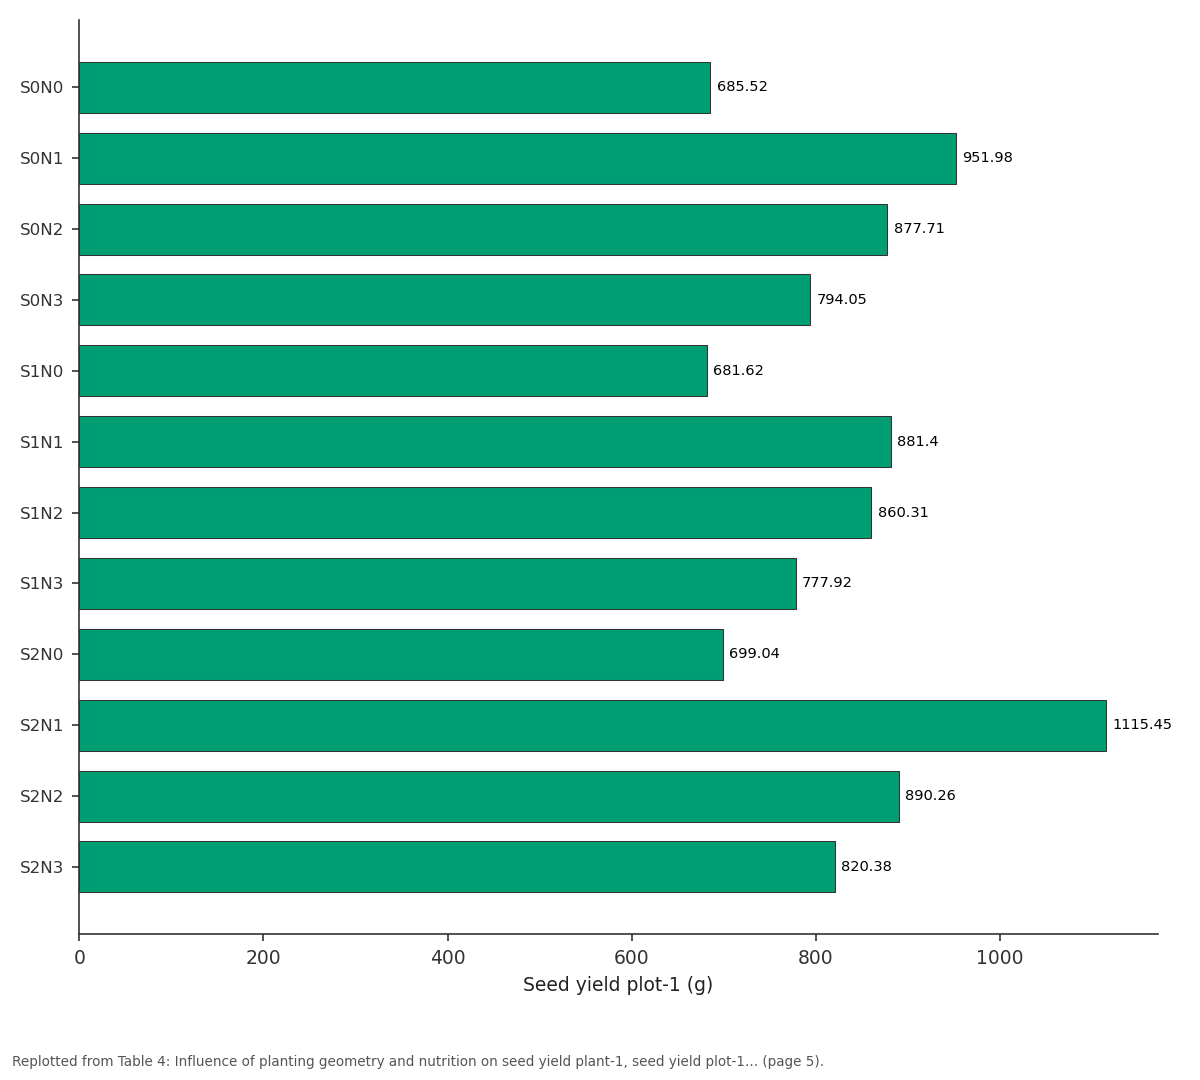
Seed yield plot-1 (g): S0N0 vs S0N1 vs S0N2 vs S0N3 vs S1N0
Replotted from Table 4 (page 5) of the original paper. Every bar is the paper's own table value.
View source evidence ↗Figures & tables
From the original paper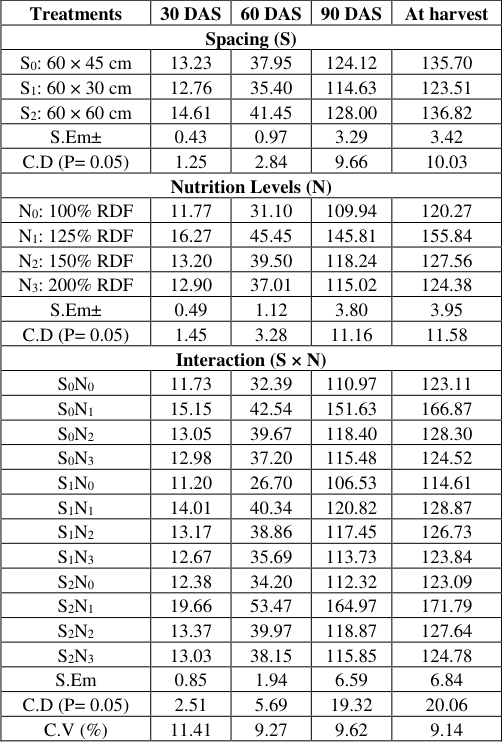 Table 1
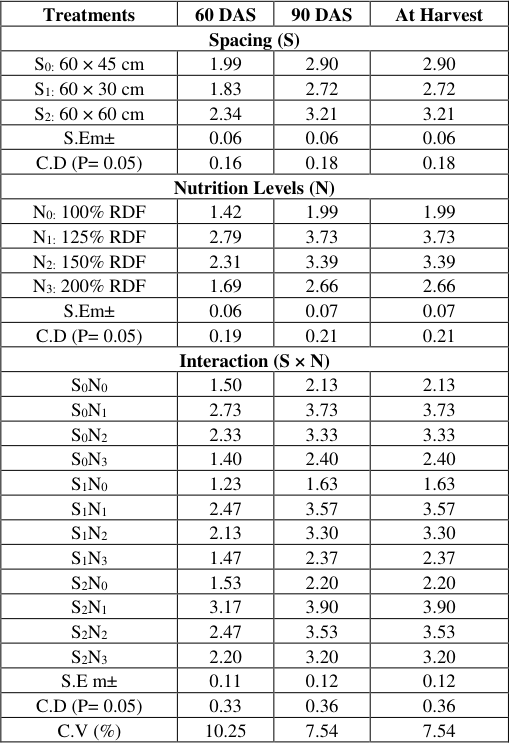 Table 2
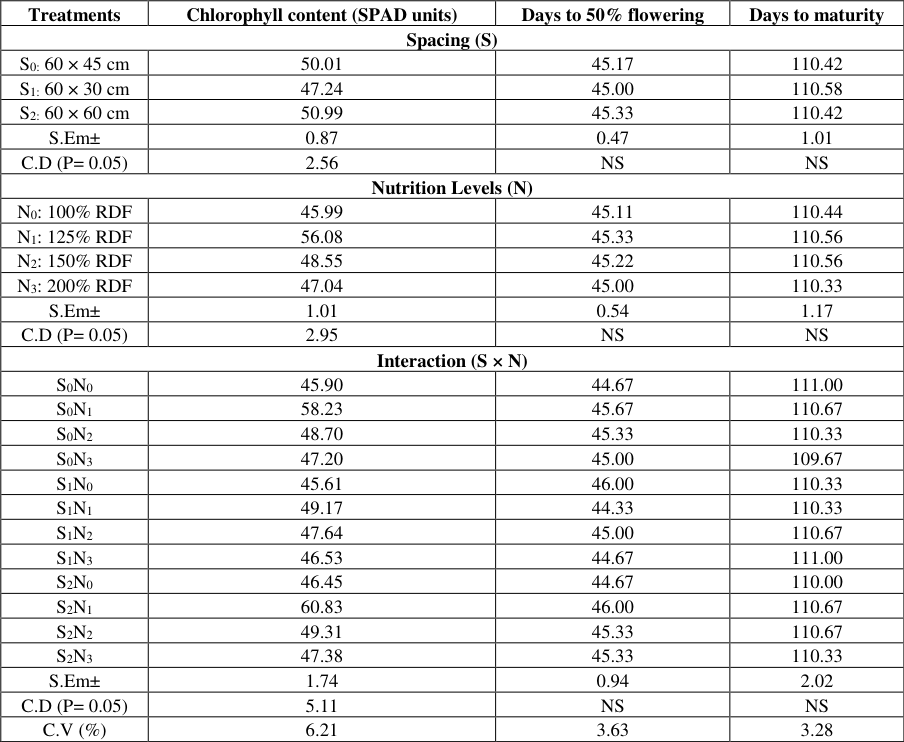 Table 3
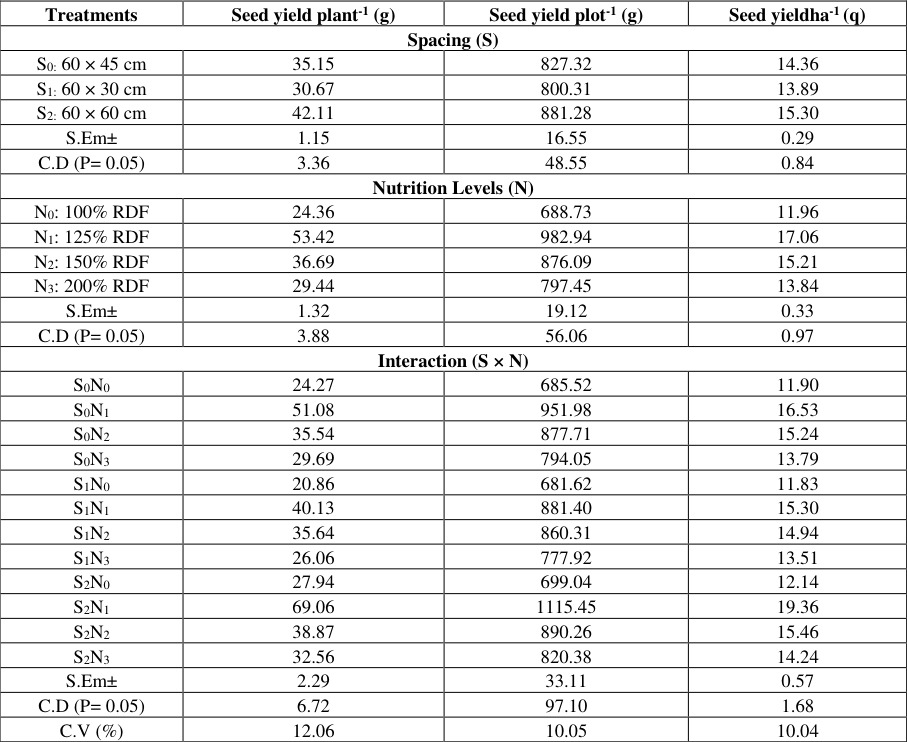 Table 4
Introduction
Okra (Abelmoschus esculentus (L.) Moench) known in many English-speaking countries as ladies finger, bhindi, bamila, ochro or gumbo, is a flowering plant in the Malvaceae family and it is valued for its edible green pods. It is widely cultivated in tropics, sub-tropics and warm temperate regions around the world. Okra originated near the equator in Africa. It is an important pan-tropical vegetable, particularly in West Africa, India, Brazil and Southern USA. It is widely cultivated in Uttar Pradesh, Assam, Bihar, Orissa, Maharashtra, West Bengal and Karnataka states of India. India is second largest producer of okra after China. In India, okra is grown during pre-kharif (March to June) and kharif season (July to October). In India okra is cultivated in an area of 511 thousand ha with an annual production of 5849 thousand tonnes and productivity of 11.5 t ha -1 . In Karnataka, okra occupies an area of 9.66 thousand hectares with an annual production of 79.61 thousand tonnes and productivity of 8.24 tha -1 . (Horti.Statistics at glance, 2015) [7] . Okra plays a significant role in human nutrition by providing carbohydrates, protein, fat, minerals and vitamins that are generally deficient in basic foods. Okra is a vegetable valued for many of its properties. The fruits are used in making soup, salad and for flavoring when dried and powdered. Sometime, the seeds are roasted and used as a substitute for coffee. Its ripe fruit and stems contain crude fiber, which is used in the paper industry. The tender fruits contain minerals especially calcium, magnesium, iron, phosphorus, protein, vitamin A and C including riboflavin as well as high mucilage (Ndaeyo et al., 2005) [14] . Its every 100 g green pod contains among others, protein 1.8 g, carbohydrate 6.4g, fiber 1.2 g, vitamin C 18 mg and Ca 90 mg. Mature okra seeds are good source of protein and oil and it has been known to be very important in nutritional quality. Okra accounts for 60 per cent of export of fresh vegetables excluding potato, onion and garlic (Rashid, 1999) [15] . Due to this high prominence, okra has been a beneficiary of worldwide research over many years resulting in many varieties currently been planted in different parts of the world. Seed is very important input on which the ultimate yield of the crop depends. To obtain maximum seed yield with superior quality, the proper growth of the plant and its fruits are desired. Most of the studies are concerned with the development of varieties adopted to specific other needs while seed quality has been neglected.
Hence, there is need to give utmost attention to both monetary (fertilizers) and non-monetary (spacing and fruit position) inputs for improvement of seed yield and quality. Optimum plant population provides conditions for maximum light interception right from early period of crop growth and it ensures the plants to grow uniformly and properly through efficient utilization of moisture, nutrients and lack of it thus eases to produce maximum yield in okra. The yield and quality of commercial vegetables are directly related to plant population (Samlind and Sam Ruban, 2007) [16] . By changing planting geometry, it is possible to achieve better plant growth which in turn contributes to a higher yield. Further, it has been reported that optimum plant population is the key element for better yields of okra, as plant growth and yield are affected by intra and inter row spacing (Amjad et al., 2002) [2] . Nutrient is one of the most important inputs contributing to production of crop because it increases productivity and improves seed yield and quality (Shiyab et al., 2014) [17] . Among the nutrient, nitrogen (N) exhibits a high positive response in okra. It plays an important role in chlorophyll, protein, nucleic acid, hormone and vitamin synthesis and also helps in cell division, cell elongation. Phosphorus (P) involved in photosynthesis and respiration and it helps in enhancing root growth, formation of root nodules, and crop maturity. Potassium (K) plays a unique role in osmotic regulation, opening and closing of stomata and also improves the color, flavors and size of fruits. (Bhende et al., 2015) [4] . Present nutritional rates are insufficient to sustain higher yields and to replenish nutrient removal by the crop due to continuous cropping and use of high yielding varieties, there is depletion of nutrients from soil. Hence, to meet the crop demand in long run, there is a need to apply NPK nutrients based on soil fertility status. So, present investigation will helpful to standardize the nutrition level which influence on seed yield and quality in okra. Various factors influence the seed quality in okra among which position of fruit is of great significance. Ability of seeds to produce a greater number of normal and vigorous seedlings depends on fruit position which affects proper seed filling and maturation due to the competition for assimilates between fruits and within fruit distresses seed set and development (Bertin, 1998) [5] . Fruits produced at the base; middle and apex positions of the stem would have a variation in seed quality due to the varied flow of nutrients (source-sink relationship) and microenvironment experienced by the seed due to its position on the parent plant. (Kortse P. Alohoand Oketa Anita, 2016) [10] .
Materials and Methods
Seeds of okra variety Arka Anamika was obtained from Indian Institute of Horticultural Research (IIHR), Hessaraghatta, Bengaluru. The field and laboratory experiments were conducted to study the nutrition and position of fruit on plant growth, seed yield and quality of okra at NSP, UAS, Bangalore. The experiment was laid out in FRCBD design with 12 treatment combinations replicated thrice which includes three different planting geometry S0 (60 × 45 cm), S1 (60 × 30 cm) and S2 (60 × 60 cm), four levels of nutrients N0 (100% RDF), N1 (125% RDF), N2 (150% RDF) and N3 (200% RDF) (RDF: 156.25: 93.75: 78.75 kg NPK ha -1 ) and Individual plant was divided into three parts (top, middle and bottom) harvested fruits separately and will be evaluated for following plant growth and yield parameters
Results and Discussion
Results and Discussion
The plant height at 30 days after sowing differed significantly due to planting geometry. The maximum plant height was recorded in spacing S2 (14.61 cm) followed by S0 (13.23 cm) and least was recorded in spacing S1 (12.76 cm). There was significant difference in plant height was observed due to various levels of nutrients. Among the different nutritional levels, N1 (125% RDF) recorded the highest plant height (16.27 cm) while, the lowest plant height was recorded in control (N0) (11.77 cm). The plant height at 30 days after sowing was found to be differed significantly due to interaction of planting geometry and nutrition. The maximum plant height at 30 days after sowing was recorded in S2N1 (19.66 cm) and least recorded in S1N0 (11.20 cm). The plant height at 60 days after sowing differed significantly due to planting geometry. The maximum plant height was observed in spacing S2 (41.45 cm) followed by S0 (37.95 cm) and least was noticed in spacing S1 (35.40 cm). There was a significant difference among different nutrient levels with respect to plant height at 60 DAS. Among different treatment N1 (125% RDF) recorded the highest plant height (45.45 cm) while, the lowest plant height was recorded in control (N0) (31.10 cm). The plant height at 60 days after sowing was found to be differed significantly due to interaction of planting geometry and nutrition. The maximum plant height at 60 days after sowing was recorded in S2N1 (53.47 cm) and least recorded in S1N0 (26.70 cm). The planting geometry significantly influenced the plant height at 90 DAS. Among the different plant geometry highest plant height was noticed in S2 (128.00 cm) followed by S0 (124.12 cm). However, less was in S1 (114.63 cm). The results revealed that, there was significant difference with respect to plant height at 90 DAS due to influence of nutritional levels. Maximum plant height was recorded in N1 (145.81 cm) followed by N2 (118.24 cm). Whereas, least was in N0 (109.94 cm). The interaction effects of planting geometry and nutrition found to be significant for plant height at 90 DAS. Highest plant height was registered in S2N1 (164.97 cm) followed by S0N1 (151.63 cm). While, least was in S1N0 (106.53 cm). Plant height differed significantly due to different planting geometry at harvest. Among them S2 (136.82 cm) documented significantly higher plant height on par with S0 (135.70 cm) and least was noticed in S1 (123.51 cm). There was significant difference among the nutrient levels for plant height. Maximum plant height was in N1 (155.84 cm) followed by N2 (127.56 cm). While, minimum was in N0 (120.27 cm). Statistically significant differences were found among interactions of planting geometry and nutrition with respect to plant height at harvest. Maximum plant height was documented in S2N1 (171.19 cm) and minimum was in S1N0 (114.61 cm). These results are in conformity with the findings of Feleafel et al. (2005) [21] , Harish chand Ram et al. (2013) [6] , Uddin et al. (2014) [20] , Inder Jeet Sharma et al. (2014) [9] , Vikash Kumar et al. (2016) [19] , and Amanga Okello Baw et al. (2017) [1] in okra.
Number of branches
The observations regarding to number of branches as influenced by planting geometry and nutrition and their interactions were presented in the Table 2.
| Treatments | 60 DAS | 90 DAS | At Harvest |
|---|---|---|---|
| Spacing (S) | |||
| S0: 60 × 45 cm | 1.99 | 2.90 | 2.90 |
| S1: 60 × 30 cm | 1.83 | 2.72 | 2.72 |
| S2: 60 × 60 cm | 2.34 | 3.21 | 3.21 |
| S.Em± | 0.06 | 0.06 | 0.06 |
| C.D (P= 0.05) | 0.16 | 0.18 | 0.18 |
| Nutrition Levels (N) | |||
| N0: 100% RDF | 1.42 | 1.99 | 1.99 |
| N1: 125% RDF | 2.79 | 3.73 | 3.73 |
| N2: 150% RDF | 2.31 | 3.39 | 3.39 |
| N3: 200% RDF | 1.69 | 2.66 | 2.66 |
| S.Em± | 0.06 | 0.07 | 0.07 |
| C.D (P= 0.05) | 0.19 | 0.21 | 0.21 |
| Interaction (S × N) | |||
| S0N0 | 1.50 | 2.13 | 2.13 |
| S0N1 | 2.73 | 3.73 | 3.73 |
| S0N2 | 2.33 | 3.33 | 3.33 |
| S0N3 | 1.40 | 2.40 | 2.40 |
| S1N0 | 1.23 | 1.63 | 1.63 |
| S1N1 | 2.47 | 3.57 | 3.57 |
| S1N2 | 2.13 | 3.30 | 3.30 |
| S1N3 | 1.47 | 2.37 | 2.37 |
| S2N0 | 1.53 | 2.20 | 2.20 |
| S2N1 | 3.17 | 3.90 | 3.90 |
| S2N2 | 2.47 | 3.53 | 3.53 |
| S2N3 | 2.20 | 3.20 | 3.20 |
| S.E m± | 0.11 | 0.12 | 0.12 |
| C.D (P= 0.05) | 0.33 | 0.36 | 0.36 |
| C.V (%) | 10.25 | 7.54 | 7.54 |
Table text extracted from the original PDF; superscript letters are shown inline. The original table image is below.
View original table image
Number of branches at 30, 60, 90 and at harvest
Number of branches recorded zero at 30 days after sowing. Number of branches differed significantly among the planting geometry in which maximum number of branches noticed in spacing S2 (2.34) followed by S0 (1.99), however least was observed in S1 (1.83). Significant difference noticed among different nutrient levels for number of branches per plant at 60 DAS. The number of branches per plant was maximum in N1 (2.79). The least number of branches per plant were recorded in N0(1.42). The interaction of planting geometry and nutrition for number of branches was found to be differed significantly. Among the treatments, S2N1 (3.17) noted highest while S1N0 recorded a smaller number of branches (1.23). Number of branches was differed significantly among treatments. Highest number of branches was registered in S2 (3.21). Whereas, lowest number of branches was noticed in S1 (2.90). Significantly differed the number of leaves at 90 DAS among the treatments. The number of branches was maximum at N1 (3.73). The lowest number of branches was observed in N0 (1.99). The number of branches at 90 days after sowing was found to be differed significantly due to interaction of planting geometry and nutrition. Maximum number of branches per plant was noticed in S2N1 (3.90) which was statistically on par with S0N1 (3.73). Whereas, lowest number of branches per plant was registered in S1N0 (1.63). There was significant difference observed on number of branches among treatments. Highest number of branches was cataloged in S2 (3.21). Whereas, lowest number of branches was noticed in S1 (2.90). Significantly differed the number of leaves at 90 DAS among the treatments. The number of branches were maximum at N1 (3.73). The lowest number of branches was observed in N0 (1.99). Significant difference was noticed for number of branches at harvest among the interaction of planting geometry and nutrition Maximum number of branches per plant was noticed in S2N1 (3.90) which was statistically on par with S0N1 (3.73). Whereas, lowest number of branches per plant was cataloged in S1N0 (1.63). The result revealed that a greater number of branches produced under wider spacing (60 × 60 cm) and 125% RDF might be due to wider spacing helped the plant to utilize its energy properly in branching because there was neither much competition for light nor overlapping from adjacent okra plants within the row. Similar results were reported by Ijoyah et al. (2010) [23] , Harish chand Ram et al. (2013) [6] .
Chlorophyll content (SPAD value)
The observations on chlorophyll content (SPAD value) as influenced by planting geometry, nutrition and their interactions were furnished in the Table 3. SPAD value was differed significantly among treatments. Highest chlorophyll content was reported in S2 (50.99) which was statistically on par with S0 (50.01). Whereas, lowest chlorophyll content was noticed in S1 (47.24). There was significant difference observed for chlorophyll content among the nutrient levels. Highest chlorophyll content recorded in N1 (56.08 SPAD units). While, the minimum chlorophyll content was noticed in control (N0) (45.99 SPAD units). The interaction of planting geometry and nutrition for chlorophyll content was found to be significant. The highest chlorophyll content was recorded in S2N1 (60.83 SPAD units) on par with S0N1 (58.23 SPAD units) and the lowest was reported in S1N0 (45.61 SPAD units). The improvement in morphological parameters under the wider spacing and higher level of NPK application might have resulted in larger canopy development and presumably higher chlorophyll content of leaves as nutrients actively participate in its formation. Similar result obtained by Jana et al. (2010) [22] in okra.
| Treatments | Chlorophyll content (SPAD units) | Days to 50% flowering | Days to maturity |
|---|---|---|---|
| Spacing (S) | |||
| S0: 60 × 45 cm | 50.01 | 45.17 | 110.42 |
| S1: 60 × 30 cm | 47.24 | 45.00 | 110.58 |
| S2: 60 × 60 cm | 50.99 | 45.33 | 110.42 |
| S.Em± | 0.87 | 0.47 | 1.01 |
| C.D (P= 0.05) | 2.56 | NS | NS |
| Nutrition Levels (N) | |||
| N0: 100% RDF | 45.99 | 45.11 | 110.44 |
| N1: 125% RDF | 56.08 | 45.33 | 110.56 |
| N2: 150% RDF | 48.55 | 45.22 | 110.56 |
| N3: 200% RDF | 47.04 | 45.00 | 110.33 |
| S.Em± | 1.01 | 0.54 | 1.17 |
| C.D (P= 0.05) | 2.95 | NS | NS |
| Interaction (S × N) | |||
| S0N0 | 45.90 | 44.67 | 111.00 |
| S0N1 | 58.23 | 45.67 | 110.67 |
| S0N2 | 48.70 | 45.33 | 110.33 |
| S0N3 | 47.20 | 45.00 | 109.67 |
| S1N0 | 45.61 | 46.00 | 110.33 |
| S1N1 | 49.17 | 44.33 | 110.33 |
| S1N2 | 47.64 | 45.00 | 110.67 |
| S1N3 | 46.53 | 44.67 | 111.00 |
| S2N0 | 46.45 | 44.67 | 110.00 |
| S2N1 | 60.83 | 46.00 | 110.67 |
| S2N2 | 49.31 | 45.33 | 110.67 |
| S2N3 | 47.38 | 45.33 | 110.33 |
| S.Em± | 1.74 | 0.94 | 2.02 |
| C.D (P= 0.05) | 5.11 | NS | NS |
| C.V (%) | 6.21 | 3.63 | 3.28 |
Table text extracted from the original PDF; superscript letters are shown inline. The original table image is below.
View original table image
Days to 50 per cent flowering
The reviewed results pertaining on days to 50 per cent flowering as influenced by planting geometry, nutrition and their interactions are presented in Table 3. The data revealed that days to 50 per cent flowering did not show significant difference among the plant spacings. However, the days to 50 per cent flowering was ranged from 45.00 to 45.33 days among the treatments. Days to 50 per cent flowering did not differ significantly among the nutrient levels. However, number of days to 50 per cent flowering was ranged from 45.00 to 45.33 days. The interaction of planting geometry and nutrition for days to 50 per cent flowering was found to be significant. Days to 50 per cent flowering was ranged from 44.33 to 46.00 days among the interactions. The result showed that days to 50 per cent flowering statistically nonsignificant might be due to flowering neither affected by spacing nor nutrition because of supremacy of varietal character and genetic constitution. Similar trend noted by Sharma et al. (2016) [25] in okra. Pruthvishree et al., (2025a, 2025b) [28,29]
Days to maturity
The observations on days to maturity as influenced by planting geometry, nutrition and their interactions are presented in Table 3. Days to maturity did not show any significant difference among the treatments. However, maximum number of days to maturity was ranged from 110.42 to 110.58 days. Days to maturity did not differ significantly among the nutrient levels. However, the days to maturity was ranged from 110.33 to 110.56 days among the treatments. The interaction of planting geometry and nutrition for days to maturity was found to be significant days to maturity was ranged from 109.67 to 111.00 days among the interactions. There was no significant difference for days to maturity might be due to dominant effect of varietal character and moreover it is influenced by number of factors especially weather and climatic condition in an area. Simililar result reported by Narendra Kumar Meena et al. (2017) [26] and Gangaraju et al., (2023) [27] in Maize.
The results on seed yield per plant as influenced by planting geometry, nutrition and interaction are presented in Table 4. Seed yield per plant had significant differences due to planting geometry. Highest seed yield per plant was obtained in S2 (42.11 g) followed by S0 (35.15 g). However, lowest was in S1 (30.67 g). There were significant differences among the nutrition with respect to seed yield per plant. Highest seed yield per plant was proclaimed in N1 (53.42 g) followed by N2 (36.69 g). While, lowest was noticed in N0 (24.36 g). Seed yield per plant showed statistically significant differences due to interaction effect of plant geometry and nutrition. Highest seed yield per plant obtained S2N1 (69.06 g) followed by S0N1 (51.08 g) and least was noted in S1N0 (20.86 g). Maximum seed yield per plant might be due to a greater number of fruits and maximum fruit length and diameter resulting from wider spacing and balanced fertilization. The results uphold the findings of Humayun Khan et al. (2000) [8] , Soni et al. (2006) [18] and Priyanka et al., (2017) [30] .
| Treatments | Seed yield plant-1 (g) | Seed yield plot-1 (g) | Seed yieldha-1 (q) |
|---|---|---|---|
| Spacing (S) | |||
| S0: 60 × 45 cm | 35.15 | 827.32 | 14.36 |
| S1: 60 × 30 cm | 30.67 | 800.31 | 13.89 |
| S2: 60 × 60 cm | 42.11 | 881.28 | 15.30 |
| S.Em± | 1.15 | 16.55 | 0.29 |
| C.D (P= 0.05) | 3.36 | 48.55 | 0.84 |
| Nutrition Levels (N) | |||
| N0: 100% RDF | 24.36 | 688.73 | 11.96 |
| N1: 125% RDF | 53.42 | 982.94 | 17.06 |
| N2: 150% RDF | 36.69 | 876.09 | 15.21 |
| N3: 200% RDF | 29.44 | 797.45 | 13.84 |
| S.Em± | 1.32 | 19.12 | 0.33 |
| C.D (P= 0.05) | 3.88 | 56.06 | 0.97 |
| Interaction (S × N) | |||
| S0N0 | 24.27 | 685.52 | 11.90 |
| S0N1 | 51.08 | 951.98 | 16.53 |
| S0N2 | 35.54 | 877.71 | 15.24 |
| S0N3 | 29.69 | 794.05 | 13.79 |
| S1N0 | 20.86 | 681.62 | 11.83 |
| S1N1 | 40.13 | 881.40 | 15.30 |
| S1N2 | 35.64 | 860.31 | 14.94 |
| S1N3 | 26.06 | 777.92 | 13.51 |
| S2N0 | 27.94 | 699.04 | 12.14 |
| S2N1 | 69.06 | 1115.45 | 19.36 |
| S2N2 | 38.87 | 890.26 | 15.46 |
| S2N3 | 32.56 | 820.38 | 14.24 |
| S.Em± | 2.29 | 33.11 | 0.57 |
| C.D (P= 0.05) | 6.72 | 97.10 | 1.68 |
| C.V (%) | 12.06 | 10.05 | 10.04 |
Table text extracted from the original PDF; superscript letters are shown inline. The original table image is below.
View original table image
The observation regarding seed yield per plot as influenced by planting geometry, nutrition and interaction are presented in Table 4. Significant differences were found for seed yield per plot in different planting geometry. Highest seed yield per plot was recorded in S2 (881.28 g). However, least was observed in S1 (800.31 g). Influence of different nutrient levels exhibited significant effect on seed yield per plot. Maximum seed yield per plot was observed in N1 (982.94 g) while, minimum was in N0 (688.73 g). The interaction effects between planting geometry and nutrition regarding seed yield per plot were found to be significant. Highest seed yield per plot was noticed in S2N1 (1115.45 g), while, lowest was in S1N0 (681.62 g). This increase in seed yield might be due to healthy and luxuriant plants had grown under wider spacing and higher NPK vigorous vegetative growth with accelerated photosynthetic activities thereby increases the abundant supply of carbohydrates to the plant and synthesized photosynthates might have translocated in growing fruits having more demand of assimilates, which consequently led to production bold and heavier seed resulted in higher seed yield per plot. The results are in conformity with those of Humayun Khan et al. (2000) [8] , Soni et al. (2006) [18] , Inder Jeet Sharma et al. (2014) [9] .
Seed yield ha -1 (q)
The data pertaining to seed yield per ha as influenced by planting geometry, nutrition and interaction are depicted in Table 4. The influence of plant geometry on seed yield per ha was differed significantly. seed yield per ha was more in S2 (15.30 q). Whereas less was in S1 (13.89 q). Seed yield per ha showed statistically significant differences due to influence of nutrient levels. Maximum seed yield per ha was recorded in N1 (17.06 q) while, minimum was in N0 (11.96 q). Significant differences were observed for seed yield per ha due to interaction effect of planting geometry and nutrition. S2N1 (19.36 q ha -1 ) and least was in S1N0 (11.83 q). Higher number of seeds per fruit, more boldness of seed imparting weight and increasing the seed yield per plant and strengthens the fact that less competition resulted in higher availability of resources meant for more partitioning of inputs in yield factors such as nutrients, moisture and sunlight per plant due to less plant density. It is an established fact that nitrogen promotes vegetative growth consequently resulting in more yields. P and K are also responsible for better growth, maturity seed yield. All these three nutrients affected positively on the performance of plant and yield contributing traits which resulted in higher seed yield per ha. These findings are in agreement with the results of Humayun Khan et al. (2000) [8] , Soni et al. (2006) [18] , Moniruzzaman et al. (2007) [11] , Inder Jeet Sharma et al. (2014) [9] , Navdeep Singh Brar and Daljeet Singh (2016) [12] .
Figures and tables from the paper
| Treatments | 30 DAS | 60 DAS | 90 DAS | At harvest |
|---|---|---|---|---|
| Spacing (S) | ||||
| S0: 60 × 45 cm | 13.23 | 37.95 | 124.12 | 135.70 |
| S1: 60 × 30 cm | 12.76 | 35.40 | 114.63 | 123.51 |
| S2: 60 × 60 cm | 14.61 | 41.45 | 128.00 | 136.82 |
| S.Em± | 0.43 | 0.97 | 3.29 | 3.42 |
| C.D (P= 0.05) | 1.25 | 2.84 | 9.66 | 10.03 |
| Nutrition Levels (N) | ||||
| N0: 100% RDF | 11.77 | 31.10 | 109.94 | 120.27 |
| N1: 125% RDF | 16.27 | 45.45 | 145.81 | 155.84 |
| N2: 150% RDF | 13.20 | 39.50 | 118.24 | 127.56 |
| N3: 200% RDF | 12.90 | 37.01 | 115.02 | 124.38 |
| S.Em± | 0.49 | 1.12 | 3.80 | 3.95 |
| C.D (P= 0.05) | 1.45 | 3.28 | 11.16 | 11.58 |
| Interaction (S × N) | ||||
| S0N0 | 11.73 | 32.39 | 110.97 | 123.11 |
| S0N1 | 15.15 | 42.54 | 151.63 | 166.87 |
| S0N2 | 13.05 | 39.67 | 118.40 | 128.30 |
| S0N3 | 12.98 | 37.20 | 115.48 | 124.52 |
| S1N0 | 11.20 | 26.70 | 106.53 | 114.61 |
| S1N1 | 14.01 | 40.34 | 120.82 | 128.87 |
| S1N2 | 13.17 | 38.86 | 117.45 | 126.73 |
| S1N3 | 12.67 | 35.69 | 113.73 | 123.84 |
| S2N0 | 12.38 | 34.20 | 112.32 | 123.09 |
| S2N1 | 19.66 | 53.47 | 164.97 | 171.79 |
| S2N2 | 13.37 | 39.97 | 118.87 | 127.64 |
| S2N3 | 13.03 | 38.15 | 115.85 | 124.78 |
| S.Em | 0.85 | 1.94 | 6.59 | 6.84 |
| C.D (P= 0.05) | 2.51 | 5.69 | 19.32 | 20.06 |
| C.V (%) | 11.41 | 9.27 | 9.62 | 9.14 |
Table text extracted from the original PDF; superscript letters are shown inline. The original table image is below.
View original table image
References
30 in the original paper- in Gambella region, Western Ethiopia. African Journal of Agricultural Research. 2017;12(16):1395-1403.
- Amjad M, Sultan M, Anjum MA, Ayyub CM. Response of okra (Abelmoschus esculentus L. Moench) to various doses of nitrogen and phosphorus and different plant spacings. Pakistan Journal of Scientific Research. 2002;13(1):19-29.
- Ballal A, Kadam AS. Okra crop growth and yield responses to different organic sources of nitrogen. International Journal of Agricultural Sciences. 2016;8(48):2042-2044.
- Bhende SK, Deshmukh HK, Nimbolkar PK, Dewangan RK, Nagone AH. Effect of phosphorus and potassium on quality attributes of okra cv. Arka Anamika. International Journal of Environmental Sciences. 2015;6(2):225-231.
- Bertin N, Gary C, Tchamitchian M, Vaissiere BE. Influence of cultivar, fruit position and seed content on tomato fruit weight during a crop cycle under low and high competition for assimilates. Journal of Horticultural Science and Biotechnology. 1998;73(4):541-548.
- Ram H, Khan MM, Singh PK. Effect of spacing and cultivars on growth and yield of okra (Abelmoschus esculentus (L.) Moench). Asian Journal of Horticulture. 2013;8(2):507-511.
- Horticultural Statistics at a Glance. Horticultural Statistics Division, Department of Agriculture, Government of India. 2015.
- T-13 under the agro-climatic conditions of Mingora, Swat. Pakistan Journal of Biological Sciences. 2000;3(12):2101-2104.
- Sharma IJ, Samnotra RK, Kumar V. Influence of biofertilizer application methods and inorganic fertilizers on growth, seed yield and economics of okra (Abelmoschus esculentus (L.) Moench) under subtropical irrigated area of Jammu. International Journal of Agricultural Sciences. 2014;10(1):322-328.
- Aloho KP, Anita O. Effects of planting date and fruit position on mother plant on the quality of okra (Abelmoschus esculentus L. Moench) seeds. Journal of Biology, Agriculture and Healthcare. 2016;6(2):1-6.
- Moniruzzaman M, Uddin MZ, Choudhury AK. Response of okra seed crop to sowing time and plant spacing in South Eastern hilly region of Bangladesh. Bangladesh Journal of Agricultural Research. 2007;32(3):393-402.
- Brar NS, Singh A, Singh DJ. Impact of nitrogen and spacing on the growth and yield of okra (Abelmoschus esculentus (L.) Moench). MATEC Web of Conferences. 2016;57:713-722.
- Kumar NB, Padmaja G, Rao PC. Effect of different levels of nitrogen and potassium on ascorbic acid, crude protein and crude fibre content of okra (Abelmoschus esculentus L.). International Journal of Pure and Applied Biosciences. 2017;5(4):882-886.
- Ndaeyo NU, Edu SU, John NM. Performance of okra as affected by organic and inorganic fertilizers on ultisol. Proceedings of the Annual Conference of Agricultural Society of Nigeria. 2005;39:206-209.
- Rashid MM. Sabji Biggan (Vegetable Science). 2nd ed. Dhaka: Rashid Publishing House; 1999.
- Samlind G, Sam Ruban J. Effect of different levels of nitrogen and spacings on crude protein of Amaranthus cv. CO-3. Asian Journal of Horticulture. 2007;2(1):222223.
- Shiyab S, Bassam AQ, Mohanad A, Mohammed S, Jamal A, Khaldon AS. Response of okra (Abelmoschus esculentus (L.)) to different levels of Hoagland's solution. Life Science Journal. 2014;11(10):1080.
- Soni N, Bharad SG, Gonge VS, Nandre DR, Ghawade SM. Effect of spacing and nitrogen levels on growth and seed yield of okra. International Journal of Agricultural Sciences. 2006;2(2):444-446.
- Kumar V, Dhankhar SK, Vilas CA, Yadav N. Effect of spacing on growth and yield parameters of two varieties of okra (Abelmoschus esculentus (L.) Moench). International Journal of Farm Sciences. 2016;6(1):163168.
- Uddin MJ, Hossain MI, Islam S, Mehraj H, Uddin AJ. Growth and yield of okra as influenced by different levels of nitrogen. International Journal of Business, Social Science Research. 2014;2(2):104-108.
- Feleafel MN, Ghoneim IM. Effect of plant density and nitrogen fertilization on vegetative growth, seed yield and quality of okra plants. Journal of Agriculture and Environmental Sciences. 2005;4(2):24-36.
- Jana JC, Guha S, Chatterjee R. Effect of planting geometry and nitrogen levels on crop growth, fruit yield and quality in okra grown during early winter in terai zone of West Bengal. Journal of Horticultural Science. 2010;5(1):30-33.
- Ijoyah M, Unah P, Fanen F. Response of okra (Abelmoschus esculentus L. Moench) to intra-row spacing in Makurdi, Nigeria. Agricultural and Biology Journal of North America. 2010;1(6):1328-1332.
- Morwal BR, Patel MC. Growth and yield of okra (Abelmoschus esculentus) as affected by date of sowing and spacing under north Gujarat condition. Journal of Krishi Vigyan. 2017;6(1):93-96.
- Sharma AK, Nigam R, Singh J. Influence of nitrogen, phosphorus and potash on growth and yield of okra (Abelmoschus esculentus L. Moench) cv. Pusa Sawani. International Journal of Agricultural Invention. 2016;1(1):119-123.
- Meena NK, Meena RK, Dhaka RS, Prakash O. Response of nitrogen, phosphorus and potassium levels on growth and yield of okra (Abelmoschus esculentus (L.) Moench) cv. Arka Anamika. International Journal of Pure and Applied Biosciences. 2017;5(4):1171-1177.
- Gangaraju N, Paramesh R, Siddaraju R, Harish MS. Effect of nutrient levels and split application of nitrogen on growth and seed yield of maize hybrid Hema at various stages of plant growth. Madras Journal of Agriculture. 2023;102:131-134.
- Pruthvishree C, Paramesh R, Siddarudh S, Arvind Kumar PR, Harish MS. Effect of plant nutrition and fruit position on seed quality of okra cv. Arka Anamika. International Journal of Agriculture and Food Science. 2025a;7(7):662-668. doi:10.33545/2664844X.2025.v7.i7i.583.
- Pruthvishree C, Paramesh R, Siddarudh S, Arvind Kumar PR, Harish MS. Study of planting geometry and plant nutrition on seed quality parameters of okra cv. Arka Anamika. International Journal of Horticulture and Food Science. 2025b;7(7):96-100. doi:10.33545/26631067.2025.v7.i7b.341.
- Priyanka M, Gurumurthy R, Deshpande VK. Influence of synchronization techniques and dates of sowing on nicking in parental lines of pearl millet hybrid BPMH-3 seed production. Advances in Crop Science and Technology. 2017;5(6). doi:10.4172/2329-8863.1000319.
Cited by 1
From OpenAlex, OpenCitations and reference lists read by Scinovex
- Influence of growth promoters on seed quality in relation to positional polymorphism in sesamum (sesamum indicum L.)
Kavyashree G, Parashivamurthy, BN Radha, Harish MS, Joseph Raju Thota, Siddarudh Singadi · International Journal of Biology Sciences · 2026
India being the world's largest producer of sesamum, struggles with low yields due to rainfed farming and underdeveloped practices. Sesamum, valued for its high-quality oil and adaptability holds significant potential for productivity improvement. The use of growth promoters plays a crucial role in enhancing crop productivity and quality by influencing key physiological processes in plants. This study evaluated the impact of growth promoters on seed quality and positional polymorphism of sesamum Cv. GKVK S-1 using an FCRD design with foliar sprays of different growth promoter such as NAA, asco