
Research article · 2026 · Full text
International Journal of Advanced Chemistry ResearchAssessment of the reverse osmosis system's effectiveness in eliminating impurities and enhancing dialysis water quality
Volume 8(5) · Pages 23–28 · DOI: 10.33545/26646781.2026.v8.i5a.671 ↗
Research areasMembrane Separation TechnologiesDialysis and Renal Disease ManagementWater Treatment and Disinfection
Abstract
Author-writtenThis study sought to assess the chemical and physical characteristics of dialysis water as well as the effectiveness of a reverse osmosis plant in eliminating impurities in the summer and winter. Several important parameters, including pH, electrical conductivity, total dissolved solids, phosphates, alkalinity, turbidity, total hardness, chloride, and heavy metals (Fe, Pb, Cr, Cd, Zn, Ni), were measured as part of the analysis. The pH levels, which ranged from 7.6 to 8.2 in the source water and from 7.9 to 8.0 after treatment, were found to be within acceptable bounds. In summer and winter, electrical conductivity significantly decreased from 358 and 253 µS/cm to 2.9 and 4.5 µS/cm, respectively. Additionally, total dissolved solids levels dropped from 175 and 124 ppm to 1 and 2 ppm, resulting in excellent removal efficiencies of 98.39% and 99.43%, respectively. In terms of the other metrics, turbidity dropped from 9.8 and 0.9 NTU to 0.1 and 0.07 NTU with efficiencies of 98.98% and 92.22%, while alkalinity dropped from 138 and 92 ppm to 3 and 8 ppm with efficiencies of 97.83% and 91.30%. Chloride levels dropped from 19 and 16.2 ppm to 7.1 and 3.5 ppm with efficiency of 62.63% and 78.40%, while total hardness dropped from 188 and 162 ppm to 20 and 12 ppm with removal rates of 89.36% and 92.59%. Regarding the other parameters, alkalinity decreased from 138 and 92 ppm to 3 and 8 ppm with efficiencies of 97.83% and 91.30%, while turbidity decreased from 9.8 and 0.9 NTU to 0.1 and 0.07 NTU with efficiencies of 98.98% and 92.22%. Chloride levels dropped from 19 and 16.2 ppm to 7.1 and 3.5 ppm with efficiency of 62.63% and 78.40%, while total hardness dropped from 188 and 162 ppm to 20 and 12 ppm with removal rates of 89.36% and 92.59%. These results demonstrate the efficiency of the reverse osmosis facility in removing dissolved contaminants and physical traits. Due to its poor efficacy in removing certain heavy metals, particularly lead and cadmium, additional treatment procedures must be put in place to ensure the safety of dialysis water.
Summary
Source-checkedPlain-language reading of the full paper, prepared with AI and checked against the text. Each point links to the authors' own words.
Why it matters
- Dialysis is a critical process for patients with renal failure, allowing them to remove metabolic waste and toxins from their blood. View evidence ↗
- Water purity is vital because a single dialysis session exposes a patient to between 90 and 190 liters of water. View evidence ↗
- Chemical pollutants and heavy metals in dialysis water can easily pass through semipermeable membranes into the patient's circulation, potentially causing metal poisoning. View evidence ↗
The question
- The study aims to evaluate the quality of water in dialysis units and the effectiveness of reverse osmosis (RO) systems in removing chemical pollutants to meet medical standards. View evidence ↗
What they did
- The research was conducted in 2025 at a hemodialysis unit in the Hawija District of Kirkuk Governorate, Iraq. View evidence ↗
- Water samples were collected in 1-liter sterile bottles both before and after treatment by the reverse osmosis system. View evidence ↗
- The study used atomic absorption spectroscopy for heavy metals, a Jenway 3310 for pH, an EC meter BC 3020 for conductivity and TDS, and a HACH DR3900 spectrometer for other chemical properties. View evidence ↗
What they found
- pH levels remained stable and within acceptable bounds, moving from 7.6–8.2 in source water to 7.9–8.0 after treatment. View evidence ↗
- Total dissolved solids (TDS) were highly effectively removed, dropping from 175 ppm (summer) and 124 ppm (winter) to 1 ppm and 2 ppm, respectively. View evidence ↗
- Turbidity was significantly reduced from 9.8 NTU (summer) and 0.9 NTU (winter) to 0.1 NTU and 0.07 NTU. View evidence ↗
- Alkalinity levels decreased from 138 ppm (summer) and 92 ppm (winter) to 3 ppm and 8 ppm. View evidence ↗
- Total hardness was reduced from 188 ppm (summer) and 162 ppm (winter) to 20 ppm and 12 ppm. View evidence ↗
- The RO system was least effective at removing lead, with only approximately 17% removal, leaving concentrations above permitted limits. View evidence ↗
What it means
- The authors conclude that reverse osmosis alone is insufficient for complete heavy metal removal and recommend adding activated carbon adsorption or ion exchange to lower HPI levels below 100. View evidence ↗
- The authors note that seasonal changes affect treatment effectiveness, necessitating continuous monitoring of water quality and operational conditions. View evidence ↗
Visual summary
2 visualsIllustrations explain the paper; charts are replotted from the paper's own table values.
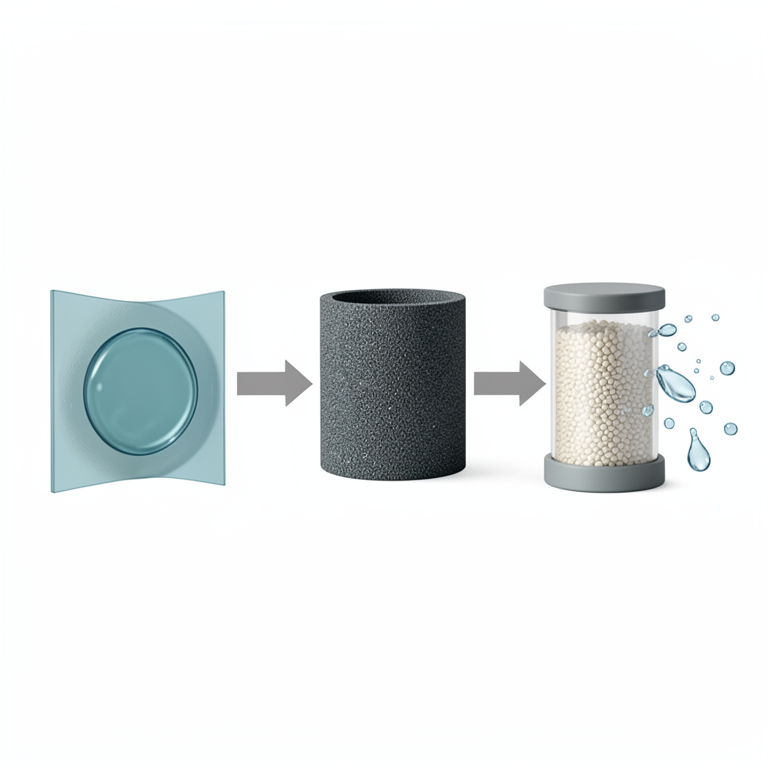
Proposed Water Treatment Sequence
AI-generated conceptual illustration (Reverse osmosis system with activated carbon and ion exchange filters). It explains the idea and does not show study data.
View source evidence ↗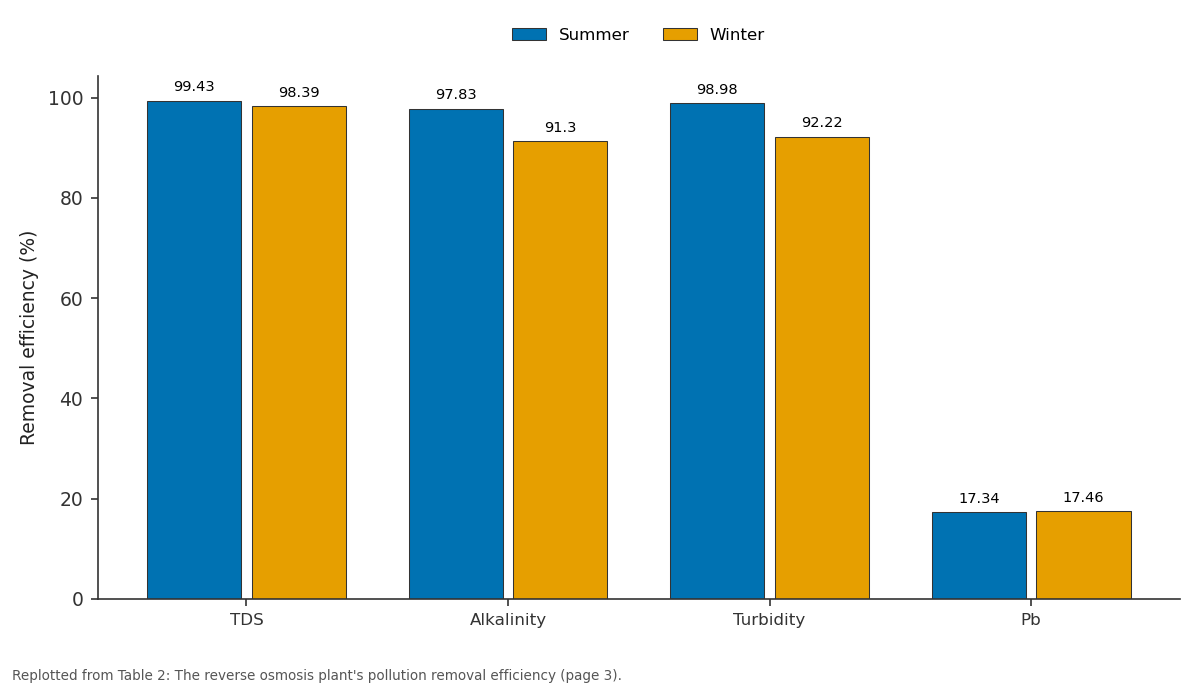
Summer and Winter: TDS vs Alkalinity vs Turbidity vs Pb
Replotted from Table 2 (page 3) of the original paper. Every bar is the paper's own table value.
View source evidence ↗Figures & tables
From the original paper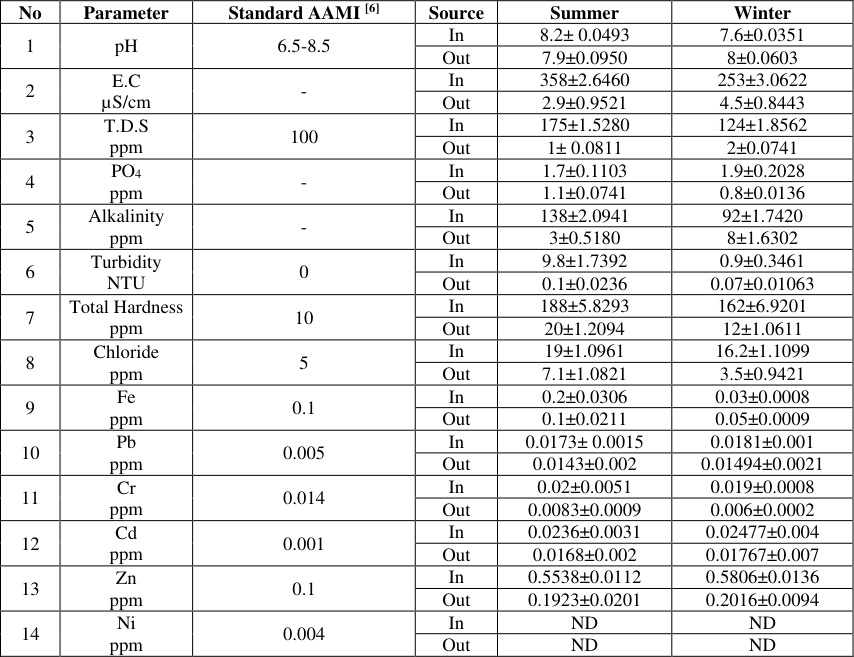 Table 1
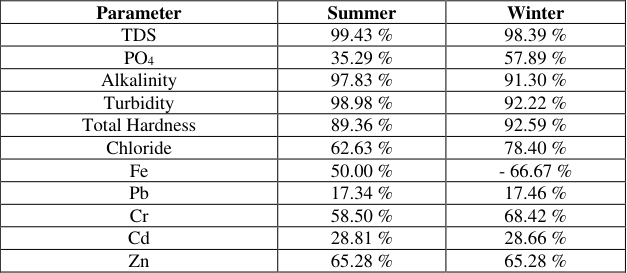 Table 2
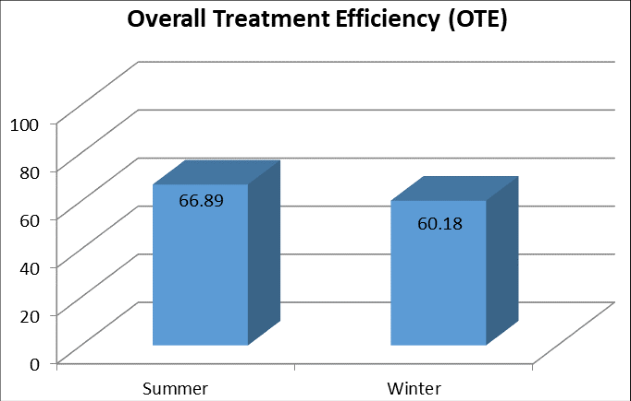 Figure 1
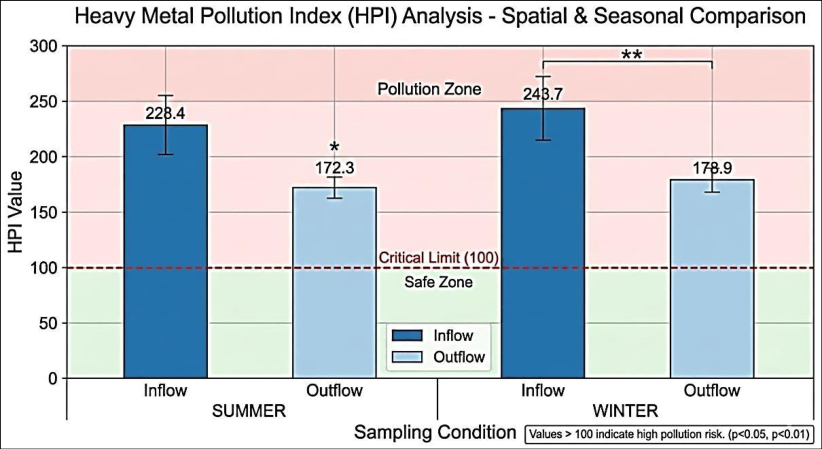 Figure 2
Introduction
Water is also an essential ingredient of most of the basic processes and is particularly noteworthy in terms of health, such as the renal dialysis process of those with kidney illness [1] . Dialysis is the main compensatory process of patients with renal failure to get rid of toxins and metabolic waste products accumulated in their blood, which is based on the principles of diffusion and filtration, and utilizes a semipermeable membrane that allows the passage of specific molecules and ions [2] . This process requires the presence of water and as the kidney dialysis patient will be subjected to between 90 and 190 liters of water during one dialysis session; the purity and quality of this water becomes a very important consideration to the patient [3] . The semipermeable membrane allows the easy passage of heavy metals and other chemical pollutants present in dialysis water to the circulation where they can build up in body tissues and lead to significant health effects with the most notable being metal poisoning [4] . Consequently, several health agencies including the American Association of Advancement of Medical Devices (AAMI) and the International Organization of Standardization (ISO) have come up with strict regulations and specific thresholds of each component or contaminant in water [5,6] .
Monitoring the quality of water in general and dialysis water in particular in scientific research in relation to the analytical component is important due to the high quality of water cleanliness and devoid of any chemical pollutants that may lead to a health problem or worsen the patient condition. Some of the most important of these substances or contaminants include heavy metals, sodium, potassium, chlorides and sulfates [7] . To achieve this, several complex chemical analysis methods are employed which may include spectroscopy, electrical conductivity testing, pH testing and atomic absorption spectroscopy. For accurately determining elemental and contaminant concentrations, these analytical chemistry techniques are crucial [8,9] . Reverse osmosis removes a great quantity of dissolved salts, organic matter, and heavy metals in the water with the help of semi-permeable membranes; that is why it is considered one of the most significant technologies applied in dialysis plants to treat water [10] . This technique is mostly applied in a combined system that incorporates pre-treatment steps such as filtering, dechlorination and softening to protect the reverse osmosis membranes and enhance their overall performance [11] . A number of past studies have been done to investigate quality of water used in dialysis machines and effectiveness of reverse osmosis systems to eliminate various contaminants [12] . Some study [13] has shown that when used and appropriately maintained, reverse osmosis machines can extract a considerable level of salts and heavy metals in water. The functionality of these systems, however, may be influenced by numerous factors, including the quality of the raw water fed into the system, the effectiveness of the pretreatment stages, the state of the membranes installed to it, and the level of their maintenance per year [14] . According to other studies, the lack of proper water treatment systems can cause the rise of certain elements in dialysis water, which can cause illness to patients and predispose them to dialysisrelated problems [15] . Consequently, analytical studies should be undertaken on a periodical basis to determine the effectiveness of water treatment systems in renal dialysis centers, more so where they use varying water sources that could possess varied physical and chemical characteristics [16] . This is because the quality of water should be continuously checked to ensure that it is of approved health standards [17] . Thus, the research problem is that there is a necessity to analyze the quality of the water used in dialysis units and the effectiveness of the treatment systems, especially reverse osmosis systems, to eliminate different chemical pollutants and provide the water with appropriate levels to be used in medicine. This research is intended to perform a chemical and analytical assessment of the water quality of dialysis units within the dialysis center in Hawija District, Kirkuk Governorate in 2025. This will be achieved by comparing the results with international criteria for the quality of water used in dialysis, as well as by analyzing a range of physical and chemical properties of the water both before and after treatment at the reverse osmosis plant. This will be useful in offering scientific data that will enhance the quality of care given to kidney failure patients in the area and enhance the efficiency of water treatment systems.
Materials and Methods
Materials and Methods
Study Site
This research was carried out in 2025 in the hemodialysis unit of Hawija District, Kirkuk Governorate, Iraq. The unit has a reverse osmosis (RO) water treatment device to generate high purity water to be used in dialysis solution.
Collecting Samples
Water samples were collected prior to and after the treatment using the RO system. The samples were collected in 1-liter sterile and clean bottles, kept under appropriate conditions, and transported to the lab as soon as possible to conduct chemical and physical analyses to exclude possible changes in their properties.
Physical and chemical tests
A Shimadzu AA-6200 atomic absorption spectrometer was used to measure heavy metals. A Jenway 3310 (Japan) was used to monitor pH. An EC meter BC 3020 (Singapore) was used to detect electrical conductivity (EC) and total dissolved solids (TDS). A HACH DR3900 visible light spectrometer was used to measure additional chemical characteristics. The TNTplus 10239 method was used to test alkalinity, the TNTplus 10291 method to measure chlorides (Cl⁻), and the TNTplus 10293 method to measure total hardness. The Persulfate UV Oxidation 8007 technique was used to measure phosphate (PO₄). The turbidity was tested by a turbidity meter and the results are presented in NTU.
The following formula was used to compare the concentrations of variables before and after treatment in order to determine the reverse osmosis system's contamination removal efficiency:
Where C before denotes the concentration of the element prior to treatment and C after signifies its concentration subsequent to treatment.
The Heavy Metal Pollution Index HPI is an index procedure which calculates the extent to which water supplies are generally contaminated by heavy metals. The two important criteria used to compute this index [18,19] were the standard allowable limit (Si) of each heavy metal [6] and unit weighted (Wi) of each individual metal which used the following equatio:
where (n) is the number of parameters taken into consideration, (Wi) is the unit weight, and (Qi) is the subindex of the (i) parameter.
Results
Table 1 presents the results of the physical and chemical properties of dialysis water prior to and following the treatment at the reverse osmosis plant. All pollution removal capacity of the reverse osmosis plant is presented in Table 2.
| Parameter | Summer | Winter |
|---|---|---|
| TDS | 99.43 % | 98.39 % |
| PO4 | 35.29 % | 57.89 % |
| Alkalinity | 97.83 % | 91.30 % |
| Turbidity | 98.98 % | 92.22 % |
| Total Hardness | 89.36 % | 92.59 % |
| Chloride | 62.63 % | 78.40 % |
| Fe | 50.00 % | - 66.67 % |
| Pb | 17.34 % | 17.46 % |
| Cr | 58.50 % | 68.42 % |
| Cd | 28.81 % | 28.66 % |
| Zn | 65.28 % | 65.28 % |
Table text extracted from the original PDF; superscript letters are shown inline. The original table image is below.
View original table image
| No | Parameter | Standard AAMI [6] | Source | Summer | Winter |
|---|---|---|---|---|---|
| 1 | pH | 6.5-8.5 | In | 8.2± 0.0493 | 7.6±0.0351 |
| Out | 7.9±0.0950 | 8±0.0603 | |||
| 2 | E.C µS/cm | - | In | 358±2.6460 | 253±3.0622 |
| Out | 2.9±0.9521 | 4.5±0.8443 | |||
| 3 | T.D.S ppm | 100 | In | 175±1.5280 | 124±1.8562 |
| Out | 1± 0.0811 | 2±0.0741 | |||
| 4 | PO4 ppm | - | In | 1.7±0.1103 | 1.9±0.2028 |
| Out | 1.1±0.0741 | 0.8±0.0136 | |||
| 5 | Alkalinity ppm | - | In | 138±2.0941 | 92±1.7420 |
| Out | 3±0.5180 | 8±1.6302 | |||
| 6 | Turbidity NTU | 0 | In | 9.8±1.7392 | 0.9±0.3461 |
| Out | 0.1±0.0236 | 0.07±0.01063 | |||
| 7 | Total Hardness ppm | 10 | In | 188±5.8293 | 162±6.9201 |
| Out | 20±1.2094 | 12±1.0611 | |||
| 8 | Chloride ppm | 5 | In | 19±1.0961 | 16.2±1.1099 |
| Out | 7.1±1.0821 | 3.5±0.9421 | |||
| 9 | Fe ppm | 0.1 | In | 0.2±0.0306 | 0.03±0.0008 |
| Out | 0.1±0.0211 | 0.05±0.0009 | |||
| 10 | Pb ppm | 0.005 | In | 0.0173± 0.0015 | 0.0181±0.001 |
| Out | 0.0143±0.002 | 0.01494±0.0021 | |||
| 11 | Cr ppm | 0.014 | In | 0.02±0.0051 | 0.019±0.0008 |
| Out | 0.0083±0.0009 | 0.006±0.0002 | |||
| 12 | Cd ppm | 0.001 | In | 0.0236±0.0031 | 0.02477±0.004 |
| Out | 0.0168±0.002 | 0.01767±0.007 | |||
| 13 | Zn ppm | 0.1 | In | 0.5538±0.0112 | 0.5806±0.0136 |
| Out | 0.1923±0.0201 | 0.2016±0.0094 | |||
| 14 | Ni ppm | 0.004 | In | ND | ND |
| Out | ND | ND |
Table text extracted from the original PDF; superscript letters are shown inline. The original table image is below.
View original table image
The overall statistics of the efficacies of the treatment plant during summer and winter are presented in Figure 1. Figure 2 shows the index of heavy metal pollution (HPI).
Discussion
The results in Table 1 shows that the physical and chemical properties of dialysis water treated with reverse osmosis technology have greatly improved. This shows the level of efficiency of the system in decreasing the levels of pollutants to a level that can be used in medicine. These results are especially significant as the renal failure patients are hypersensitive to any water quality alteration and such water directly flows into the blood during dialysis.
The findings made it clear that the ranges proved to be stable in internationally recognized ranges with pH values of 7.6 to 8.2 prior to treatment and 7.9 to 8.0 after treatment. This is in line with the recommendations put forward by the World Health Organization and the Association of Advancement of Medical Instrumentation which recommends that the pH should be maintained to be approximately at a neutral level. This stability is a very significant indicator that the treatment method did not cause any undesired changes in the chemical. Other researchers conducted in the past on the quality of dialysis water have also established that RO systems do not significantly affect the acid-base balance, and that the pH levels after treatment are within the acceptable values [20] . Electrical conductivity (EC) and total dissolved solids (TDS) were reduced significantly following treatment with TDS decreasing to 1-2 ppm, which means that virtually all the dissolved salts were eliminated. These results indicate the outstanding removal efficiency of 98.39-99.43 in Table 2. These findings are in line with a few studies that show that reverse osmosis is used to eliminate the total dissolved solids in dialysis plants [20,21] . Nevertheless, they are contrasted with the previous works that demonstrated that it is not possible to use reverse osmosis plants to eliminate total dissolved solids effectively [22,23] . Regarding turbidity, the outcomes indicated that the turbidity decreased significantly to very low levels (0.07-0.1 NTU) that is less than the global proportion of the recommended number (<1 NTU) by the World Health Organization. This decrease can be explained by the fact that the RO membranes are effective in removing small particles and suspended solids. This research established that a decrease in turbidity is a sure sign of better water quality and reduced possibility of microbial contamination [24] .
In addition, alkalinity and total hardness results (Table 2) indicated a tremendous decrease in results post-treatment with the removal efficiencies of (91.30-97.83%) and (89.36-92.59%), respectively. This shows that the system is efficient in eliminating calcium and magnesium ions, which may cause hazardous build-ups in dialysis equipment. These findings coincide with a 2021 study of dialysis water hardness by a Libyan researcher who found that after treating water, a reduction of hardness and alkalinity is a requirement to the dialysis water quality based on AAMI standards [20] . The concentrations of chloride ions (Cl -) decreased to safe concentrations within the recommended limits of the WHO (≤250 ppm) although the removal was only moderate (62.63-78.40%). These results were attributed to the selectivity of the reverse osmosis membranes, particularly, their permeability to some monovalent ions, which are more difficult to eliminate than divalent ions. The findings of the new study do not correspond with all the previous studies [25] but it does not agree with most of the previous studies [23,26] that found the concentrations of the chloride to be exceeding the permissible levels.
The effectiveness of heavy metals removal is also greatly different as the data in Tables 1 and2 demonstrates. Having a modest degree of removal, iron (Fe) levels were reduced to amounts of less than acceptable limits (≤0.3 ppm, as advised by the WHO) [25] . Table 2 indicates that lead (Pb) was the least effective at removal (approximately 17%), with Table 1 indicating that lead concentrations were in excess of what was permitted. Considering its great toxicity even in very low doses, it was observed in all models during the summer as well as during the winter. A maximum concentration of 0.01 ppm is advised by the WHO.
According to a study on lead toxicity in hemodialysis, longterm lead exposure in dialysis patients might cause major problems that call for better removal methods. The results obtained in the present study are consistent with other studies in the other fields [27,28] .
As per the studies on heavy metals in reverse osmosis, where it was proposed that the size of ions, as well as their charge, and their interaction with organic compounds, could influence the removal process, chromium (Cr) and cadmium (Cd) too showed moderate to poor removal efficiencies [25] . Nickel (Ni): on the other hand, the presence or absence of
International Journal of Advanced Chemistry Research https://www.chemistryjournals.net nickel (Ni) was not detected, which implies that the metal was present or absent in the amounts below the detectable limit, whereas zinc (Zn) showed excellent removal ability (approximately, 65%). The results of the current study are consistent with the findings of other studies on the efficacy of reverse osmosis to remove zinc, cadmium and chromium [25, 28] .
On the whole, these findings indicate that the reverse osmosis system is compliant with the World Health Organization (WHO) and Association of the Advancement of Medical Instrumentation (AAMI) standards in most parameters particularly in regard to dissolved salts, turbidity, and alkalinity [6,25] . But the fact that certain heavy metals, especially lead and cadmium, are not removed by the system very well implies that either routine maintenance or that more advanced processing processes, such as ion exchange or adsorption, are required to enhance the system. The total removal efficiency of the plant was recorded in 66.89% in the summer and 60.18% in the winter as indicated in Figure 1. Though reverse osmosis systems are considered to be one of the most effective ways to treat dialysis water, these findings are not surprising compared to the many studies conducted before them that demonstrated that they might require additional support to completely remove certain negative elements [25,26] . In order to guarantee patient safety and reduce the health hazards connected with using non-compliant water, this study suggests ongoing water quality monitoring and rigorous adherence to international standards. Both the inlet and outflow water of the two seasons show high pollution levels in both seasons as indicated by the Heavy Metal Pollution Index (HPI) in Figure 2. All values were evidently higher than the critical limit (100) that defines water as highly contaminated [27] . The HPI value of the intake water was 228.4 in the summer period which decreased to 172.3 after treatment and 243.7 to 178.9 after treatment in the winter period.
Overall, these findings reveal that the reverse osmosis system employed satisfies most of the World Health Organization (WHO) and Association of the Advancement of Medical Instrumentation (AAMI) criteria in the various indicators, especially the dissolved salts, turbidity, and alkalinity. Taking these findings with the data in Tables 1 and2, it becomes evident that the low efficiency of removing some heavy metals, namely lead (Pb) and cadmium (Cd), is the main reason of the steady high HPI levels. According to the results, both the removal efficiency of lead (~17%) and cadmium (~28%) was low (Table 2). The presence of these elements, even in relatively low concentrations, significantly enhances the index value since HPI index takes into consideration the relative weights and concentrations of harmful metals [28] . Additionally, both before and after therapy, HPI readings were greater in winter than in summer. Heavy metals' higher solubility or a shift in the sources of pollution during the rainy season could be the cause of this [29] . The efficiency of the RO system in reducing a significant percentage of the heavy metal burden is however evidenced by the change in relative decrease in HPI after treatment that is similar to the significant decrease in concentrations of metals such as zinc (Zn) and chromium (Cr) as shown in Table 1. The achievement of acceptable levels is however limited by the poor total eradication of some of the harmful components.
Thus, it can be said that employing reverse osmosis by itself might not be enough to ensure that dangerous heavy metals are completely eliminated. In order to ensure that the HPI levels are reduced to a level below the critical limit (100) and obtain the full compliance with the international standards, one can suggest adding such advanced stages of the treatment process as activated carbon adsorption or ion exchange to the basic operations of the membrane maintenance.
Altogether, the data presented in Figure 2 and Tables 1 and2 indicate that the quality of dialysis water still remains to be enhanced in terms of the ability to eliminate heavy metals despite the treatment to ensure patient safety and minimize the risks of long-term issues.
Conclusions
The results of the study prove the effectiveness of a reverse osmosis technology in increasing the quality of dialysis water. It significantly increased the quality of the water and made it suitable to specific medical purposes by enhancing most of the physical properties of the water and reducing the chemical contaminants like dissolved salts, turbidity, hardness and alkalinity. The results bring us to the conclusion that reverse osmosis can be rather effective to remove the typical impurities and improve the major properties of water. Not always was the elimination of heavy metals successful, however. Though the method was effective in reducing some of the heavy metals it was not effective in removing other metals that are hazardous to the health. This implies that employing reverse osmosis by itself might not be enough to ensure that all microcontaminants are eliminated. It was also observed that seasonal changes also influence the effectiveness of the treatments, which highlights the importance of continuous monitoring of the operational conditions and water quality received. Hence, though reverse osmosis is a simple and efficient step in dialysis water treatment process, to achieve the maximum level of safety, it is necessary to provide further levels of treatment, improved maintenance, and frequent monitoring procedures to ensure that the quality of water meets the needed health criteria.
References
26 in the original paper- Canaud B, Lucena R, Ward R. Water and dialysis fluid purity for contemporary hemodialysis. Seminars in Dialysis. 2025;12-24.
- Mathew AT, et al. Preservation of residual kidney function in hemodialysis patients: reviving an old concept. Kidney International. 2016;90(2):262-271.
- Payne GM, et al. Water treatment for hemodialysis: keeping patients safe. Nephrology Nursing Journal. 2021;48(4):315-345.
- Bowry SK, et al. Clinical relevance of abstruse transport phenomena in haemodialysis. Clinical Kidney Journal. 2021;14(Suppl 4):i85-i97.
- García-Lorenzo B, et al. Health Technology International Journal of Advanced Chemistry Research https://www.chemistryjournals.net Assessment of a new water quality monitoring technology: impact of automation, digitalization and remoteness in dialysis units. PLoS ONE. 2021;16(2):e0247450.
- Fishman MJ, Erdmann DE. Water analysis. Analytical Chemistry. 1973;45(5):361-403.
- Chaaben H, Cherif H, Elfil H. Reverse osmosis water purification and brine valorization in a Tunisian hemodialysis center. Separation Science and Technology. 2023;58(12):2166-2177.
- Ahmed MA, Amin S, Mohamed AA. Fouling in reverse osmosis membranes: monitoring, characterization, mitigation strategies and future directions. Heliyon. 2023;9(4):e14850.
- Jamaly S, et al. A short review on reverse osmosis pretreatment technologies. Desalination. 2014;354:3038.
- Kapepula VL, Luis P. Removal of heavy metals from wastewater using reverse osmosis. Frontiers in Chemical Engineering. 2024;6:1334816.
- Mohammed HA, Sachit DE, Al-Furaiji M. Applications and challenges of the reverse osmosis membrane process: a review. Journal of Engineering and Sustainable Development. 2023;27(5):630-646.
- Raimundo R, et al. Water quality and adverse health effects on the hemodialysis patients: an overview. Therapeutic Apheresis and Dialysis. 2023;27(6):10531063.
- Bieber S. Water treatment equipment for in-center hemodialysis. In: Handbook of dialysis therapy. Amsterdam: Elsevier; 2023. p. 80-92.
- Perveen S, et al. Drinking water quality monitoring, assessment and management in Pakistan: a review. Heliyon. 2023;9(3):e14166.
- Singh G, Kamal RK. Heavy metal contamination and its indexing approach for groundwater of Goa mining region, India. Applied Water Science. 2017;7(3):14791485.
- Mohan SV, Nithila P, Reddy SJ. Estimation of heavy metals in drinking water and development of heavy metal pollution index. Journal of Environmental Science & Health Part A. 1996;31(2):283-289.
- Alfarisi AA, et al. Water treatment for hemodialysis in Benghazi Medical Center (BMC). Asian Journal of Medicine and Health. 2021;19(1):48-62.
- Alizadeh M, et al. Microbiological and chemical indicators of water used in hemodialysis centers of hospitals affiliated to Zahedan University of Medical Sciences, 2012. Health and Development Journal. 2013;2(3):182-191.
- Anversa L, et al. Quality of dialysis water and dialysate in haemodialysis centres: highlight for occurrence of non-fermenting gram-negative bacilli. Journal of Applied Microbiology. 2022;132(4):3416-3429.
- Abd El Tawab ME, et al. Water quality for some dialysis centers of hospitals in Sharqia Governorate and its improvement approaches. International Journal of Theoretical and Applied Research. 2023;2(1):119-124.
- Zimoch I, Paciej J. Use of water turbidity as an identifier of microbiological contamination in the risk assessment of water consumer health. Desalination and Water Treatment. 2020;199:499-511.
- Humudat YR, Al-Naseri SK, Imran NJ. Water treatment for hemodialysis in Baghdad medical city, Iraq. Environmental Quality Management. 2022;32(2):243-249.
- Berkache K, et al. Variation in physico-chemical and bacteriological characteristics of dialysis water: a case study of eight hemodialysis centers. Desalination and Water Treatment. 2022;255:242-254.
- Abualhasan M, et al. Quality of water used in Palestinian hemodialysis centers. Public Health. 2018;165:136-141.
- Shahryari A, et al. Evaluation of bacteriological and chemical quality of dialysis water and fluid in Isfahan, Central Iran. Iranian Journal of Public Health. 2016;45(5):650-657.
- Gunes G. The change of metal pollution in the water and sediment of the Bartın River in rainy and dry seasons. Environmental Engineering Research. 2022;27(2):210115.